Materials Sciences and Applications
Vol.5 No.6(2014), Article ID:46369,14 pages DOI:10.4236/msa.2014.56046
Application of Single Angle Turbidimetry on Coag-Flocculation Effect of Detarium microcarpum Seed in Brewery Effluent
Bernard Ibezim Okolo1, Patrick Chukwudi Nnaji1, Matthew Chukwudi Menkiti2*, Victor Ifeanyi Ugonabo2, Okechukwu Dominic Onukwuli2
1Department of Chemical Engineering, Michael Okpara University of Agriculture, Umudike, Nigeria
2Department of Chemical Engineering, Nnamdi Azikiwe University, Awka, Nigeria
Email: *cmenkiti@yahoo.com
Copyright © 2014 by authors and Scientific Research Publishing Inc.
This work is licensed under the Creative Commons Attribution International License (CC BY).
http://creativecommons.org/licenses/by/4.0/


Received 13 February 2014; revised 19 March 2014; accepted 2 April 2014
ABSTRACT
Coagulation-flocculation is a proven technique for the removal of suspended solids in wastewater, through the application of single angle turbidimetric measurement. Through this measurement, the coag-flocculation kinetics and functional parameters behavior of Detarium microcarpumin brewery effluent with respect to pH, dosage and time were followed at room temperature. Process parameters such as order of reaction α, rate constant (K), coagulation period τ1/2 etc were determined. Results indicated that reaction order, rate constant, period, pH and dosage recorded optimum values at 2, 1.8 × 10⁻² L/mg∙min, 0.152 min, 4 and 100 mg/L, respectively. Maximum efficiency recorded was 96.07% at 30 min. Detarium microcarpum has shown potential as an effective bio-coagulant for the removal of turbidity from brewery effluent.
Keywords:Detarium microcarpum, Coagulation-Flocculation, Brewery Effluent, Turbidimetry

1. Introduction
The growing technology advancement and increasing population have led to the generation of numerous wastes, both domestic and industrial. Currently, there are many companies involved in the production of lager beer in Nigeria. This implies that the industry has contributed immensely to high level of waste generation. The raw effluent from brewery typically contains suspended solids in the range of 10 - 60 mg/L, biochemical oxygen demand in the range of 1000 - 1500 mg/L, COD in the range of 1800 - 3000 mg/L and nitrogen in the range of 30 - 100 mg/L [1] .
There are a number of processes available for water and wastewater treatment, such as chemical coagulation-flocculation, membrane filtration, adsorption on activated carbon, bio-degradation and electrochemical treatment [2] -[6] .
Among the methods mentioned, coagulation/flocculation is a proven technique for the treatment of high suspended solids wastewater, especially those formed by the colloidal matters. Meanwhile, research and practical applications have shown that coagulation will lower the pollution load and could generate an adequate water recovery [7] [8] .
The commonly used coagulants for water and wastewater treatment are chemical coagulants such as alum, ferric chloride and/or polymer which are added to wastewater in order to destabilize the colloidal materials and hence cause the small particles to agglomerate into large settle able flocs [9] . Aluminum sulfate (alum) has been widely used as a coagulant, but recently its use has been questioned due to evidence that Alzheimer’s disease may be associated with intake of alum [10] -[12] .
In this context, a coagulant which is environmentally friendly and inexpensive can be introduced as a viable alternative for the treatment of wastewater. In recent years, there have been intense interests in the application of plant based coagulant in water and wastewater treatment [13] -[16] . A typical precursor is Detarium microcarpum seed.
Detarium microcarpum seed is a non-toxic biodegradable plant tissue that is safe to human health. The proximate analysis in Table 2 has revealed its reasonable percentage protein content which suggested that DM could be used as a precursor.
The purpose of this work is to study the coagulation/flocculation behavior of Detarium microcarpum seed in brewery effluent for the removal of both total suspended and dissolved particles. Also it studied the effects of variation of dosage, settling time, pH etc. during coagulation. A series of jar tests were conducted in order to determine the optimal dosage and pH for coagulation and flocculation.
2. Theoretical Principles and Model Development
Assuming monodisperse, no break up and bi particle collision, the general model for Perikinetics Coag-flocculation is describe generally by [1] [17] [18] .
 (1)
(1)
where  is the rate of change of concentration of particle of size k (concentration/time).
 is a function of the coag-flocculation transport mechanism.
The appropriate value of  for Brownian transport is given by [17]
 (2)
(2)
where KB is Boltzman’s constant
 is Viscosity of the fluid
εP is collision efficiency T is absolute temperature(K)
The generic aggregation rate of particles (during coagulation/flocculation) can be derived by combination of Equations (1) and (2) to yield:
 (3)
(3)
where Nt is total particle concentration at time t, Nt = ∑nK (mass/volume).
K is the Menkonu coag-flocculation constant at αth order within flocculation belt.
 is the order of coagulation-flocculation.
Meanwhile,  (4)
(4)

where  is collision factor Brownian transport.
Also, (5)
(5)
Combining Equations (3)-(5) produce:
 (6)
(6)
where  is the Von Smoluchowski rate constant for rapid coagulation [19] .
 (7)
(7)
 (8)
(8)
 is particle diffusion Coefficientwhere a is particle radius.
From Einstein’s equation, particle Diffusion Coefficient is given by [20] .
 (9)
(9)
where B is the friction factor from strokes equation:
 (10)
(10)
where η is the viscosity of the coag-flocculation fluid.
Combing Equations (6) and (10) gives:
 (11)
(11)
Combining Equations (3) and (11) gives:
 (12)
(12)
For perikinetic aggregation, α theoretically equal 2 as would be shown below [19] .
From Fick’s law,
 (13)
(13)
Integrating Equation (13) at initial conditions Nt = 0, R = 2a:
 (14)
(14)
Thus (15)
(15)
For central particle of some size undergoing Brownian motion, the initial rate of rapid coag-flocculation is:
 (16)
(16)
 (17)
(17)

Hence, from Equation (17), α = 2 For α = 2; equivalence of Equation (3) yields:
 (18)
(18)
Hence  (19)
(19)
Thus  (20)
(20)
Plot of (1/N) Vs t produces a slope of K and intercept 1/No.
For the evaluation of coagulation period , from Equation (19).
 (21)
(21)
Where (22)
(22)
Hence:
 (23)
(23)
when t = τ, Equation (23) becomes
 (24)
(24)
Therefore as No → 0.5No; τ → τ1/2
Hence  (25)
(25)
For Brownian (perikinetic) aggregation at early stage (t ≤ 30 minutes), Equation (1) can be solved exactly, resulting in the generic expression [19] [21] .
 (26)
(26)
where ![]()
Hence, for singlets (m = 1)
 (27)
(27)
For doublets (m = 2)
 (28)
(28)
For triplets (m = 3)
 (29)
(29)
Conversion of Turbidity (NTU) to TSS (mg/L) [22] .
 (30)
(30)
where T = turbidity (NTU)
(TSSf) = Conversion factor to TSS.
Evaluation of coagulation-flocculation efficiency is given as
 (31)
(31)
3. Materials and Methods
3.1. Material Sampling, Preparation and Characterization
3.1.1. Brewery Effluent
The effluent was collected from brewery plant located in Enugu, Enugu State Nigeria. The characterization of the effluent and the analyses presented in Table 1 were determined based on standard method [23] [24] .
3.1.2. Detarium microcarpum Seed
Detarium microcarpum seed (precursor) was purchased from Ogbette Market, Enugu State Nigeria, and stored at room temperature. The characterization of the sample presented in Table 2 was based on AOAC standard

Table 1 . Characteristics of brewery effluent.
Table 2. Characteristics of Detarium microcarpum DM (precursor).
method [25] .
3.1.3. Preparation of Stock Solution of Coagulant
Detarium microcarpum seeds were allowed to mature and kept for sun dry. The seeds were ground to a fine powder using a kitchen blender to make it of approximate size of 600 µ to achieve solubilization of active ingredients in the seed.
3.2. Coagulation-Flocculation Experiment
Appropriate dose of DMC in the range of 100 - 500 mg/L was added directly to 300 mL of brewery effluent contained in a standard 1000 mL beaker (G.C 17) of 15 cm height, diameter 10.5 cm. The height of the effluent in the beaker was 3.5 cm. The suspension, tuned to pH range of 2 - 10 by addition of H2So4/NaoH. It was subjected to 2 minutes of rapid mixing (200 rpm), 20 minute of slow mixing (30 rpm) using a magnetic stirrer. After agitation, the suspension was transferred into a 250 ml cylinder (Jay Tec. UK) of height 33.5 cm, diameter 3.5 cm and the suspension height 27 cm. During settling, 10 mL of the supernatant were withdrawn from 2 cm depth and changes in TDSP (mg/L) measured for kinetic analysis (using WZS-185 MC Turbidimeter) at various interval of 3, 5, 10, 15, 20, 25 and 30 min. The experiment was carried out at room temperature. The obtained data were subsequently correlated with appropriate kinetic models.
4. Results and Discussion
4.1. Coag-Flocculation Kinetics
The values of coag-flocculation reaction parameters are presented in Tables 3 to 7. For α = 2 .solving equation 18 by integration method gives Equation (20), which is graphically presented in Figures 1-5. From the result, majority of R2 are greater than 0.9, which emphasized adequacy of the model.
 obtained for the entire coagulation/flocculation process is appreciably less sensitive to dosage variation (100 - 500 mg/L) than pH. This clearly shows that the pH variation exerts more influence than dosage variation. Also it should be noted that high K corresponds to low τ1/2, a relationship that establish strong correlation among k,
  and rate of reaction. Also there is a minimal variation in
  as observed in Tables 3-7, due to insignificant changes in temperature and viscosity of the coag-flocculation medium.
From the theoretical development in this study, ,
, ![]() and
and  are effective indicator of extent of coagulation. Minimum
  obtained in this study is in fraction of minutes and lies within the range of previous works where milliseconds had been reported [17] .
Table 3. Coag-flocculation kinetics parameter of DMC in BRE at varying pH and 100 mg/L dosage.
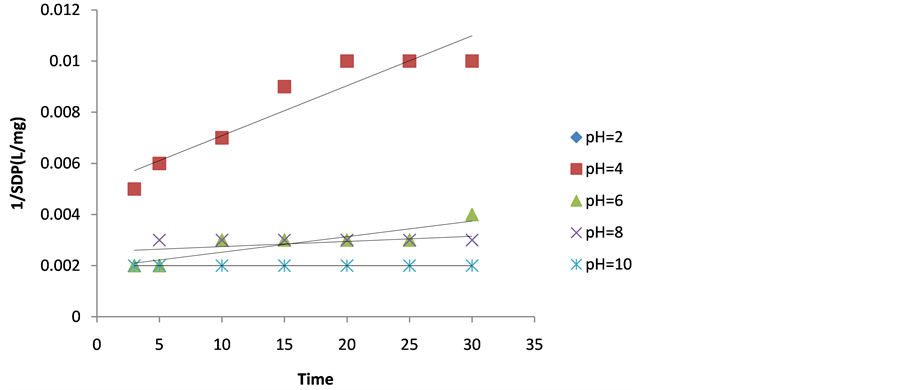
Figure 1. Plot of 1/SDP as a function of time for 100 mg/ LDMC dosage.
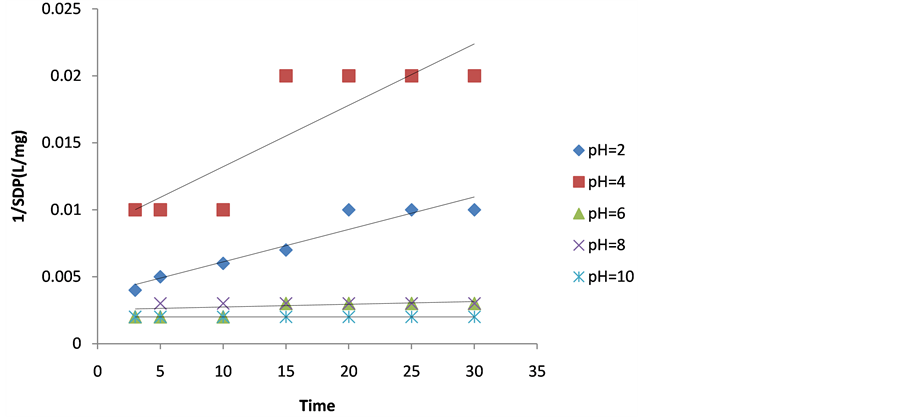
Figure 2. Plot of 1/SDP as a function of time for 200 mg/L DMC dosage.
Table 4. Coag-flocculation kinetics parameter of DMC in BRE at varying pH and 200 mg/L dosage.

Figure 3. Plot of 1/SDP as a function of time for 300 mg/ L DMC dosage.

Figure 4. Plot of 1/SDP as a function of time for 400 mg/ L DMC dosage.
Table 5. Coag-flocculation kinetics parameter of DMC in BRE at varying pH and 300 mg/L dosage.
4.2. Plot of Efficiency E(%) vs Time
These are shown in Figures 6-10. The E(%) indicates the effectiveness of DMC to remove suspended particles(turbidity) from the effluent. The significant feature shows that turbidity removal efficiency increases with increasing time. The efficiency at 3 min was generally between 60% - 85% at pH 2 and 4 respectively. From Figures 6-10, it can be observed that at 30 min of coag-flocculation, the least efficiency achieved was more than 90% at pH 2 and 4. The best performance was 96.01% and was achieved at pH 4 of 100 mg/L dosage. This shows that increase in pH and dosage affects the removal efficiency.
4.3. Plot of Efficiency E(%) vs pH
This is represented in Figure 11. It indicates the performance of various doses of DMC at varying pH. It is observed from Figure 11 that best performance of DMC in removing turbidity from BRE was obtained at pH 2 and 4 for 100 and 200 mg/L dosages, respectively.
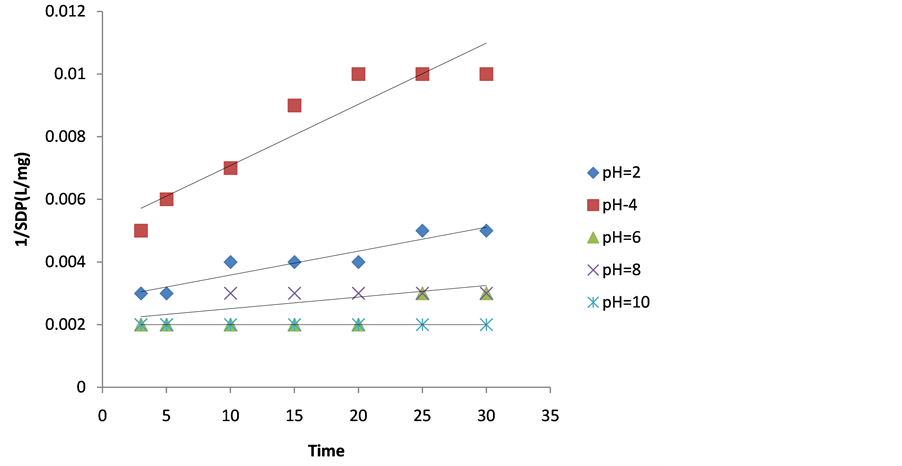
Figure 5. Plot of 1/SDP as a function of time for 500 mg/L DMC dosage.
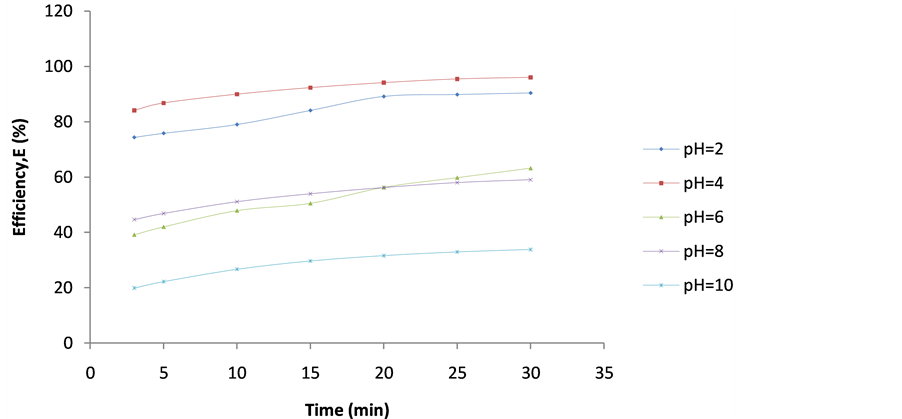
Figure 6. Plot of Efficiency (E%) vs coag-flocculation time for 100 mg/L DMC at varying pH.
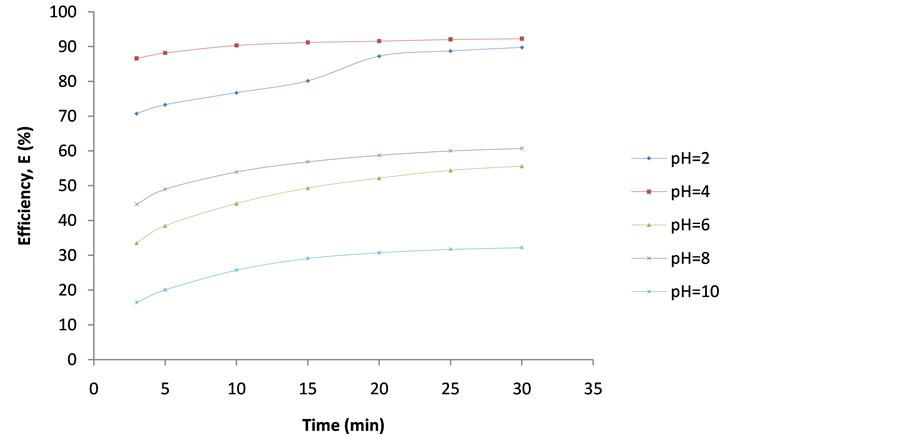
Figure 7. Plot of Efficiency (E%) vs coag-flocculation time for 200 mg/L DMC at varying Ph.
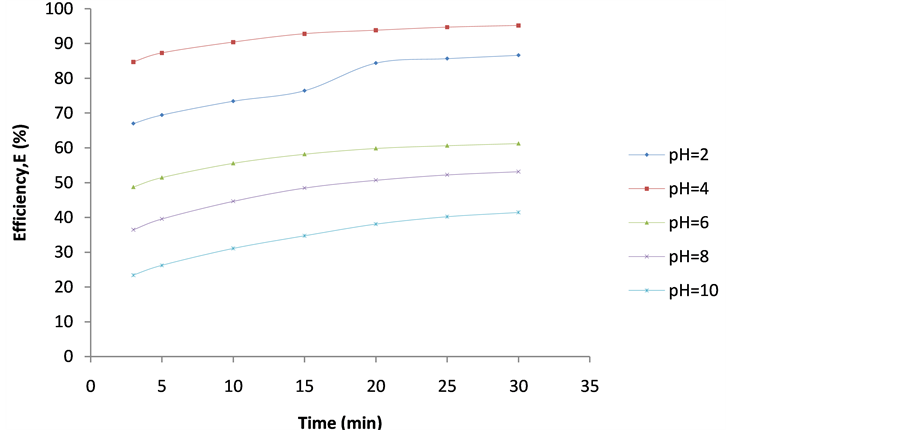
Figure 8. Plot of Efficiency (E%) vs coag-flocculation time for 300 mg/L DMC at varying pH.
Table 6. Coag-flocculation kinetics parameter of DMC in BRE at varying pH and 400 mg/L dosage.
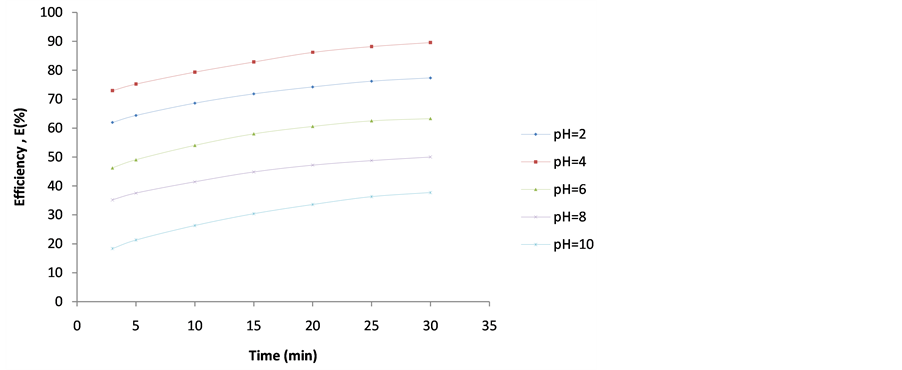
Figure 9. Plot of Efficiency (E%) vs coag-flocculation time for 40 0mg/L DMC at varying pH.
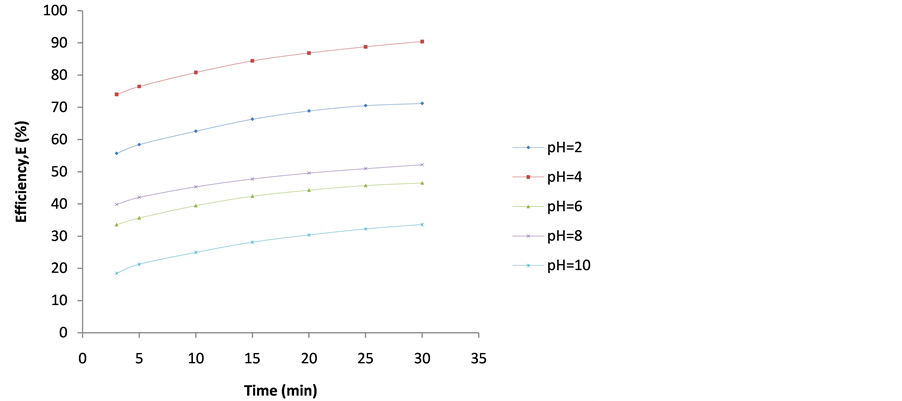
Figure 10. Plot of Efficiency (E%) vs coag-flocculation time for 500 mg/L DMC at varying pH.
Table 7. Coag-flocculation kinetics parameter of DMC in BRE at varying pH and 500 mg/L dosage.
5. Particle Distribution Plots
The microscopic particle aggregation was obtained by substituting  from equation 27 into 29. The microscopic aggregation is graphically illustrated by the interaction of singlet (m = 1), doublets (m = 2) and triplets (m = 3). The representative plots are presented in Figure 12 and Figure 13. Both represent the time evolution for singlet, doublets and triplets obtained for
  and 62.48 min. For Figure 12, the sum of particles
  and number of singlets particles
  are at maximum, at t = 0 because they are to record reduction in particle count due to flocculation. But the number of singlets particles decreases more rapidly than the sum of particles Ni following rapid aggregation at early stage. This is an indication that early stage of the coag-flocculation is affected by colloidal destabilization and particle entrapment due to high particle count at early stage.
For Figure 13, the initial concentration decreases gently. From the curve obtained, it shows that there was a moderate colloidal destabilization and high shear resistance. Mainly, the dominant mechanisms were low charged neutralization and bridging to ensure moderate speed of coag-flocculation.
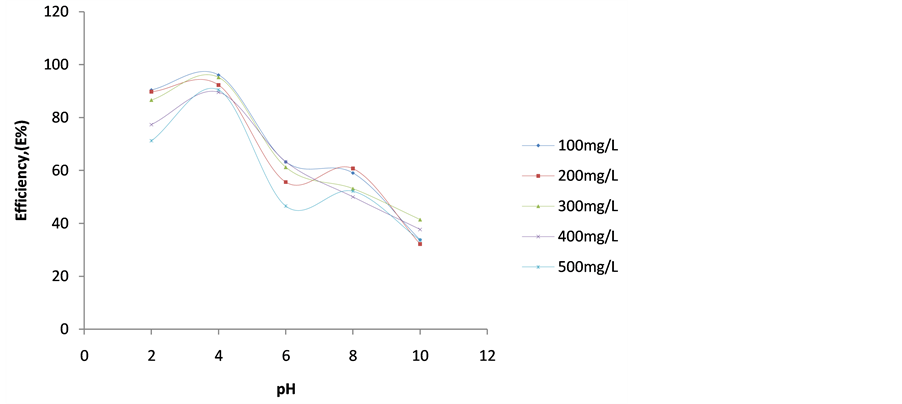
Figure 11. Plot of Efficiency (E%) vs pH at 30 mins for varying DMC dosages.
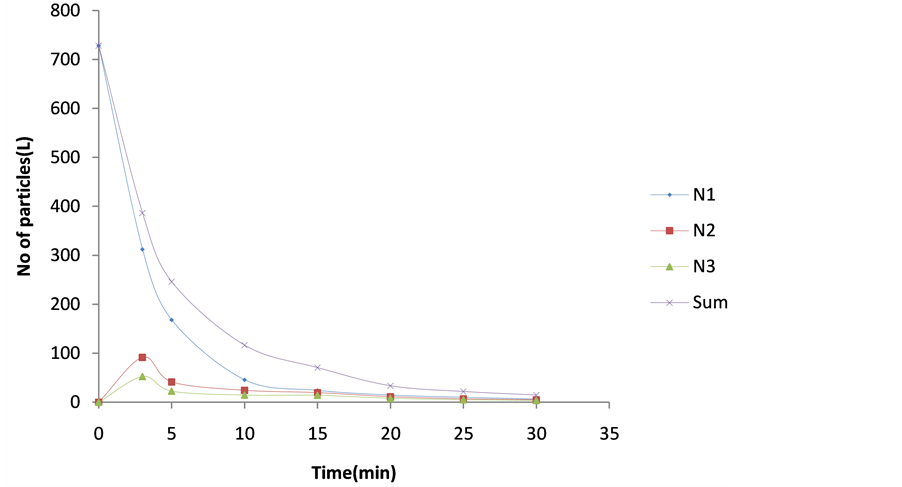
Figure 12. Temporal microscopic aggregate distribution at minimum half-life of 0.152 min.
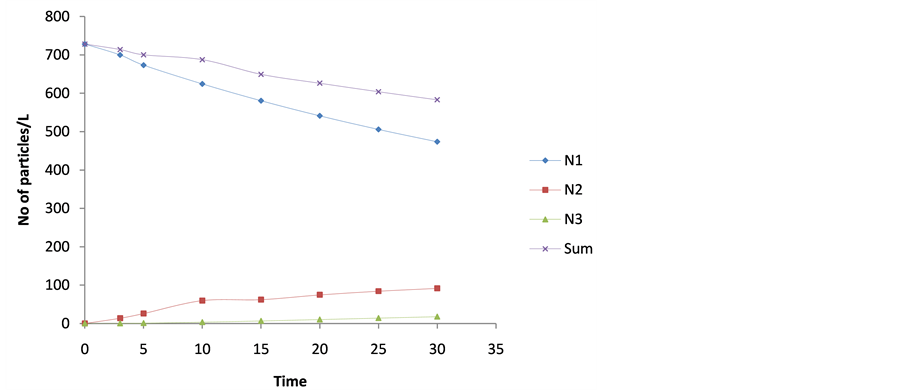
Figure 13. Temporal microscopic aggregate distribution at maximum halflife of 62.48 min.
6. Conclusion
At the condition of the experiment, the potential of DMC as an effective organic coag-flocculation has been established. The optimum pH, dosages and  recorded are 4, (100 and 200 mg/L) and 0.152 min, respectively. The obtained results are generally in agreement with previous works and in conformity with perikinetic theory.
References
- Menkiti, M.C., Onyechi, C.A. and Onukuli, O.D. (2011) Evaluation of Perikinetics Compliance for the Coag-Flocculation of Brewery Effluent by Brachystegia Eurycoma Seed Extract. International journal of Multidisciplinary Sciences and Engineering, 2, 73-80.
- Sher, F., Malik, A. and Liu, H. (2013) Industrial Polymer Effluent Treatment by Chemical Coag-Flocculation. Journal of Environmental Chemical Engineering, 1, 1684-1689. http://dx.doi.org/10.1016/j.jece.2013.07.003
- Swami, D. and Buddhi, D. (2006) Removal of Contaminants from Industrial Wastewater through Various Non-Conventional Technologies: A Review. Environment and Pollution, 27, 324-346.
- Kawashima, A., et al. (2011) Physiochemical Characteristics of Carbonaceous Adsorbent for Dioxin-Like Polychlorinated Biphyl Adsorption. Chemosphere, 83, 823-830. http://dx.doi.org/10.1016/j.chemosphere.2011.02.074
- Moo-Young, H.K. (2007) Pulp and Paper Effluent Management. Water Environment Research, 79, 1733-1741. http://dx.doi.org/10.2175/106143007X218566
- Ghafari, S., et al. (2009) Application of Response Methodology (RSM) to Optimize Coagulation-Flocculation Treatment of Leachate Using Poly-Aluminum Chloride (PAC) and Alum. Journal of Hazardous Materials, 163, 650-656.
- Al-Malack, M.H., Abuzaid, N.S. and El-Mubarak, A.H. (1999) Coagulation of Polymeric Wastewater Discharged by a Chemical Factory. Water Research, 33, 521-529. http://dx.doi.org/10.1016/S0043-1354(98)00219-X
- Aguilar, M.I., Saez, J., Llorens, M. and Ortuno, J.F. (2002) Nutrient Removal and Sludge Production in the Coagulation Flocculation Process. Water Research, 36, 2910-2919. http://dx.doi.org/10.1016/S0043-1354(01)00508-5
- Tatsi. A.A., Zouboulis, A.I., Matis, K.A. and Smara, P. (2003) Coagulation/Flocculation Pre-Treatment of Sanitary Landfill Leachates. Chemosphere, 53, 737-744. http://dx.doi.org/10.1016/S0045-6535(03)00513-7
- Abdel Shafy, H.I. and Emam, A.-B.S. (1991) Chemical Treatment of Industrial Wastewater, Environ. Manage Health, 2, 19-23. http://dx.doi.org/10.1108/EUM0000000002787
- Vijayaraghavan, G., Sivakumar, T. and Vimal Kumar, A (2011) Application of Plant Based Coagulants for Wastewater Treatment. International Journal of Advanced Engineering Research and Studies, 188-192.
- Walton, J.R. and Wang, M-X. (2009)APP Expression, Distribution and Accumulation Are Altered by Aluminum in a Rodent Model for Alzhelmer’s Disease. Journal of Inorganic Biochemistry, 103, 1548-1554. http://dx.doi.org/10.1016/j.jinorgbio.2009.07.027
- Ndbigengesere, A. and Narasiash, K.S. (1998) Quality of Water Treated by Coagulation Using Moringa Oleifera Seeds. Water Research, 32, 781-791. http://dx.doi.org/10.1016/S0043-1354(97)00295-9
- Menkiti, M.C., Nnaji, P.C., Nwoye, C.I. and Onukwuli, O.D. (2010) Coag-Flocculation Kinetics and Functional Parameters Response of Mucuna Coagulant to pH Variation in Organic Rich Coal Effluent Medium. Journal of Mineral and Material Characterization and Engineering, 9, 89-103.
- Folkard, G.K. and Sutherland, J.P. (2002) Development of Naturally Derived Coagulant for Water and Wastewater Treatment. Water Science and Technology: Water Supply, 2, 89-94.
- Okuda, T., Naes, A.U., Nishijima, W. and Okada, M. (2001) Coagulation Mechanism of Salt Solution Extracted Active Component in Moringa oleifera Seeds. Water Research, 35, 830-834. http://dx.doi.org/10.1016/S0043-1354(00)00296-7
- Von Smoluchowski, M. (1917) Verucheiner Mathemtischen Theorie der Koagulations Kinetic kolloider Lousungen. International Journal of Research in Physical Chemistry and Chemical Physics, 92, 129-168.
- Hunter, R.J. (1993) Introduction to Modern Colloid Science. 4th Edition, University Press, New York.
- Holthoff, H., Egelhaaf, S.U., Shurtenberger, P. and Sticher, H. (1996) Coagulation Rate Measurement of Colloidal Particles by Simultaneous Static and Dynamic Light Scattering. Langmuir, 12, 5541-5549.
- Menkiti, M.C. (2007) Studies on Coagulation and of Coal Washery Effluent: Turbidmetric Approach. MSc Thesis, Nnamdi Azikiwe University, Awka, 51.
- Menkiti, M.C., Nnaji, P.C. and Onukwuli, O.D. (2009) Coag-Flocculation Kinetics and Functional Parameters Response of Periwinkle Shell Coagulant (PSC) to pH Variation in Organic Rich Coal Effluent Medium. Nature and Science, 7, 1-8.
- MetCalf and Eddy (2003) Physical Unit Process, Wastewater Engineering Treatment and Reuse. 4th Edition, Tata McGraw-Hill, New York.
- Clesceri, L.S., Greenberg, A.E. and Eaton, A.D. (1999) Standard Methods for the Examination of Water and Waste Water. 20th Edition, APHA, Washington DC.
- AWWA (2005) Standard Methods for the Examination of Water and Wastewater Effluent. American Water Works Association, New York.
- AOAC (1993) Official Methods of Analysis. 14th Edition, Association of Official Analytical Chemist, Gaithersburg.
Nomenclature
K: Coag-flocculation reaction rate constant
 : Collision factor for Brownian Transport
![]() : Collision Efficiency
: Collision Efficiency
 : Coagulation Period/Half life E: Coag-flocculation Efficiency
 : Regression coefficient of Determination
 : Smoluchowski coag-flocculation constant
α: Coag-flocculation reaction order
‒r: Coag-flocculation reaction rate
 : Flux SDP: Suspended Dissolved Particles DMC: Detarium microcarpum Coagulant BRE: Brewery Effluent
NOTES

*Corresponding author.