Applied Mathematics
Vol.09 No.06(2018), Article ID:85477,25 pages
10.4236/am.2018.96045
A Mathematical Model for Nutrient Metabolic Chemistry
Donald A. Drew
Department of Mathematical Sciences, Rensselaer Polytechnic Institute, Troy, USA
Copyright © 2018 by author and Scientific Research Publishing Inc.
This work is licensed under the Creative Commons Attribution International License (CC BY 4.0).
http://creativecommons.org/licenses/by/4.0/


Received: May 14, 2018; Accepted: June 22, 2018; Published: June 25, 2018
ABSTRACT
A model based on chemical kinetics for the rate of utilization and/or storage of carbohydrates, fats and proteins is derived and analyzed. This system is studied under different conditions of supply and usage and for short term dynamics and long term dynamics. Both the short term and long term models indicate that starting above an equilibrium threshold leads to growth of the stored species. Results from the short-term and long-term submodels show that the qualitative behavior depends on the levels of certain enzymes. The analysis of a model for enzyme dynamics indicates that the steady-state level of an enzyme should depend on the rate of supply of the substrate.
Keywords:
Nutrient Metabolic Chemistry

1. Introduction
When food is consumed, digestive processes break up the macroscopic chunks of meat, vegetables, bread, beverages and sweets into small organic molecules, minerals, and salts. Carbohydrates, fats and proteins are converted to simple sugars, fatty acids, and amino acids for absorption and utilization by the body for manufacturing tissue and for energy to maintain temperature, activate muscles, and run the signaling and neural systems. If the organism consumes more than it uses, the excess can be stored for use in the future.
Under normal circumstances, simple sugars, fatty acids and amino acids pass through the gastric-blood boundary and enter cells and organs where they can participate in the metabolic processes. The dominant simple sugar is glucose, which can enter the pathway to the Krebs cycle by being converted to pyruvate. In addition, pyruvate can be converted back to glucose by a different reaction. Simple sugars can be converted to glycogen, a complex molecule of linked glucose chains, which can be stored in cells. Fatty acids can be processed into acetyl coenzyme A or converted into lipid chains, which can be stored. Similarly, acetyl-CoA can be converted to fatty acids or further processed into the Krebs cycle. Amino acids can be used to synthesize proteins, or can feed into the energy generation machinery. All of these reactions are facilitated by enzymes.
The goal of this paper is to derive a model for the dynamics of the utilization and storage processes, and to analyze the behavior of that model. At any instant the body contains a certain number of simple sugars, fatty acids, and amino acids. The body uses enzymes to convert these molecules to energy via the Krebs cycle, or to store them for later use as energy. Starting from this point of view, we are led to a model for the evolution of three energetic species, namely simple sugars, fatty acids and amino acids, three storable species, glycogen, fat, and proteins, and two energy transfer molecules, pyruvate and acetyl-CoA. The species have sources from diet, losses through excretion, and conversion rates between them. We are interested in the qualitative behavior of this model (as opposed to numerical predictions), and in particular whether and under what conditions the system can evolve to high levels of stored fat. This behavior may identify biochemical mechanisms that contribute to obesity.
Metabolic reactions occur in parts of the human body downstream of the gastric-blood boundary. In actuality, some reactions occur in mitochondria in most cells, some occur in organs such as the liver, and some occur in tissue such as muscles or the brain. We shall assume that these reactions change the amount of each of the several substances in the body according to a set of enzymatic reaction equations. These reactions occur on time scales of minutes to hours to days. For example, the rise in insulin levels caused by elevated blood glucose levels resulting in glucose being admitted into cells and processed occurs in a few minutes to an hour. The corresponding chemical activations, molecular processing and inter-organ transport cycle through feedings and elevated processing occur several times a day. On a longer scale, on the order of several days to weeks, adults reach a sort of stasis where intake, utilization, storage and excretion are in balance. We shall examine aspects of the model that occur on these disparate time scales in order to discover biochemical bases to determine behavior of the system on the different time scales.
Alpert [1] [2] proposed and analyzed a two-reservoir model for fat and lean. Chow & Hall [3] [4] [5] extended this approach to a model that considers the three substances that can be roughly described as glycogen (the stored form of carbohydrates), fats, and proteins. We call this the CFP model (for carbohydrate-fat-protein). They argue from the point of view of energetics, so that weight is a combination of the amounts of the three substances, plus “fixed” weight (bone, minerals, etc.). They further assume that glucose and glycogen do not change sufficiently to warrant inclusion in the variable part of the weight, and finally assume a relation between “fat” and “lean” (FL model) in the form of a Forbes factor. This model has the advantage that it is straightforward, has features that reflect some realities in the organism (specifically, formulating in terms of energy, and recognizing the equivalence and conversions between energy and weight), and has been fit to various data. Recently, Pearson, et al. [6] [7] have refined the CFP model to describe the ability of the body to shift from carbohydrate oxidation to fatty acid (lipid) oxidation. They model the effect of insulin, which is the controlling factor for uptake of glucose by the cells.
In this paper, we take a somewhat different approach. Instead of energetics, we derive a model for the fundamental biochemistry of metabolism. This model considers chemical balance equations for the products of dietary carbohydrates, fats, and proteins in the body, and includes (meta) chemical reactions that convert simple sugars into glycogen or pyruvate, that convert fatty acids to fat or acetyl-CoA, that convert amino acids to pyruvate or acetyl-CoA or proteins, and that convert acetyl-CoA into energy (i.e., ATP) through the Krebs cycle.
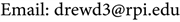
This model should be regarded as somewhat more than qualitative, but not quite quantitative. First, the actual metabolic reactions are more complex than represented in Figure 1 (see Berg, et al. [8] ), with several subspecies produced and further reduced in each reaction represented there. Further, most, if not all, of the reactions are catalyzed by more than one enzyme. And finally, the “reverse” reactions are actually more complicated reactions that are not simply splitting or reuniting of the species displayed. In addition, three of the species

Figure 1. A schematic of the reactions.
shown are actually molecules that are stored in adipose tissue, in liver and in muscle. Nonetheless, the general flow of energy-rich species to energy or storage is represented here.
2. Enzyme-Controlled Mass Action Model
We posit a mass-action chemistry model (see Figure 1) for the evolution of fats, carbohydrates and proteins. Let SS be the abundance of simple sugars, FA be the abundance of fatty acids, AA be the abundance of amino acids, G be the abundance of glycogen, F be the abundance of fat, and P be the abundance of proteins. The pathway to energy utilization involves two molecules, pyruvate (symbol Pyr), which is an entry molecule, and acetyl-CoA (symbol AcA), which feeds into the Krebs cycle.
These substances undergo enzymatic reactions in the body to extract energy or be processed into the organism. The reaction structure is shown in Figure 1. Simple sugars are supplied at rate S1, stored at rate r2, released from storage at rate r1, and converted to pyruvate at rate r4. Fatty acids are supplied at rate S2, converted to fat at rate r8, released from storage at rate r7, converted to acetyl-CoA at rate r6, and synthesized from acetyl-CoA at rate r9. Amino acids are supplied at rate S3 converted to proteins at rate r12, and body proteins are broken down into amino acids at rate r13. Pyruvate is converted to simple sugar at rate r3, and converted to acetyl-CoA at rate r5. Acetyl-CoA is converted to fatty acid at rate r9 and enters the Krebs cycle at rate r15.
Human biochemistry machinery can synthesize certain of the amino acids from components from the Krebs cycle and cannot synthesize others [8] . The amino acids that can be synthesized by the body are called “non-essential”, and those that cannot be manufactured by the body are called “essential”, and must be supplied by diet. We further note that amino acids are also classified as “ketogenic” and “glucogenic”, depending on where they enter the network in terms of energy production. The reaction structure for amino acids accounts for these two different classes of amino acids. We model this by assuming that the meta-class AA can be manufactured from pyruvate (the non-essential amino acids), and can be metabolized to either pyruvate or acetyl-CoA. We note that most of the essential amino acids are ketogenic; consequently, we do not include a reaction that converts acetyl-CoA to (ketogenic) amino acids. For the amino acids that can be converted to pyruvate, we denote this rate as r11. Pyruvate can be reacted to form certain amino acids at rate r10. The remaining amino acids can be converted to acetyl-CoA, at rate r14.
The fatty acid cholesterol can be converted to bile, which can enter the intestines and be reabsorbed or excreted. We model this as a rate constant for excretion of fatty acids. This is a natural, healthy excretion. We notice that proteins and sugars can also be excreted, but the amounts excreted in normal healthy individuals are small, and neglected in this model.
The metabolic reactions are discussed in entry-level biochemistry texts (see, for example, Berg, et al. [8] ). These reactions occur in most of the body’s cells, some in the mitochondria, and some in specific types of cells such as liver or muscle. However, no hard numbers exist for reaction rates. Moreover, most of the reactions we discuss here are catalyzed by enzymes, so that the reaction rate depends on the level of the enzyme.
(2.1a)
(2.1b)
(2.1c)
(2.1d)
(2.1e)
(2.1f)
(2.1g)
(2.1h)
Most of the reactions represented in Equations (2.1) are facilitated by enzymes. Many have been analyzed in some detail, and show that several steps occur in what we write as a one-step reaction, and involve more than one enzyme. Specifically, the conversion of pyruvate to glucose is catalyzed by pyruvate kinase. The conversion of glucose to pyruvate involves several intermediates and enzymes, including hexokinase, phosphoglucose isomerase, phosphofructokinase, fructose biphosphate aldolase, triosephosphate isomerase, glyceraldehyde phosphate dehydrogenase, phosphoglycerate kinase, phosphoglycerate mutase, enolase, and pyruvate kinase. The reaction that produces glycogen from glucose is catalyzed by UDP-glucose pyrophosphorylase. Glycogen is cleaved from its chains by glycogen phosphorylase. Pyruvate is converted to acetyl-CoA by pyruvate dehydrogenase complex. Fatty acids are released from triglycerides by the action of pancreatic lipase. Triglycerides are converted from acetyl-CoA by diglyceride acyltransferase. Citrate synthase catalyzes the reaction of the acetate residue from-CoA and oxaloacetate to form carbon citrate.
Phosphofructosekinase (PFK) is believed to be the controlling enzyme in glycolysis. It, in turn, is regulated by ATP and AMP, by phosphoenolpyruvic acid (PEP) and citrate. All of these species are produced downstream of the reaction catalyzed by PFK. Pyruvate dehydrogenase complex is regulated by ATP and AMP, by acetyl-CoA and NADH. Citrate synthase is the enzyme that controls the entrance of acetyl-CoA into the Krebs cycle. The action of citrate synthase is regulated by ATP, acetyl-CoA and NADH.
Glycogen phosphorylase is regulated by epinephrine, insulin and glucagon.
Fatty acids are transported across the outer mitochondrial membrane by carnitine palmitoyl transferase I (CPT1), where they participate in the reactions to produce energy in the form of ATP. The step involving CPT1 is believed to be the rate-limiting step in fatty acid oxidation. CPT1 is inhibited by malonyl-CoA, which is formed by carboxylating acetyl-CoA. The conversion of acetyl-CoA to fatty acid is catalyzed by acetyl-CoA:ACP transacylase, malonyl-CoA:ACP transacylase, 3-ketoacyl-ACP synthase, 3-ketoacyl-ACP reductase, 3-hydroxacyl ACP dehydrase and enoyl-ACP reductase.
Fatty acid synthase (FAS) catalyzes fatty acid synthesis. Its main function is to catalyze the synthesis of palmitate from acetyl-CoA and malonyl-CoA, in the presence of NADPH, into long-chain saturated fatty acids.
It is clear that a model that attempts to account for all these reactions would be cumbersome. Our goal is to add understanding to what determines the reaction rates and fates for classes of nutrients. Consequently, we assume one “effective enzyme” for each reaction in Equation (2.1).
2.1. Reaction Models
We assume that all catalyzed reactions are described by a Hill’s equation, that is, the reaction rate is of the form
(2.2)
Here is the abundance of species i, which is being converted by the jth reaction. is the abundance of enzyme j, is the dissociation constant and is its conversion rate. For simplicity in calculations, we write , and refer to as the effective conversion rate. In the context of this model, we expect that eating a meal causes spikes in amino acids, carbohydrates and fatty acids. Their levels rise far above the levels of the the enzymes that convert them to energy or to storable species. In this case, the Hill’s model saturates with almost all of the enzymes bound to substrate molecules, so that the rate of conversion is constant. As the reactions proceed, the species levels fall so that not all enzymes are bound, and the conversion rate depends on abundance.
The rates of storage of fats and glycogen involve a reaction which adds the simple molecule to accumulations of the stored molecules. Thus the reaction that converts carbohydrates to glycogen is of the form
(2.3)
and the addition of fatty acids to adipose tissue is
(2.4)
Furthermore, excretion of lipids occurs by reabsorption through the intestinal wall. We assume the excretion of fatty acids in the intestines can be modeled as , where is a constant. Finally, we shall assume that the rate of conversion of acetyl-CoA to energy is given, presumably by the exercise routine. Hence, we assume , the rate of energy usage.
Protein synthesis is accomplished by the mechanism whereby an amino acid, bound to its transfer RNA counterpart, is in turn bound to a peptide chain by the action of a ribosome. A rate of synthesis can be determined in terms of reaction rates for sub-processes [9] [10] . There appear to be several controls in this process [8] . Protein degradation is accomplished by two main pathways, proteolysis, where all cytosolic proteins are broken down in lysosomes into amino acids, and the more specific process of ubiquitination followed by degradation in a protease complex. We model this set of complex processes by 1) synthesis from amino acids in the form (2.2), and 2) a rate constant k13 at which proteins are degraded into amino acids.
2.2. The CFP Model
With these assumptions, the equations for the evolution of nutrients and intermediaries become
(2.5a)
(2.5b)
(2.5c)
(2.5d)
(2.5e)
(2.5f)
(2.5g)
(2.5h)
This model for the evolution of carbohydrates, fats and proteins (CFP model) derived in this section has eight dependent variables, 27 parameters, three supply rates and the rate of energy usage. Given initial values for each species and bounded smooth supply and usage rates, a unique solution will exist in the eight dimensional phase space for at least a short time, and most such solutions will persist for an infinite time. A fundamental question about such systems is whether solutions grow, decay, or oscillate in phase space. In the next two sections, we show some of the behaviors for this model (or sensible approximations thereof). In Section 3 we examine what we consider to be a model valid for short times by considering the storage and release of an energy molecule, such as occurs in the simple sugar-glycogen subsystem. In Section 4 we examine the system for behavior on a long time scale, with constant supply rates and constant energy usage both representing the long-time average supply and usage.
3. Analysis of Storage-Activation Model
In this section, we focus on the short-time behavior of a subsystem of the model that gives some qualitative understanding of the dynamics of Equation (2.5). We consider the competition between energy storage and usage in the short term, specifically on a scale of a several minutes to a few hours when energy molecules are used or stored. The sub-models for carbohydrates and for fats are of similar storage-activation form. We assume that the rates at which energy molecules enter the Krebs cycle are well controlled. Specifically, we assume that and and are known. These latter rates are related to exercise by the individual. This assumption is further justified by the fact that ATP feeds back to control the activities of several enzymes in the carbohydrate and fatty acid metabolism reactions.
3.1. Basic Short-Term Model
Both the glucose-glycogen submodel and the fatty acid-fat submodel are of the same form, with the equations for simple sugars and fatty acids being essentially the same. We treat them as a system of equations for an energetic molecule, , being either SS or FA, and a storage molecule, , being either G or F. The system has the form
(3.1a)
(3.1b)
Here is the supply rate of the energy molecule, and we denote the rate at which the stored molecule is released as kr and the rate at which the energy molecule is stored as ks. Also, Kr is the dissociation constant for the release reaction, and Ks is the dissociation constant for storage.
Adding the equations gives the equation for the total molecules. We shall examine two extreme cases, 1) constant, and 2) having Dirac delta function form. The first represents constant feeding and sedentary energy usage. The second represents rapid ingestion and passing the gastric-blood barrier, followed by hard exercise.
This leads us to consider two feeding and exercise patterns: A: constant feeding, constant exercise; and B: concentrated feeding, concentrated exercise.
We have
(3.2)
where
(3.3)
Note that this implies that if intake exceeds usage, glucose and glycogen levels will increase, independent of feeding or exercise patterns. Conversely, if usage exceeds intake, both glucose and glycogen will decrease, also independent of the patterns.
3.2. Balanced Constant Feeding, Constant Exercise
Assume that . In this case, the system is
 (3.4a)
 (3.4b)
The condition 3.2 is . The ε-axis is an equilibrium manifold, and there is a (non-trivial) equilibrium manifold given by
 (3.5)
(3.5)
Note that the equilibrium manifold will cross the ε axis if .
.
Figure 2 shows the progress of the ε-σ dynamics in the phase plane. Several trajectories are shown. Note that the equilibrium is stable for  and unstable for
 . The interpretation of these results is that if the system starts from an initial point that is out of equilibrium, it will progress toward equilibrium along the line
 .
.
If
 (3.6)
(3.6)
the system evolves to the point , with the stored molecule decreasing while the energy molecule increases. If
 (3.7)
(3.7)
and the initial point lies above the equilibrium manifold, i.e., if

Figure 2. Energy-storage evolution, Balanced intake/output. The curve shows the equilibrium manifold. The arrows show the direction field for the system (3.1a)-(3.1b). The solutions from numerical integration are the solid diagonal lines, with directions consistent with the direction field.
 (3.8)
(3.8)
the system evolves to the point  on the equilibrium manifold given by
 , where
 (3.9)
(3.9)
This result is interesting from the point of view of dieting. If the diet consists of adjusting intake and exercise to balance, there is a possibility that the level of the storage molecule will increase to the stable equilibrium value. This suggests that the diet should start with exercise exceeding intake so that the initial amount of the energy molecules is lessened to a value below the equilibrium. In this case, the energy molecule level increases while the storage molecule level decreases.
3.3. Balanced Concentrated Feeding, Concentrated Exercise
Assume that . In this case, the system is identical to equations () except at the feeding and exercise times
  and
and , respectively, where the concentration of the energy molecule jumps by
  units to the right (feeding) or
  units to the left (exercise).
The behavior of the model in this scenario is illustrated in Figure 3. It is quite

Figure 3. Energy-Storage Evolution, Balanced concentrated intake/output. Consistent with the direction field shown in Figure 2, the two solutions that start above the equilibrium manifold proceed up and to the left, and enter orbits around the equilibrium manifold. The two solutions that start below the equilibrium manifold approach orbits on the ε axis.
similar to the behavior of the constant feeding, constant exercise model, except that the solutions show jumps in the energy molecule at feeding and exercise times, with a drift toward either no storage, or to a nearly periodic behavior around the stable equilibrium.
It is clear that the equilibrium manifold (3.10) is where short-term behavior changes from increasing storage to decreasing storage. In terms of enzyme levels, that manifold is expressed as
 (3.10)
4. FP Model
In this section we analyze the enzyme-controlled mass action model in the long term. It seems plausible that reactions that process the nutrients and intermediaries occur in time periods of several minutes to a few hours, while reactions to store fat and incorporate proteins occur over several days. The basic assumption used here to reduce the equations to equations for fat and protein is that all other reactions are in equilibrium and the rates of supply and usage are constant (representing their average values). The equations could be derived by introducing a small parameter in the reaction rates. Here we simply set the appropriate derivatives to zero, forcing the fast reaction equations to equilibrium [11] . The result of this approximation is a model involving differential equations for fat and proteins, similar to the structure of the Alpert-Chow-Hall model, but based on enzyme chemistry.
 (4.1a)
 (4.1b)
 (4.1c)
 (4.1d)
 (4.1e)
 (4.1f)
 (4.1g)
 (4.1h)
We shall refer to Equation (4.1) as the FP (fat-protein) model. The first two Equations (4.1a), (4.1a)) can be solved for the simple sugar and glycogen levels SS and G in terms of the pyruvate level Pyr. The remainder of the system, viz. Equations (4.1c)-(4.1h), forms a differential-algebraic system for F, FA, AA, P, Pyr, and AcA. Note the similarity between Equations (4.1d) and (3.1b).
4.1. Equilibrium Solutions
We examine the situation in which the supplies, S1, S2, S3, and the usage, U, are non-negative constants. In the eight-dimensional phase space, we expect an equilibrium solution, at least for some set of supplies and usage values. Note that
 (4.2)
(4.2)
where the equilibrium is denoted by a subscript 0. From (4.2), we see that in order for  to be non-negative, we must have
 (4.3)
(4.3)
We also see from Equation (4.1d) that the equilibrium fat level F0 is either
 (4.4)
(4.4)
or
 (4.5)
(4.5)
Note that the solution given by (4.5) predicts a negative (and therefore non-physical) value of F0 for , if
, if . Thus, if
 , two equilibrium solutions exist, while if
  and
and , the only non-negative solution is given by (4.4). Figure 4 shows the two possibilities.
We also see from Equation (4.1f) that the equilibrium for the protein level is given by
 (4.6)
(4.6)
In order to analyze the remainder of the equilibrium values, we note that several of Equations (4.1) contain more than one term that represent reactions involving the same species. We propose to “model” these terms by combining them in a single Hill’s rate model. In order to do this, we examine two such generic terms,
 (4.7)
(4.7)
We wish to combine these terms into one,
 (4.8)
(4.8)
One way to determine  and
and  is to minimize the L2 error over some range of χ. We do not pursue this method since there is no natural upper limit for the concentration, and an integral from 0 to ∞ does not converge. Instead, we require the model to be correct for small χ and for very large χ. For small χ, Equation (4.8) is
 (4.9)
(4.9)
so that
 (4.10)
For χ large, we have
 (4.11)
so that
 (4.12)
Applying the modeling assumption to Equation (4.1) gives
 (4.13a)
 (a)
(a) (b)
(b)
Figure 4. Equilibrium manifolds for FA-F dynamics. The shaded subregions indicate where the stability analysis implies that . a.
. a. ; b.
; b. .
.
 (4.13b)
 (4.13c)
 (4.13d)
where

 (4.14)
and

 (4.15)
Equations (4.13a) and (4.13c) determine the equilibrium for the Pyr-AA subsystem. For given values of S1 and S3, each of these equations determines a manifold on which the equilibrium can exist. A point  lying on an intersection of two such manifolds determines an equilibrium. Figure 5 shows

Figure 5. Intersecting manifolds show the steady solutions (points shown by circles) for certain values of the sources S1 and S2. Equation (4.13b) results in a manifold indicated by a dashed curve, and Equation (4.13c) results in a manifold indicated by a solid curve. Note that not all values of S1 and S3 result in a steady solution.
several manifolds and points that correspond to steady solutions.
For an equilibrium in the Pyr-AA system, we must have
 (4.16)
 (4.17)
From substitution of Equation (4.2) into Equation (4.13a), we see that a further condition for an equilibrium solution is
 (4.18)
It is clear that equilibrium solutions fail to exist for certain values of S1, S2, S3, and U. This is a result of the model for enzymatic reactions, specifically, Hill’s equations lead to reaction rates that are bounded above, so that sufficiently high rates of supply cannot be accommodated. We summarize the situation here: If the constraint (4.3) is satisfied, Equation (4.2) gives the equilibrium solution for FA0, and Equations (4.4) and (4.5) give the equilibrium solutions for F0. If constraints (4.16) and (4.17) are satisfied, solutions for AA0 and Pyr0 can be found from Equations (4.13b) and (4.13c). If constraint (4.18) is satisfied, then Equation (4.13a) can be solved for AcA0. With these equilibrium solutions, the solution for P0 can be found from Equation (4.6), and the solutions for SS0 and G0 can be found from Equations (4.1a) and (4.1b).
4.2. Stability of Equilibria
For small disturbances  from the steady state
 , we have
 (4.19a)
 (4.19b)
 (4.19c)
 (4.19e)
 (4.19f)
 (4.19g)
where
 (4.20a)
 (4.20b)
 (4.20c)
 (4.21a)
 (4.21b)
 (4.21c)
 (4.22a)
 (4.22b)
 (4.23a)
 (4.23b)
 (4.23c)
 (4.23d)
 (4.24a)
 (4.25a)
Solving Equation (4.19a) for  gives
gives
 (4.26)
Substituting into Equation (4.19c) gives
 (4.27)
Substituting this into the protein Equation (4.19b) yields
 (4.28)
Thus small perturbations to the protein equilibrium decay exponentially, so that the equilibrium solution for P is stable.
This exponential behavior in the protein subsystem also generates small disturbance behavior with the same exponent in the fat equation. In addition, the fat equation has a linearly independent solution that can be found by noting that the terms ,
,  and
and  are determined by the protein subsystem, and will therefore have decaying exponential behavior if they are nonzero. The independent fat equation behavior can be found by setting these terms to zero.
Solving Equation (4.19d) for :
:
 (4.29)
Then Equation (4.19a) becomes
 (4.30)
Substituting (4.30) into Equation (4.19e) yields

Thus we see that the equilibrium solution
 (4.31)
is unstable if
 (4.32)
Hence the equilibrium (4.31) is unstable for all , and the solution
  is either 1) stable for all FA0, if
  or 2) stable for
  and unstable for
  if
if . This analysis, coupled with the lack of critical points elsewhere in the FA-F plane implies that solutions to the differential system with initial conditions starting between the maximal equilibrium solution
  and
and  approach the solution
 , while solutions starting above the maximal equilibrium solution must have
 .
.
In terms of the enzyme levels, we see that if the initial values of FA and F are such that if
 (4.33)
the system predicts that .
.
5. Enzyme Dynamics
We note from Equations (3.10) and (4.33) that enzyme levels are involved in the determination of the manifolds that separate regions where levels of a stored molecule approach zero from regions where the levels increase without bound. Consequently, enzyme levels, and what determines them, are of specific interest to the modeling of nutrition dynamics. More generally, enzymes are ubiquitous and assist most of the known digestive reactions. They add a point of control and are able to speed up reactions by enormous factors or initiate reactions that could not occur without them. The level of enzymes in reaction system regulates the velocity of the reaction.
In this subsection, we examine a model for the level of an enzyme involved in a Michaelis-Menten reaction [12] (see also Lin & Segel [11] ). We assume that enzyme molecules are synthesized by ribosomes from mRNA templates, are activated by a process that we do not specify here, and degraded by proteolysis. We further assume that only an enzyme which is not bound to substrate is targeted by proteolysis.
In the Michaelis-Menten model, a substrate molecule A is catabolized by an enzyme E. We shall assume that the possible enzymatic reactions are as shown in Figure 6. An inactivated enzyme E is activated to E+. It is then available to bind reversibly with the substrate molecule to form the complex, EC. The complex can then release the substrate without finishing the reaction, or it can go irreversibly to completion, making a product molecule B and releasing the inactive enzyme. We shall assume that these reactions change the amount of each of the several substances according to the following mass action reaction equations.
 (5.1a)
 (5.1b)
 (5.1c)
 (5.1d)
 (5.1e)
Here SA is the rate of supply of the energy molecule (substrate), and the rate of removal of the storage molecule (product) is SB. Also, SE is the rate at which the enzyme is manufactured by the body. In addition, we assume that inactive and activated enzyme molecules are degraded at rates  and
and , respectively. We note that the rate of production of the enzyme should depend on the availability of appropriate amino acids for protein manufacture, and may be controlled by the presence or absence of other molecules.
In order to obtain the long-term behavior of this system, let us average the system over a long time interval . For any of the time derivative terms of the enzyme in its various forms, we have

Figure 6. Equilibrium manifolds for FA-dynamics. The shaded subregions indicate where the stability analysis implies that .
.
 (5.2)
(5.2)
as . Then we have
 (5.3a)
 (5.3b)
 (5.3c)
 (5.3d)
 (5.3e)
where the overline denotes the time average. Then
 (5.4)
(5.4)
and
 (5.5)
(5.5)
 (5.6)
(5.6)
 (5.7)
(5.7)
 (5.8)
(5.8)
The total amount of the enzyme in its various forms is
 (5.9)
(5.9)
According to this model, the steady-state level of enzyme depends on how much it is used, that is, how rapidly substrate is supplied.
6. Analysis
We have posited and analyzed a model for a set of metabolic reactions involving carbohydrates, fats, and proteins. The model assumes that molecules in each class are stored or metabolized into molecules pyruvate and acetyl-CoA, the pathway upstream of the Krebs cycle, where the body’s energy is produced. In order to gain an understanding of the behavior of this model, it is analyzed at two different time scales, a short term scale, where the molecule is stored or used, and a long term model that accounts for the storage of fats and proteins. The CFP model that we propose and analyze here is based on the assumption that each simple sugar, fatty acid or amino acid molecule is reacted in order to be used for energy or to be stored as glycogen, fat, or protein. Each reaction is assumed to be effectively catalyzed by one enzyme. This is a simplification, since the known reactions involve a half-dozen steps, each catalyzed by a different enzyme. There is no explicit justification of this assumption, it simplifies any analysis, while retaining a reasonable reaction structure.
In Section 3, we study the behavior of a simple submodel for energy molecules and their storage. This model shows that there is a one-dimensional manifold relating the energy molecule level and the storage level that divides the behavior into two quite different types. If the level of storage molecule is above the manifold, it will evolve to even higher levels, even if intake and usage are balanced. Below this manifold, the storage molecule level will decrease. The manifold depends on enzyme levels and the rates at which energy molecules are stored, and at which stored molecules are released. The switch from increasing to decreasing at the manifold persists when a model for feeding and exercise is considered.
The FP model analyzed in Section 4 represents the behavior of the model on long time scales, the time scales where the state of the individual is changing by gaining or losing muscle or fat mass. The model assumes that all reactions except the release-from-storage reactions are fast. This effectively assumes that the carbohydrate model is in quasi-equilibrium. For simplicity, we have assumed that the usage U does not depend on any of the nutrient levels. Energy usage is a complex issue, and as suggested by Pontzer, et al. [13] , may “plateau” as a function of activity.
When this model is analyzed by finding equilibria and examining their stability, it separates into carbohydrate, protein, and fat submodels. The protein submodel predicts that the protein equilibrium is stable, while the fat submodel shows equilibrium solutions for fatty acid and fat abundance are such that if the fat level exceeds the equilibrium, the fat level increases without bound, while solutions starting in a region with fat abundance below the equilibrium proceed to a fat level of zero. This dichotomous behavior is similar to that derived from the simplified model of Section 3, and stems from the model for the enzymatic reactions for converting fatty acids to fat, and vice versa.
The FP model also predicts that the equilibrium fatty acid level determines whether the system is in a mode where the abundance of fat increases or decreases. The equilibrium fatty acid level is determined by a balance between fatty acid excretion and the excess between total nutrient molecule intake and energy usage (see Equation (4.2)). The equilibrium fatty acid and fat levels then determine whether the fat/fatty acid model dynamics result in growth or decrease of the fat level. Qualitatively, a sufficiently small fatty acid level puts the fat subsystem into the state where the fat level decreases. This seems to agree with the often-quoted weight loss advice, “eat less, move more,” since either of those activities would reduce the excess between total nutrient intake and usage, thereby reducing the fatty acid level. It is also interesting that the fatty acid level is a common diagnostic datum. Note that if excretions of proteins or carbohydrates were included, these long-term results would be more complex.
The results from the FP model depend on the reaction rates,  , the dissociation constants
 , and the enzyme levels
 . We expect that the reaction rates
  do not change much from place to place in the individual, nor from individual to individual. However, enzymes are in essence proteins, and the levels will not only be different in different organs and different individuals, but, as the analysis in Section 5 indicates, they could dynamically adapt to reflect how much they are used. One possible consequence of this is that the enzyme levels that have a role in determining the steady state may actually evolve. One scenario that can be imagined in the context of this approach is that instead of the fat level growing without bound, the fat level and the associated enzyme levels may evolve together to a new equilibrium.
The short term and long term qualitative behaviors depend on the levels of certain enzymes. This prompted the development of a model for enzyme production in the style of Michaelis and Menten, which assumes that enzymes which are in use are not degraded, while unused enzymes can be attacked by the protein degradation mechanisms. This model shows that enzyme levels depend on the rate of production and utilization of the substrate, with more processing leading to higher enzyme levels.
The CFP model has features that are reminiscent of the CFP model of Hall [3] [4] [5] . In particular, it has equations for the rates of change of glycogen, fats and proteins. In contrast to that model, the chemistry of the input molecules is considered in the present model. This level of detail bypasses the de novo liposynthesis (DNL) model, replacing it with a dynamical model for conversion of simple sugars to pyruvate, pyruvate to acetyl-CoA, and acetyl-CoA to fatty acids. The Chow-Hall CFP model has enjoyed significant success in understanding and interpreting the large quantity of weight and weight change data, something that the present model does not purport to do. Thus, we do not offer the present model as an alternative to the Chow-Hall CFP model, but consider its insights as sufficiently interesting to merit consideration.
A shortcoming of the CFP model presented here is that it does not consider the important part that insulin plays in the transport of simple sugars across cell boundaries, where the sugars can be used or processed for storage. Pearson, et al. [6] [7] model this process, assuming that glucose that is released from the breakdown of glycogen is not used in fatty acid synthesis. They argue that the conversion of glycogen to glucose occurs when the system is in the fasted state which has small amounts of insulin.
7. Conclusions
The model of evolution of enzyme levels also suggests two side issues from this modeling approach. First, it seems quite reasonable that the mechanism that triggers hunger is able to sense the level of active enzymes that are not in complex with the metabolite (i.e., E and E+ from Section 5). This would result in the metabolite being processed more quickly, and the individual’s appetite returning sooner, and perhaps with stronger signaling, since there would be more non-complexed enzymes.
The second issue is that alcohol is metabolized by a sequence of enzymatic reactions. The speed of clearing alcohol from the blood depends on the enzyme level. If, indeed, the enzyme level depends on the long-time level of alcohol intake, then it seems possible that a higher long-term intake level would imply faster processing, requiring a higher consumption rate to achieve inebriation.
The model proposed and analyzed herein has several shortcomings. Perhaps the biggest is that almost all of the metabolic reactions discussed by Berg, et al. [8] are multi-step, multi-enzyme. Much of the analysis that is done here depends on the simplicity of Hill’s model for enzyme reactions. It should also be noted that the analysis in Section 5 suggests that enzymes evolve on a similar time scale as the long-term metabolic dynamics.
Other shortcomings of this model are as follows: 1) Values of parameters and reaction rates are not known. 2) We do not consider enzyme dynamics simultaneously with the evolution of metabolites. 3) The body has 23 amino acids, which must be incorporated into each protein in the correct order. (4) Amino acids metabolism has two separate paths for different types of amino acid, termed glucogenic and ketogenic, indicating where they enter the pathway for production of energy, as being converted to pyruvate or acetyl-CoA, respectively. A seemingly related concept is the classification of amino acids as essential or non-essential, indicating whether the body can manufacture them or not. In this model, we lump all amino acids into one species and show them as able to enter either pathway. We also show a reaction to convert pyruvate to amino acid, but no reaction to form amino acids from acetyl-CoA. See Berg, et al. [8] .
In spite of the shortcomings, the model has some interesting features, some of which may suggest experiments to confirm or refute. Enzyme levels may be controllable by varying the copy number for crucial enzymes and may also be implemented in animal obesity models [14] . Also, the presence of an unstable manifold dividing growing storage from declining storage occurs in the short term models of Section 3 and in the long-term model for fatty acid/fat metabolism results from the form of the storage/release rate models of Equations (3.1) and (4.1d), which is dependent on enzyme levels. Simultaneous observations of serum lipids (fatty acids), fat levels, and enzymes may correlate with weight gain or loss.
A mathematical model uses mathematical concepts and language to explain a phenomenon, to study the effects of different parameters, and to make predictions about its behavior. The carbohydrate-fat-protein model presented herein formulates the chemistry of metabolism as a set of differential equations and predicts a threshold for weight gain that depends on enzyme levels. To the extent that this model explains metabolism, it may offer insight into the causes of obesity.
Cite this paper
Drew, D.A. (2018) A Mathematical Model for Nutrient Metabolic Chemistry. Applied Mathematics, 9, 647-671. https://doi.org/10.4236/am.2018.96045
References
- 1. Alpert, S.S. (1979) A Two-Reservoir Energy Model of the Human Body. The American Journal of Clinical Nutrition, 32, 1710-1718. https://doi.org/10.1093/ajcn/32.8.1710
- 2. Alpert, S.S. (1990) Growth, Thermogenesis, and Hyperphagia. The American Journal of Clinical Nutrition, 52, 784-792. https://doi.org/10.1093/ajcn/52.5.784
- 3. Hall, K.D. (2006) Computational Model of in Vivo Human Energy Metabolism during Semi-Starvation and Re-Feeding. American Journal of Physiology-Endocrinology and Metabolism, 291, E23-E37.
- 4. Chow, C.C. and Hall, K.D. (2008) The Dynamics of Human Body Weight Change. PLoS Computational Biology, 4, e1000045. https://doi.org/10.1371/journal.pcbi.1000045
- 5. Hall, K.D. (2012) Modeling Metabolic Adaptations and Energy Regulation in Humans. Annual Review of Nutrition, 32, 35-54. https://doi.org/10.1146/annurev-nutr-071811-150705
- 6. Pearson, T., Wattis, J.A.D., King, J.R., MacDonald, I.A. and Mazzatti, D.J. (2014) A Mathematical Model of the Human Metabolic System and Metabolic Flexibility. Bulletin of Mathematical Biology, 76, 2091-2121.
- 7. Pearson, T., Wattis, J.A.D., King, J.R., MacDonald, I.A. and Mazzatti, D.J. (2016) The Effects of Insulin Resistance on Individual Tissues: An Application of a Mathematical Model of Metabolism in Humans. Bulletin of Mathematical Biology, 78, 1189-1217
- 8. Berg, J.L., Tymoczko, J.L. and Stryer, L. (2007) Biochemistry. 5th Edition, W. H. Freeman, New York.
- 9. Drew, D.A. (2001) A Mathematical Model for Prokaryotic Protein Synthesis. Bulletin of Mathematical Biology, 63,329-351. https://doi.org/10.1006/bulm.2000.0225
- 10. Heyd, A. and Drew, D.A. (2003) A Mathematical Model for Elongation of a Peptide Chain. Bulletin of Mathematical Biology, 65, 1095-1109. https://doi.org/10.1016/S0092-8240(03)00076-4
- 11. Lin, C.C. and Segel, L.A. (1988) Mathematics Applied to Deterministic Problems in the Natural Sciences. Classics in Applied Mathematics, SIAM, Philadelphia. https://doi.org/10.1137/1.9781611971347
- 12. Michaelis, L. and Menten, M. (1913) Die kinetik der invertinwirkung. Biochemische Zeitschrift, 49, 333-369.
- 13. Pontzer, H., Durazo-Arvizu, R., Dugas, L., Plange-Rhule, J., Bovet, P., Forrester, T.E., Lambert, E.V., Cooper, R.S., Schoeller, D.A. and Luke, A. (2016) Constrained Total Energy Expenditure and Metabolic Adaptation to Physical Activity in Adult Humans. Current Biology, 26, 410-418. https://doi.org/10.1016/j.cub.2015.12.046
- 14. Lutz, T.A. and Woods, S.C. (2012). Overview of Animal Models of Obesity. Current Protocols in Pharmacology, 58, 5.61.1-5.61.18. https://doi.org/10.1002/0471141755.ph0561s58