Applied Mathematics
Vol.4 No.6(2013), Article ID:32501,6 pages DOI:10.4236/am.2013.46123
A Clique-Based Approach to the Identification of Common Gene Association Sub-Networks
Department of Mathematics and Computer Science, North Carolina Central University, Durham, USA
Email: gzheng@nccu.edu, atesfay1@nccu.edu, xinyu.huang@nccu.edu, atokuta@nccu.edu
Copyright © 2013 Gaolin Zheng et al. This is an open access article distributed under the Creative Commons Attribution License, which permits unrestricted use, distribution, and reproduction in any medium, provided the original work is properly cited.
Received January 12, 2013; revised April 23, 2013; accepted May 2, 2013
Keywords: Graphical Lasso Model; Quadratic Maximization; Subgraph Isomorphism; Clique; Replicator Equation; Gene Association Network
ABSTRACT
We developed a computational framework to identify common gene association sub-network. This framework combines graphical lasso model, graph product and a replicator equation based clique solver. We applied this method to find common stress responsive sub-networks from two related Deinococcus-Thermus bacterial species.
1. Introduction
Gene and gene products interact with each other due to biochemical interactions and regulatory activities [1]. Many methods have been developed to analyze these networks. Popular methods include weighted correlation network analysis (WGCNA) [2], Bayesian networks [3], autoregressive models [4], state-space models [5] and graphical Gaussian models [6]. Few studies however, have been devoted to analyze networks from multiple species simultaneously. In this study, we focus on the identification of common gene association sub-networks from multiple species. First we need to derive gene network from individual species. We chose Graphical Lasso model [6] for this task because it can handle large covariance/correlation matrices of mathematically deficient rank which is often the case for genomic data.
Identification of common gene association sub-networks is related to the subgraph isomorphism problem. The subgraph isomorphism problem can be reduced to finding maximal clique from merged graph [7] which can be constructed following graph product rules. There are a number of heuristics for finding maximal cliques. Local search may be the simplest greedy strategy that starts with some initial solution and moves from neighbor to neighbor as long as possible while increasing the clique number. The main problem with this strategy is its inability to escape local maxima where the search cannot find any further neighborhood solution. Battiti and Protasi [8] proposed reactive local search that allows the search to explore solutions that do not decrease the clique number by dynamically changing some of the parameters [8]. Another widely used heuristic is replicator equation [7]. This method is based on a continuous formulation of the maximal clique problem as quadratic programming [9].
The paper is organized as follows. In Section 2, we will describe graphical Lasso method to construct gene association networks. We will also describe graph merging and how to find maximal cliques using replicator equations. The experiments and results will be discussed in Sections 3 & 4. We offer a conclusion in Section 5.
2. Methods
To find common gene association sub-networks from two species, we need to perform ortholog mapping from two species. Orthologs are genes in different species that originated by vertical descent from a single gene of the last common ancestor. We will then construct gene association network of the orthologous genes for the two species respectively. This is followed by graph merging and maximal clique searching of the merged graph. Finally the common sub-networks are recovered for each species. Figure 1 shows the overview of the approach.
2.1. Construction of Gene Association Network
The inverse covariance matrix  is used to construct individual gene association network. Gene i and j are considered conditionally independent given other genes
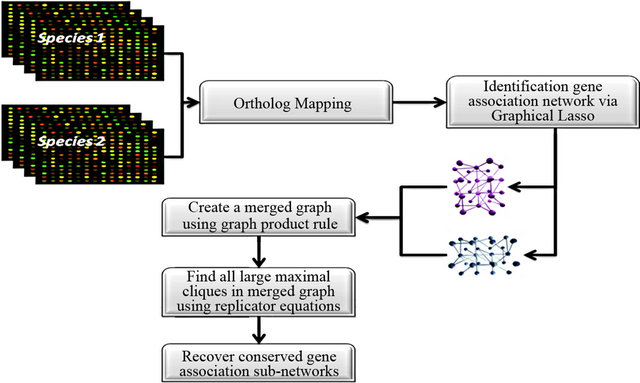
Figure 1. Clique-based approach to identification of common gene association sub-network from two species.
if  [6]. Meinshausen and Muhlmann [10] estimated a sparse graph by fitting a lasso model to each variable using others as predictors. Friedman et al. made this method faster by solving a 1000-node problem (≈500,000 parameters) in less than 1 minute [6]. Consider a multidimensional normal distribution of dimension p, with mean μ and covariance matrix S. Let S be the empirical covariance matrix, the estimation of S−1 is the solution to the following optimization problem:
![]() (1)
(1)
where tr denotes trace and ![]() the L1 norm, and
the L1 norm, and
 is the user-defined penalty. Banerjee et al. [11] show the problem is convex and considered estimating
 ![]() rather than its inverse. Let W be the estimate of
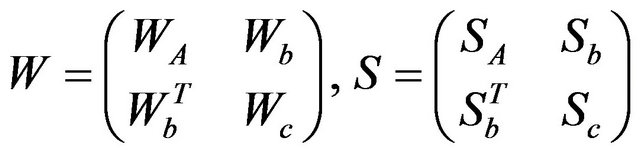
rather than its inverse. Let W be the estimate of![]() , the problem is solved by optimizing over each row and corresponding column of W in a block coordinate descent fashion. Partition W and S as:
, the problem is solved by optimizing over each row and corresponding column of W in a block coordinate descent fashion. Partition W and S as:
 (2)
(2)
where  is a
is a  matrix, and
  is a vector of length
 , and
, and  is a scalar. The dimensions are the same for the corresponding partitions in S. The solution satisfies
 (3)
(3)
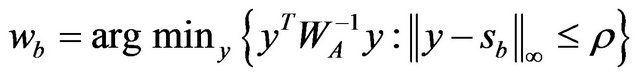
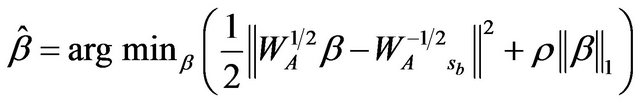
This is a box-constrained quadratic program and can be solved using an interior-point procedure [12]. By permuting the rows and columns so the target column is always the last, they solve a similar problem like (3) for each column, updating their estimate of  after each stage [11]. This is repeated until convergence. If this procedure is initialized with a positive definite matrix, they showed that the iterates from this procedure remains positive definite and invertible even if
  which is normally the case for gene expression data. That is also one of the reasons that we choose this method to construct gene association network. Using convex duality, Banerjee et al. showed that solving (3) is equivalent to solving the following minimization problem which resembles a
  regularized least squares problem.
 (4)
(4)
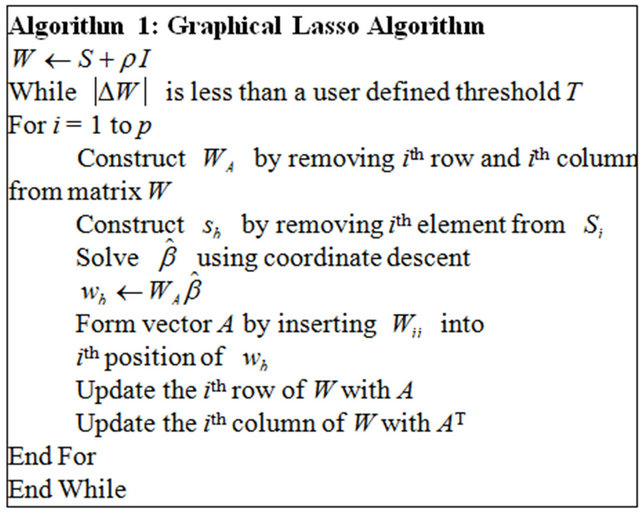
The solution for problem (3) is . Algorithm 1 describes the procedure to compute
 , the estimate of
![]() . In algorithm 1,
. In algorithm 1,  is solved using coordinate descent described by Friedman et al. [13] and Wu and Lange [14]. The threshold T is typically defined as
 , where
  are the off-diagonal elements of the empirical covariance matrix
![]() , and
, and  is typically set to a small number such as 0.001. The computing efficiency can be further improved via active set convergence [13].
2.2. Identification of Conserved Gene Association Sub-Networks
Detecting common sub-network is a challenging task. However, we are approaching this problem from a graph product point of view. We will merge the two graphs by mapping corresponding orthologous genes and create the edges for merged graph 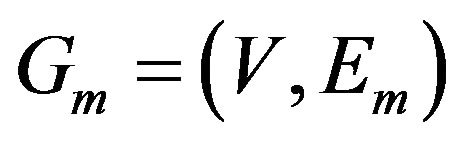 based on the following graph product rule.
 (5)
(5)
In other words, an edge in  indicates both
  and
and  contain the edge or neither of them contain the edge. Finding common sub-networks in
  and
and  can be reduced to finding maximal cliques in
 . A subset of vertices C is called a clique if all its vertices are mutually adjacent. A clique is said to be maximal if it is not contained in any larger clique. Pelillo has established equivalence between the graph isomorphism problem and the maximal clique problem [7]. The Motzkin-Straus theorem [9] has established a connection between the maximal cliques and the local maximizers of the following quadratic function:
 (6)
(6)
where  is the standard simplex of
 , and A is the adjacency matrix for
with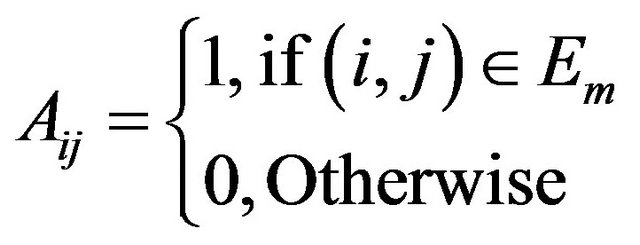 . Specifically, it states that a subset of vertices
  of a graph is a maximum clique if and only if its characteristic vector
  is a global maximizer of
  on
on![]() . A similar relationship holds between local maximizers and maximal cliques [15]. The Motzkin-Straus theorem has served as the basis of many clique-finding procedures [16-18]. Pardalos and Phillips [17] observed that there existed spurious solutions to the original Motzkin-Straus formula, and Pelillo and Jagota [15] confirmed this finding later in 1996. Bomze provided a straight-forward solution to this problem [19]. Consider the following regularized version of function
. A similar relationship holds between local maximizers and maximal cliques [15]. The Motzkin-Straus theorem has served as the basis of many clique-finding procedures [16-18]. Pardalos and Phillips [17] observed that there existed spurious solutions to the original Motzkin-Straus formula, and Pelillo and Jagota [15] confirmed this finding later in 1996. Bomze provided a straight-forward solution to this problem [19]. Consider the following regularized version of function
 :
: , which is obtained from (6) by substituting the adjacency matrix
  with
with
 , where
  is the
  identity matrix.
We can avoid spurious solutions by substituting  with
with .
.
The optimization problem  may have many local maxima. Each large local maximum correspond to a true common gene association sub-network, while small local maxima usually result from noises and outliers. Given an initialization
 , the corresponding local solution
  can be efficiently obtained by replicator equation, which arises in evolutionary game theory. The discrete time version of first-order replication equation has the following form:
 (7)
(7)
The simplex ![]() is invariant under these dynamics, which means that every trajectory starting in
is invariant under these dynamics, which means that every trajectory starting in ![]() will remain in
will remain in![]() . It has been proven that when
. It has been proven that when  is symmetric and non-negative, the objective function
  is strictly increasing along any non-constant trajectory and its asymptotically stable points are in one-to-one correspondence to strict local solution of (6).
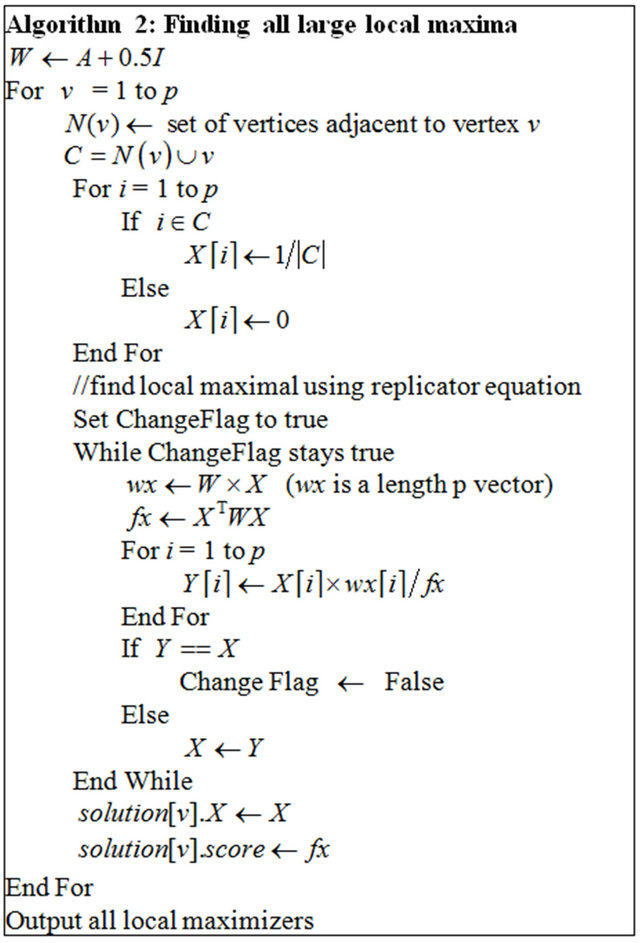
To find all large local maximizers , we will start with different initializations that will lead to different local maxima. The procedure for finding all large local maxima is described in Algorithm 2.
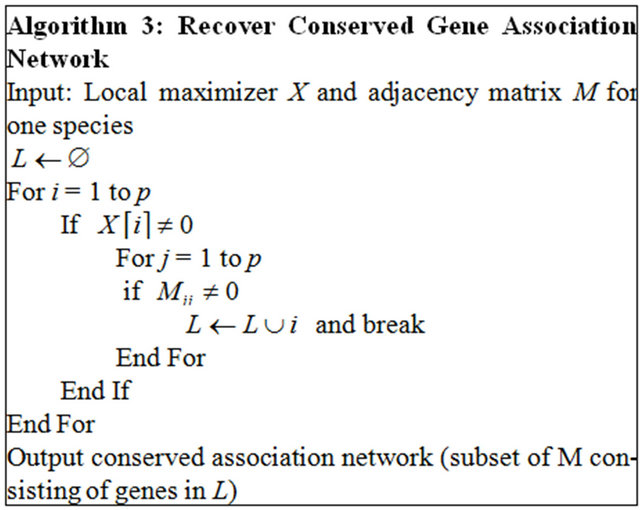
For a local maximizer , we need to recover the corresponding common gene association sub-network between the two species. The non-zero elements in local maximizer
  correspond to the genes that share the same association network between the two species. It is possible to have some genes in the shared network that are independent. We need to remove these isolated genes from the conserved association network. Algorithm 3 describes how to recover the common association network.
3. Experimental Data
3.1. Graph Benchmark Data
We used the DIMACS benchmark data set [20] to validate the effectiveness of the replicator equations to find maximal cliques.
3.2. Gene Expression Data
We applied the method to find common stress responsive gene association networks for two related bacteria Deinococcus radiodurans and Thermus thermophilus. We downloaded the gene expression data sets GSE 29516 for D. radiodurans from gene expression omnibus [21]. GSE29516 consists of microarray data from transcription profiling of D. radiodurans treated with 0.3 M NaCl or 2 M salt. We downloaded the gene expression series GSE21289 for T. thermophilus. GSE21289 contains the gene expression data of T. thermophilus HB8 wild-type strain in response to high salt stress.
3.3. Ortholog Mapping
Ortholog mapping is done via multi-genome homology comparison tools available from the Comprehensive Microbial Resource web site [22]. In the case of multiple genes in a cluster, we used the one with the highest score, resulting in 744 one-to-one ortholog pairs. Gene expression data and ortholog mapping table is stored in an inhouse relational database for easy retrieval and crossreferencing across the two species Gene expression data for orthologous genes are retrieved through database queries.
4. Results and Discussions
4.1. Benchmark Results on DIMACS Challenge Sets
We recorded running time and clique found using our replicator equations. Table 1 shows the results on some DIMACS challenge instances.
In general, our implementation is able to find maximal cliques in reasonable time. And we were able to find cliques that are close to their corresponding maximum clique numbers for each benchmark data set.
4.2. Identification Common Gene Association Sub-Networks
Two common gene association sub-networked were identified using the described procedure (Figure 2).
Annotations of the genes in Figure 2 are given in Table 2.
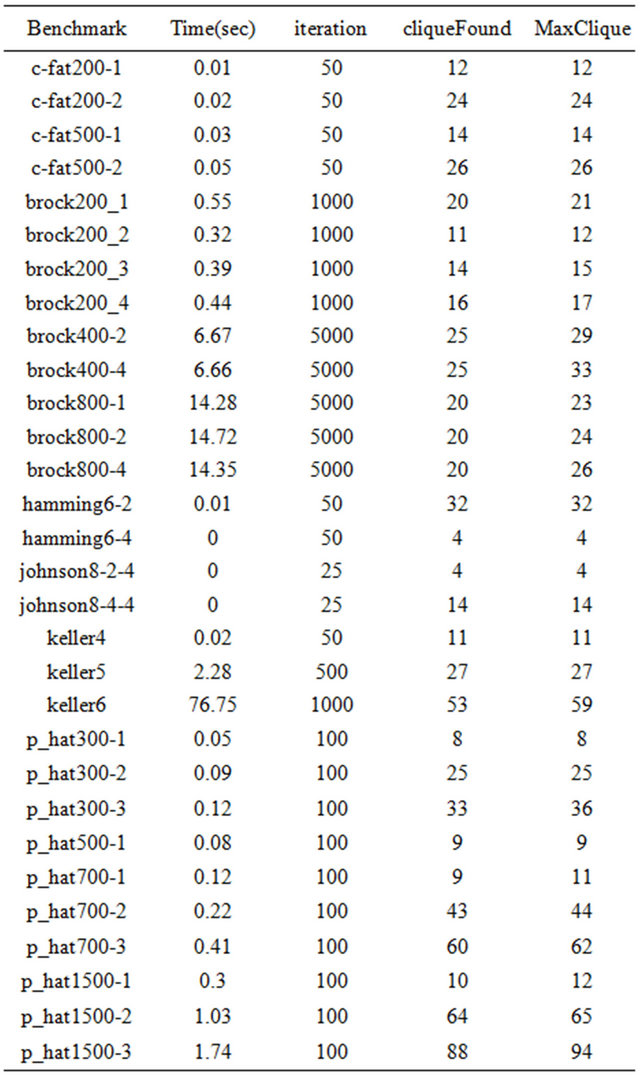
Table 1. The performance of clique finding algorithm on some DIMACS challenge instances.
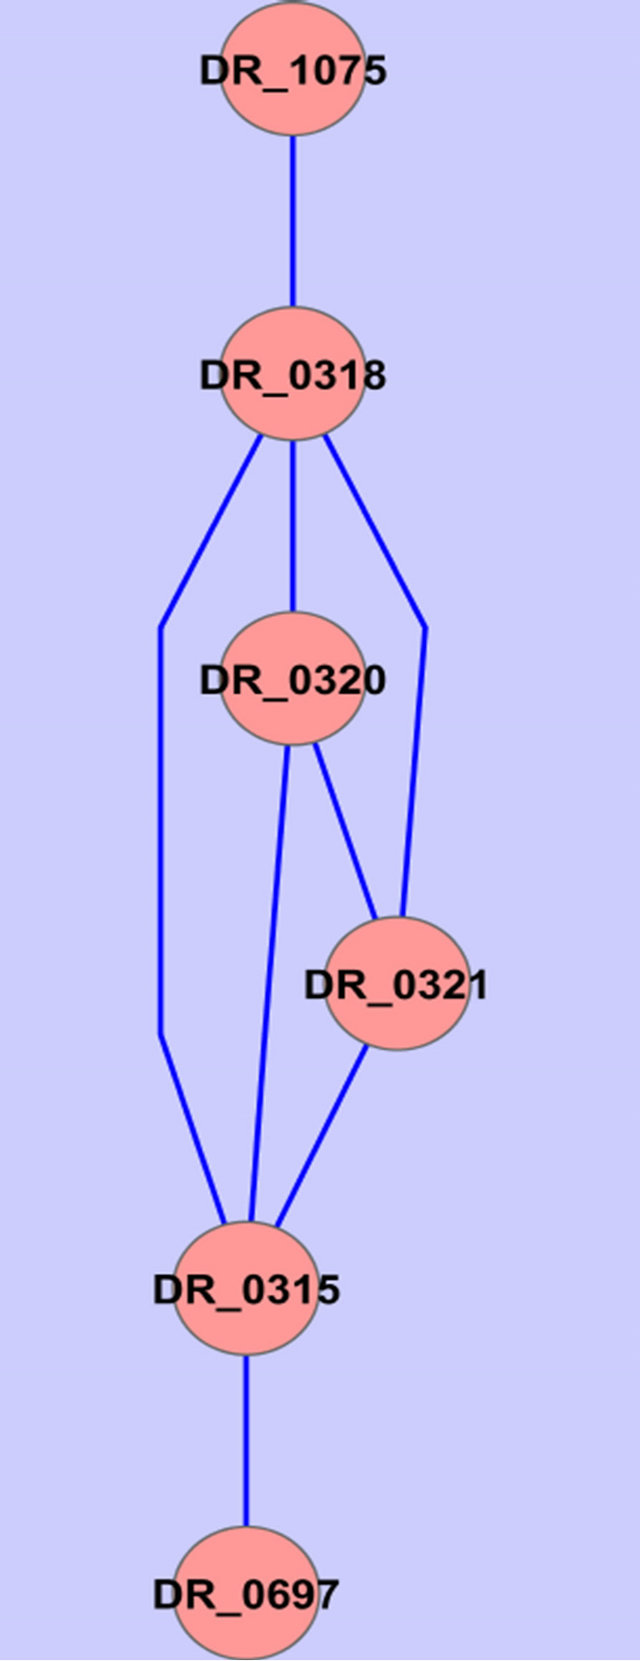
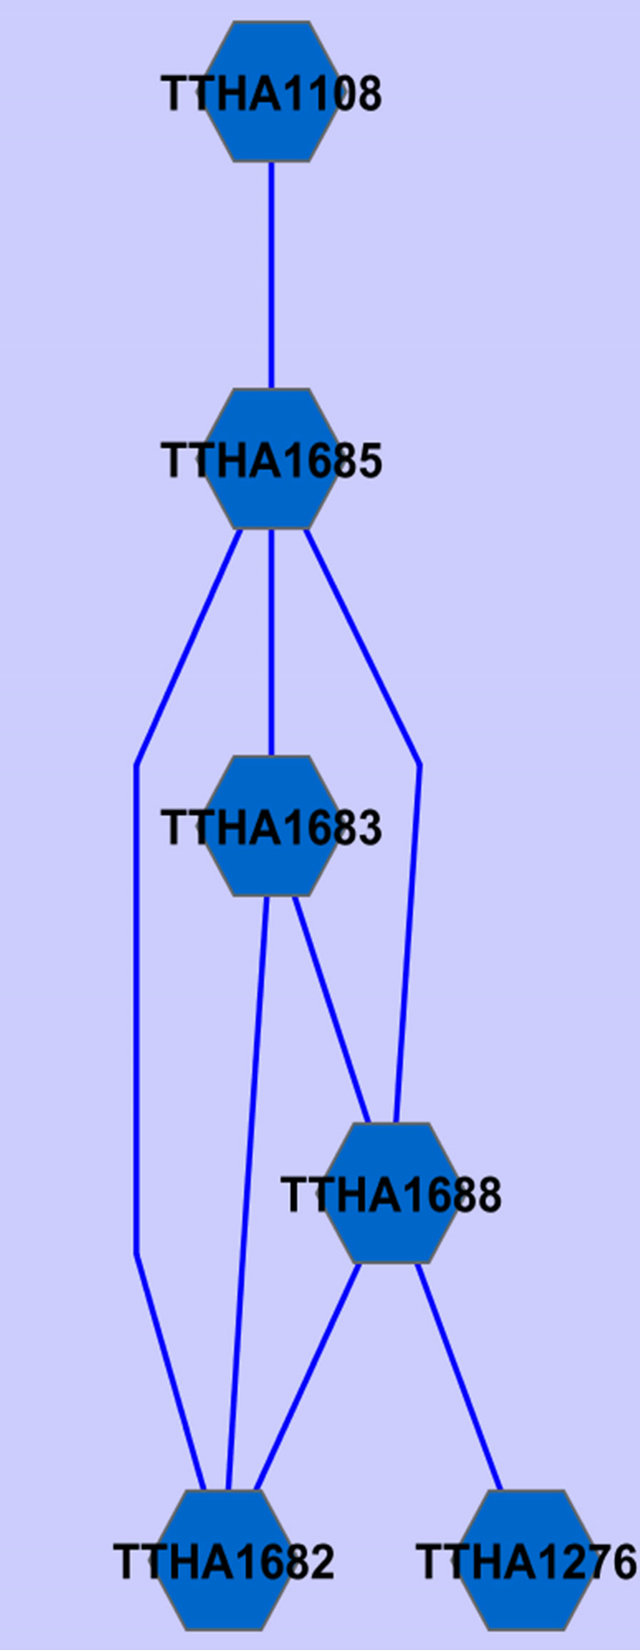
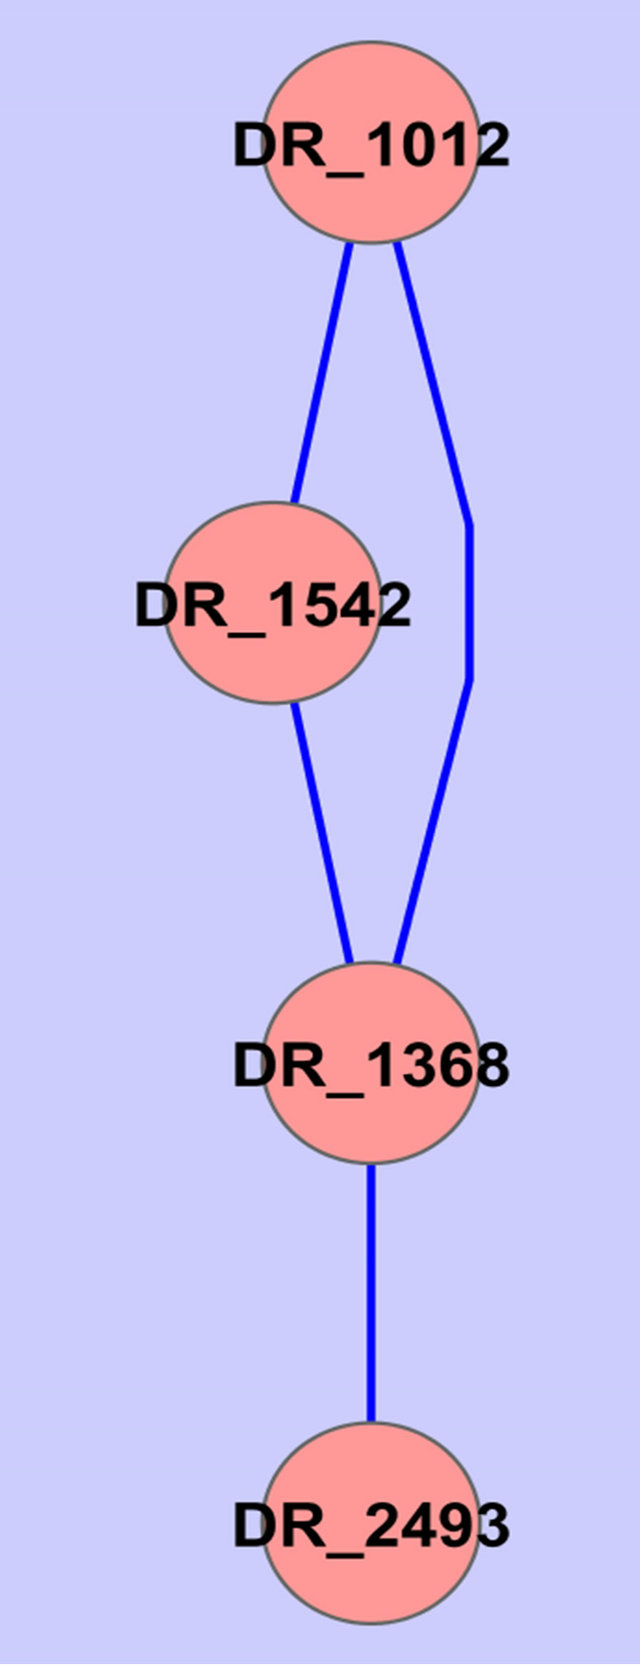
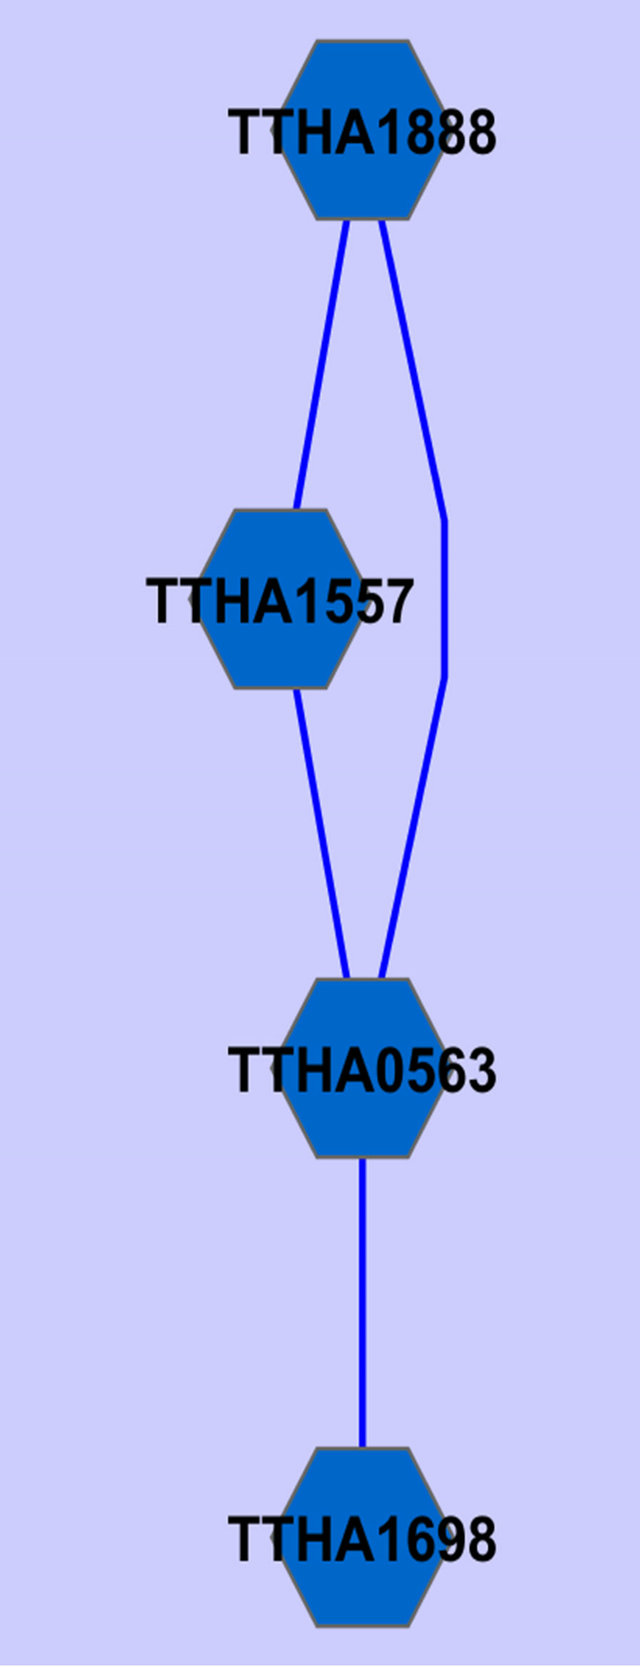
Figure 2. Common gene association sub-networks identified for D. radiodurans and T. thermophilus.
Among these genes, ABC transporter ATP-binding protein has been previously reported to be osmo-regulated [23]. Two of the genes are not fully annotated (hypothetical protein in Table 2), we think they are worthy
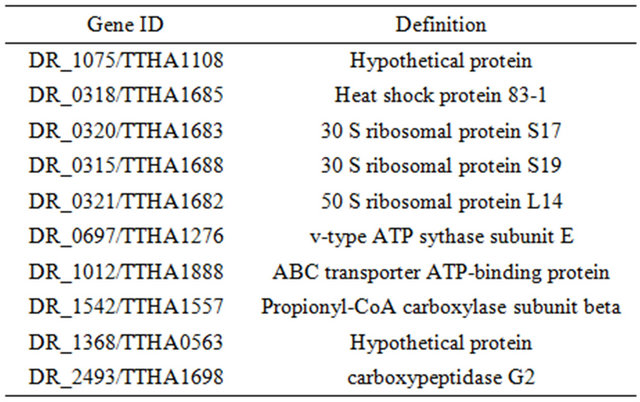
Table 2. Annotation of genes in the identified common subnet-networks.
of further investigation because they seem to be related to osmosis stress response based on our study on two different species. A ribosomal protein has been found by Schmalisch et al. to be general stress protein in Bacillus subtilis [24]. We found three ribosomal proteins that are related to the stress response in both D. radiodurans and T. thermophilus. This is consistent with the finding from Schmalisch et al. [24].
5. Conclusions
In this study, we developed an efficient computational framework that combines graphical lasso model, graph product and replicator equation based clique solver to identify common gene association sub-network from multiple species. Our method provides an approach to identifying conserved pathway components.
We applied our method and identified common gene association sub-networks for two related bacterial species D. radiodurans and T. thermophilus subjected to similar environmental stress. We confirmed some stress responsive genes with previous studies. Our method also demonstrated how these genes interact with other genes and these interactions potentially are conserved because they are discovered via simultaneous study of two related species.
Our method is not limited to finding common gene association sub-network across multiple species. It can also be adapted to identify core interaction network for the same species subjected to different environmental stresses. It can also be employed to identify common gene/protein sub-networks for related diseases such as diabetes and hypertension.
6. Acknowledgements
This work was supported by a grant from North Carolina Space Consortium (2010-1435-CE-02). Financial support from the National Science Foundation (NSF) through a grant to the Quality Education for Minorities Networks (QEM/HBCU-UP Faculty Professional Development and Mentoring Program) are highly acknowledged. The work was also supported in part by NSF CREST HRD- 0833184 and by the US Army Research Office (ARO) W911NF-0810510.
REFERENCES
- J. Schäfer and K. Strimmer, “An Empirical Bayes Approach to Inferring Large-Scale Gene Association Networks,” Bioinformatics, Vol. 21, No. 6, 2005, pp. 754- 764.
- P. Langfelder and S. Horvath, “WGCNA: An R Package for Weighted Correlation Network Analysis,” BMC Bioinformatics, Vol. 9, No. 1, 2008, p. 559. doi:10.1186/1471-2105-9-559
- N. Friedman, “Inferring Cellular Networks Using Probabilistic Graphical Models,” Science, Vol. 303, No. 5659, 2004, pp. 799-805. doi:10.1126/science.1094068
- M. K. S. Yeung, J. Tegnér and J. J. Collins, “Reverse Engineering Gene Networks Using Singular Value Decomposition and Robust Regression,” Proceedings of the National Academy of Sciences, Vol. 99, No. 9, 2002, pp. 6163-6168.
- C. Rangel, J. Angus, Z. Ghahramani, M. Lioumi, E. Sotheran, A. Gaiba, D. L. Wild and F. Falciani, “Modeling T-Cell Activation Using Gene Expression Profiling and State-Space Models,” Bioinformatics, Vol. 20, No. 9, 2004, pp. 1361-1372.
- J. Friedman, T. Hastie and R. Tibshirani, “Sparse Inverse Covariance Estimation with the Graphical Lasso,” Biostatistics, Vol. 9, No. 3, 2008, pp. 432-441.
- M. Pelillo, “Replicator Equations, Maximal Cliques, and Graph Isomorphism,” Neural Computation, Vol. 11, No. 8, 1999, pp. 1933-1955.
- R. Battiti and M. Protasi, “Reactive Local Search for the Maximum Clique Problem,” Algorithmica, Vol. 29, No. 4, 2001, pp. 610-637. doi:10.1007/s004530010074
- T. S. Motzkin and E. G. Straus, “Maxima for Graphs and a New Proof of a Theorem of Turán,” Canadian Journal of Mathematics, Vol. 17, 1965, pp. 533-540. doi:10.4153/CJM-1965-053-6
- N. Meinshausen and P. Bühlmann, “High-Dimensional Graphs and Variable Selection with the Lasso,” The Annals of Statistics, Vol. 34, No. 3, 2006, pp. 1436-1462. doi:10.1214/009053606000000281
- O. Banerjee, L. E. Ghaoui and A. d’Aspremont, “Model Selection through Sparse Maximum Likelihood Estimation for Multivariate Gaussian or Binary Data,” Journal of Machine Learning Research, Vol. 9, 2008, pp. 485- 516.
- A. Forsgren, P. E. Gill and M. H. Wright, “Interior Methods for Nonlinear Optimization,” SIAM Review, Vol. 44, No. 4, 2002, pp. 525-597. doi:10.1137/S0036144502414942
- J. Friedman, T. Hastie, H. Hofling and R. Tibshirani, “Pathwise Coordinate Optimization,” Annals of Applied Statistics, Vol. 1, No. 2, 2007, p. 302. doi:10.1214/07-AOAS131
- T. Wu and K. Lange, “Coordinate Descent Procedures for Lasso Regularized Regression,” Annals of Applied Statistics, Vol. 2, No. 1, 2008, pp. 224-244. doi:10.1214/07-AOAS147
- M. Pelillo and A. Jagota, “Feasible and Infeasible Maxima in a Quadratic Program for Maximum Clique,” Journal of Artificial Neural Network, Vol. 2, No. 4, 1996, pp. 411-420.
- L. E. Gibbons, D. W. Hearn and P. M. Pardalos, “A Continuous Based Heuristic for the Maximum Clique Problem,” In: D. S. Johnson and M. A. Trick, Eds., Cliques, Coloring, and Satisfiability—Second DIMACS Implementation Challenge, American Mathematical Society, 1996, pp. 103-124.
- P. M. Pardalos and A. T. Phillips, “A Global Optimization Approach for Solving the Maximum Clique Problem,” International Journal of Computer Mathematics, Vol. 33, No. 3-4, 1990, pp. 209-216.
- M. Pelillo, “Relaxation Labeling Networks for the Maximum Clique Problem,” Journal of Artificial Neural Network, Vol. 2, No. 4, 1996, pp. 313-328.
- I. M. Bomze, “Evolution towards the Maximum Clique,” Journal of Global Optimization, Vol. 10, No. 2, 1997, pp. 143-164. doi:10.1023/A:1008230200610
- D. S. Johnson and M. A. Trick, Eds., “Cliques, Coloring, and Satisfiability: Second DIMACS Implementation Challenge,” AMS, Providence, 1996.
- T. Barrett and R. Edgar, “Gene Expression Omnibus: Microarray Data Storage, Submission, Retrieval, and Analysis,” Methods in Enzymology, Vol. 411, 2006, pp. 352- 369. doi:10.1016/S0076-6879(06)11019-8
- J. D. Peterson, L. A. Umayam, T. Dickinson, E. K. Hickey and O. White, “The Comprehensive Microbial Resource,” Nucleic Acids Research, Vol. 29, No. 1, 2001, pp. 123-125.
- T. van der Heide and B. Poolman, “Osmoregulated ABC- Transport System of Lactococcus lactis Senses Water Stress via Changes in the Physical State of the Membrane,” Proceedings of the National Academy of Sciences, Vol. 97, No. 13, 2000, pp. 7102-7106.
- M. Schmalisch, I. Langbein and J. Stulke, “The General Stress Protein Ctc of Bacillus subtilis Is a Ribosomal Protein,” Journal of Molecular Microbiology and Biotechnology, Vol. 4, 2002, pp. 495-501.