Applied Mathematics
Vol.3 No.10A(2012), Article ID:24093,5 pages DOI:10.4236/am.2012.330182
Mauro: A Novel Strategy for Optimizing Mixture Properties
1Laboratory for Chemometrics and Cheminformatics, Chemistry Department, University of Perugia, Perugia, Italy
2Flint Group, Cinisello Balsamo, Milano, Italy
3Molecular Discovery Ltd., London, England
4M.I.A. Multivariate Infometric Analysis Srl, Perugia, Italy
Email: *sergio@chemiome.chm.unipg.it
Received June 1, 2012; revised July 1, 2012; accepted July 8,2012
Keywords: Mixture Analysis; Optimization; Design Strategies; CARSO Procedure
ABSTRACT
The paper illustrates an innovative procedure for experimental design in mixture analysis. It relies on D-optimal designs performed on the combinatorial explosion of five levels of components composition, keeping in mind the requirements of Central Composite Designs. The final response surface model is obtained by the formerly developed CARSO method.
1. Introduction
In chemical processes a number of fields involve products which are mixtures of several components. Under these circumstances the objective of industrial research is reaching a satisfactory level of all technological properties the mixture is expected to exhibit, keeping, at the same time, the cost of raw materials as low as possible.
The way mixtures are produced today is often based on established knowledge and tradition rather than on a scientific approach by chemometric strategies. Consequently it seems likely that most of the mixtures present on the market could be still improved, either in a way that the same properties could be reached at a lower cost or even that technological properties could be improved.
The state of art in mixture analysis is well described in textbooks [1] and brilliantly implemented in commercial software [2]. Based on our previous experience in optimization procedures [3-9] we present here the suggestion of an innovative strategy for designing experiments in mixture analysis called MAURO, as the acronym of Mixture Analysis under Response Optimization. It relies on D-optimal designs performed on the combinatorial explosion of five levels of components composition, keeping in mind the requirements of Central Composite Designs (CCD), which represents the best way to generate response surfaces. The final response surface model is obtained by the formerly developed CARSO method, where the surface equation is derived by a PLS model, invented by H. Wold [10] and developed by S. Wold and his coworkers in Umeå (Sweden) [11], and finally studied at extreme points by Lagrange analysis.
All the software packages used in this study (CARSO [3], DESDOP [4] and GOLPE [6]) are inhouse programs written ad modified by one of us (MB) and are presently available only in DOS versions [12]. Calculations are performed on any personal computer, but the programs are better compatible with older versions of Windows.
2. Procedure
The anchor points wherefrom the strategy was developed were the following:
1) all planned experiments should contain all mixture constituents;
2) the philosophy to be followed is that of CCD, i.e. the lowest number of points, distributed in a balanced way within the multivariate space, so that the design is as centrosymmetrical as possible, with the addition of a few experiments at the central point (Figure 1); the CCD strategy as such can be used profitably with two or three variables, otherwise it requires too many experiments or the risk for a loosely defined response surface is too high;
3) D-optimal designs are particularly suitable for selecting a fairly well balanced number of points from a number of candidates; since they generate, in this application, a non perfectly centrosymmetrical design struc-
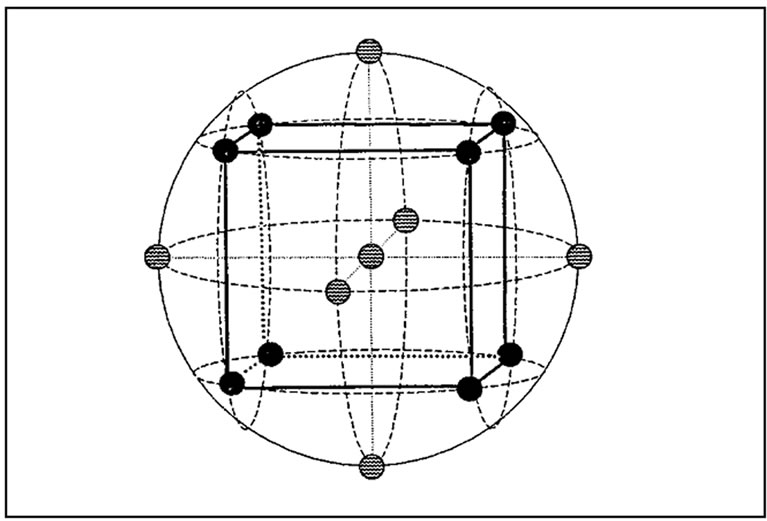
Figure 1. Graphic representation of a Central Composite Design in 3-dimensions.
ture, the response surface equation cannot be derived by the usual ordinary regression method, but it can be easily computed by the CARSO procedure [3];
4) quite often there are several technological properties to be kept under control at the same time: each of them should be inside the operative range known to be appropriate; therefore, while each individual response can be studied on its own to understand how it is affected by the mixture composition, the overall behavior of the mixture is better studied in terms of a total desirability function.
All these criteria were taken into account when developing MAURO, but the key novelty is given by the choice of the design strategy: we decided to extract D-optimal designs from the combinatorial explosion of five levels (as in CCD) defined for each mixture component. Moreover, since the mixture composition is usually expressed in terms of percentages, the problem is fully defined by (n − 1) constituents and the remaining one, being the complement to 100 of the sum of all the others, can be kept out of the analysis.
Significant attention has to be paid to the selection of the “best” design. Since any D-optimal run produces similar but not identical results in terms of D-efficiency (there are many ways of picking up a few points out of hundreds or thousands in such a way that the volume of the polyhedron defined by the chosen points is more or less the same) a specific explanation of the criteria to be used for selecting the best design will be described in the next section.
Once one has chosen the best design, run the experiments and collected the required results, these should be modelled by an appropriate procedure. This method, called CARSO [3], was published some twenty years ago by our group in Perugia and since then it has helped us to solve a large number of practical problems, although it has been used very little elsewhere.
The response surface equation is a quadric one containing, for each variable, the linear and the quadratic terms, plus all possible bifactorial interactions. The equation coefficients are usually derived by Multiple Linear Regression on the expanded X matrix when the data are collected according to a rigorous orthogonal design. Since data extracted by a D-optimal criterion are usually well rounded, but not strictly orthogonal, the regression method to be used is PLS. The quadric regression coefficients can be derived thereafter from PLS loadings, equalizing the PLS system to the regression equation.
The computed pseudo-coefficients define a response surface to be studied in order to search for its maximum point. The first step is to find out the stationary point, i.e. the only point in the domain where all partial first derivatives of y with respect to each x-variable are zero. However, this point can either be a maximum or a minimum or a minimax, and this can be sorted out by the signs of the second derivatives. In the latter case, which is by far the most frequent, the search is not finished: the maximum y value on the surface should be on one of the borders of the experimental domain. To this end, the extreme points (points where one or more variables are fixed at the border(s) value(s) and one searches for the point where the partial derivative(s) of the other(s) variable(s) is zero) should be investigated, and the y value at those coordinates computed.
On cutting the response surface at different y levels it is possible to generate an isoresponse diagram which gives information on the operative ranges. In case of multiple response one can either focus on the common ranges for all responses or compute individual desirability functions, which all converge to define a total desirability, given by the n-th root of their product. This total desirability function can be used to ensure the best compromise between the requirements of each individual response. Details for desirability functions are reported in a subsequent section.
3. Design Selection
D-optimal designs are straight optimizations based on a chosen optimality criterion and the model that will be fit. The optimality criterion used in generating D-optimal designs is that of maximizing [X’X], the determinant of the information matrix X’X. In other words it means suggesting a number of points from a larger number of candidates in such a way that they define the largest possible volume included in the polyhedron defined by these points in the multivariate space.
The problem we handled in the case study, details of which are reported in a subsequent section, referred to a mixture containing eight different components. When one of them, usually the solvent, is kept out of the design strategy, we have a 7-variables problem. If we wish to take into account as candidates all possible combinations of the seven variables at five levels (−1, −0.7, 0, 0.7, 1, in coded terms) we have 5 to the 7th = 78125 points in a 7-dimensional space.
Since the D-optimal algorithm contained in our program DESDOP [4], based on the Mitchell algorithm, can generate quite a number of designs with roughly the same efficiency, a number of required features should be decided a priori. In particular it should be decided whether the modelling is to be done by a linear or a quadratic equation, and the number of experiments one is prepared to carry out.
In principle quadratic designs are better than linear design in terms of D-efficiency because they cover a larger multivariate space, but they require a greater number of experiments: 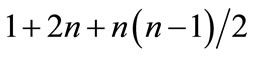 points are needed for a fully quadratic model, while (n + 1) are sufficient for the linear one. With seven variables this means 35 experiments instead of eight. However, 35 experiments being somewhat too many, we decided to apply the D-optimality algorithm using only the linear and quadratic terms, and excluding the interaction terms, which makes 14 experiments, and to compare it with linear models.
Therefore, in order to mimic the roundness of the philosophy of CCD, we decided that the number of points to be designed is 14, to which a few points at the design center (say four, to evaluate the consistency of replicates) should be added.
The first observation was that the results obtained on using the standard version of DESDOP were unsatisfactory. In fact, in order to select the largest possible volume included in the polyhedron defined by the points in the multivariate space, the standard design picks up only points with coordinate at vertices (−1, 1) or zero, whereas the intermediate levels (−0.7, 0.7) are never chosen. Accordingly we had to define and implement a dedicated version of DESDOP with constrained requirements.
The main constraint we had to apply was defining the allowed number of vertices: we focused our attention on 2, 3 and 4 vertices per object, since on increasing their number the results get closer to the traditional one. Moreover, we had to define a few criteria to select the “best” design among the different results obtained from each run. The same criteria can also be used to select the best number of vertices.
Although statisticians use well recognized parameters to compare designs, we decided to use three different criteria, all aimed to resemble the CCD features of roundness: the algebraic sum of the levels for each variable, computed variable wise and summed up on all variables, which should be as close as possible to zero as a measure of the design symmetry, together with the number of well centred variables and the number of missing variable levels for each object.
The results of the comparison, obtained on performing ten different runs for each situation, are reported in Table 1. The best compromise is found between the simmetry of the design and the number of missing levels: these clearly indicate that quadratic designs with three vertices is the best choice. On using the same criteria we could eventually choose the “best” design among the ten experiments performed with three vertices and the selected design is reported in Table 2.
It should be pointed out that any D-optimal design is based on a certain selected candidate set. Hence the MAURO approach comprises a particular constrained selection of candidate set, followed by D-optimal design of a constrained model (no interactions) and consequent PLS analysis and model based optimization (CARSO). In these connections our approach resembles other types of designs that strive for multiple levels, i.e. filling designs and onion designs.
4. Desirability Functions
A desirability function is a transformation of the numerical values of the response under study into values varying between 0 and 1, where 0 indicates an unacceptable analytical value, and 1 indicates the best possible value, thus including into the response evaluation the expectations of the investigators. The simplest way of
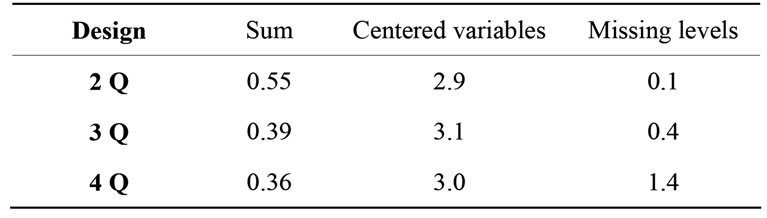
Table 1. Results of selection criteria.
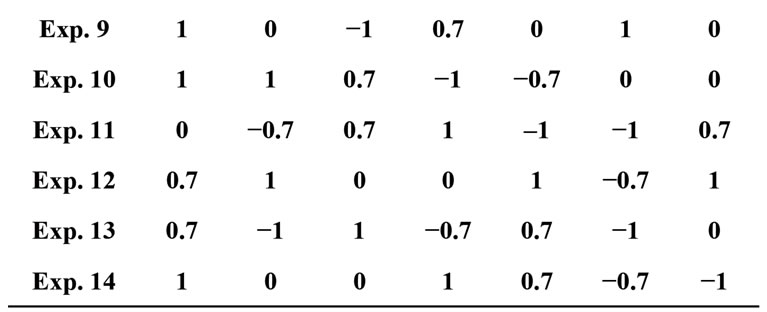
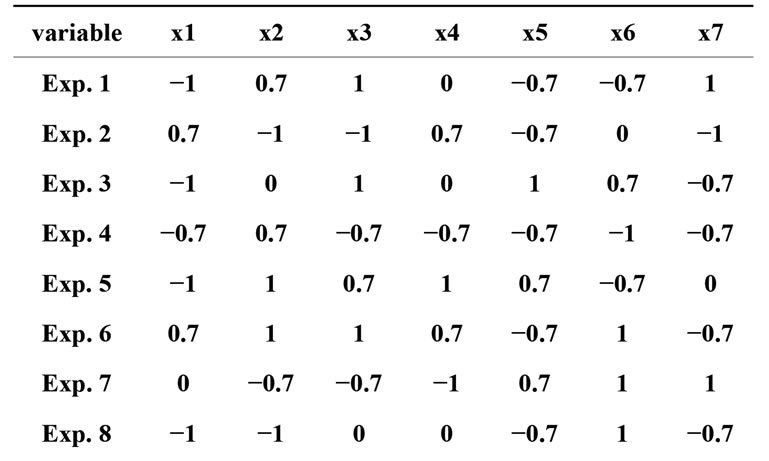
Table 2. Selected quadratic design with 3 vertices.
defining desirability functions is a linear transformation, which is easily done when a response is better if it is higher or lower. Quite often, however, the expected operative ranges of properties are closed intervals: in this case the function assumes a trapezoidal form. Under these conditions it is convenient to give the value of 1 to a small range around the central point of the operative interval, and to assign a 0.5 value to the borders of such an interval.
When dealing with several responses at the same time there are two alternative ways to handle the problem. On one side each individual response can be studied on its own either as analytical values or as the corresponding desirabilities, and the common operative intervals can be derived thereafter. On the other side each response can be transformed into its desirability and a total desirability function can be computed as their geometrical mean (the n-th root of their product). However, if the relative importance of each response is well known, it is possible to define partial desirabilities for groups of responses and compute therefore the total desirability giving selected weights to individual (or groups of) responses. Indeed the best way of defining an industrial problem would be finding the cheapest cost of raw materials that ensures anyway that all responses are within their operative ranges, and this was the philosophy that guided our strategy in the Case Study.
5. Results and Discussion
The case study we present regards a varnish constituted by eight different constituents, the nature of which is not reported to preserve the property of the industrial partner. On excluding the main solvent the problem is therefore defined by seven variables. The design strategy used is that reported in Table 3, to which four replicates at the central point were added, for a total number of 18 experiments.
Two responses were studied: viscosity (Ford cup no. 4) and gloss (the attribute that causes objects to have shiny
Table 3. Operative ranges found from the model compared to the experimental ones.
or matt appearance). Each response was studied individually as analytical values by the CARSO procedure, i.e. running a linear PLS model on the expanded X matrix, which contains 35 terms. This step allowed to estimate the soundness of each model (in terms of explained variance) and to find out which terms significantly affect each response.
We transformed the real technological measurements of viscosity and gloss into their individual desirability functions as well as their total desirability. This final overall desirability was eventually modelled by the CARSO procedure against the X matrix built by the amount of the seven compounds for each of the 18 experiments. The resulting operative ranges for each component are reported in Table 3, where they are compared with the corresponding experimental ranges.
The PLS score plot is reported in Figure 2.
The modeling results, as expressed by the PLS loadings, not reported, showed the minor importance of four of the components, while the other three significantly affect the overall response. Consequently we fixed the former components at predefined levels within the ranges obtained and we made a number of formulations, predicting the technological properties by our model on varying the latter variables within their ranges.
The computational experiments are reported in Table 4, together with their cost of raw material. In all cases the technological properties are within their acceptability ranges. The final objective was to test experimentally the less expensive mixtures: indeed we found that mixtures 1 - 4 of Table 4 did show that their properties were within the expected ranges.
6. Conclusions
A novel procedure, which couples D-optimal designs with a combinatorial chemistry approach under the philosophy of Central Composite Designs, was outlined and used successfully in a case study involving a mixture with eight components.
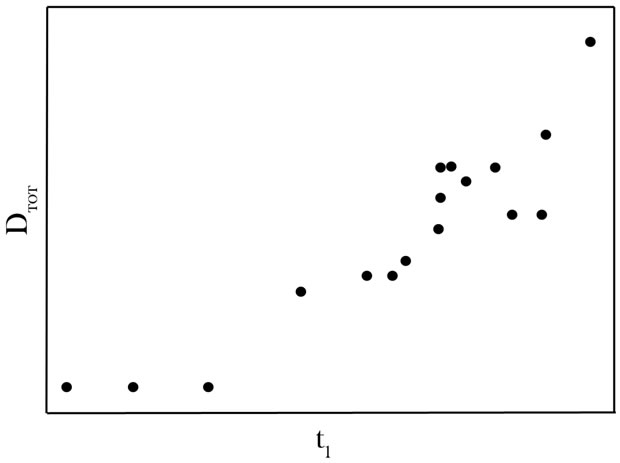
Figure 2. PLS score plot of the CARSO model of the overall desirability function.
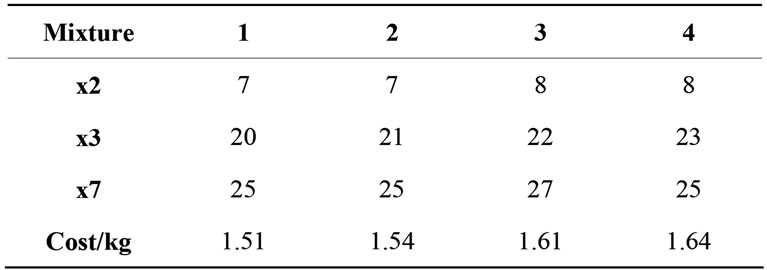
Table 4. Cost of raw material for predicted properties viscosity and gloss.
The problem was handled collecting 18 experimental results only, and measuring two technological responses, which were all described by an overall desirability function. The CARSO analysis of the overall function, in terms of the expanded matrix of the seven components, was used to define a response surface wherefrom the operative ranges for each component could be computed. A number of simulated predictions, based on CARSO models, permitted to establish which are the cheapest mixtures still bearing good technological properties: they were all experimentally verified.
By this new approach it was possible to obtain a product that, still having the expected values of properties, allows saving about 10% of the cost of raw material. It is likely that a similar result could be obtained on studying most of the real processes not yet investigated by chemometric strategies.
7. Acknowledgements
Authors are grateful to the University of Perugia and to Dr. Giuseppe Giannetti (Flint Group) for research grants and to Proff. Svante Wold (Umeå) and Gabriele Cruciani (Perugia) for invaluable advice and suggestions.
REFERENCES
- G. E. Box, W. G. Hunter and J. S. Hunter, “Statistics for Experimenters,” Wiley, New York, 1978.
- MODDE: www.umetrics.com
- S. Clementi, G. Cruciani, G. Curti and B. Skagerberg, “PLS Response Surface Optimization: The CARSO Procedure,” Journal of Chemometrics, Vol. 3, No. 3, 1989, pp. 499-509. doi:10.1002/cem.1180030307
- M. Baroni, S. Clementi, G. Cruciani, N. Kettaneh-Wold and S. Wold, “D‑Optimal Designs in QSAR,” Quantitative Structure-Activity Relationships, Vol. 12, No. 3, 1993, pp. 225-231. doi:10.1002/qsar.19930120302
- G. Cruciani, S. Clementi, D. Pitea, M. Lasagni and R. Todeschini, “A Chemometric Approach for Evaluating the Efficiency of a Pilot Plant for MSW Combustion,” Chemosphere, Vol. 23, No. 8-10, 1991, pp. 1407-1416. doi:10.1016/0045-6535(91)90165-A
- M. Baroni, G. Costantino, G. Cruciani, D. Riganelli, R. Valigi and S. Clementi. “Generating Optimal Linear PLS Estimations (GOLPE): An Advanced Chemometric Tool for Handling 3D‑QSAR Problems,” Quantitative Structure-Activity Relationships, Vol. 12, No. 1, 1993, pp. 9-20. doi:10.1002/qsar.19930120103
- M. Bertuccioli, S. Clementi, G. Cruciani, G. Giulietti and I. Rosi, “Food Quality Optimization,” Food quality and preference, Vol. 2, No. 1, 1990, pp. 1-12. doi:10.1016/0950-3293(90)90025-P
- S. Clementi, G. Cruciani, M. Pastor and T. Lundstedt, “Series Design in Synthetic Chemistry,” In: F. Gualtieri, Ed., New Trends in Synthetic Medicinal Chemistry, Vol. 7, Wiley-VCH, Weinheim, 2000, pp. 17-37. doi:10.1002/9783527613403.ch2
- M. Baroni, P. Benedetti, S. Fraternale, F. Scialpi, P. Vix and S. Clementi, “The CARSO Procedure in Process Optimization,” Journal of Chemometrics, Vol. 17, No. 1, 2003, pp. 9-15. doi:10.1002/cem.772
- H. Wold, “Nonlinear estimation by Iterative Least Squares Procedures,” In: F. N. David and J. Neyman, Eds., Research Papers in Statistics, Festschrift for J. Neyman, Wiley, London, New York, 1966.
- S. Wold, C. Albano, W. J. Dunn, U. Edlund, K. Esbensen, P. Geladi, S. Hellberg, E. Johansson, W. Lindberg and M. Sjöström, “Multivariate Data Analysis in Chemistry,” In: B. R. Kowalski, Ed., Chemometrics, Reidel, Dordrecht, 1984, pp. 17-95
- www.miasrl.com.
NOTES
*Corresponding author.