Advances in Bioscience and Biotechnology
Vol.3 No.4(2012), Article ID:21866,3 pages DOI:10.4236/abb.2012.34047
Adaptive removal of power-line interference from high resolution ECG
![]()
Centre for Advanced Research in Engineering, Islamabad, Pakistan
Email: ismail_sadiq_ee@yahoo.com, amz369@hotmail.com, idreeszaman@yahoo.com, ammadhassan11@gmail.com, tahir.zaidi@case.edu.pk
Received 1 May 2012; revised 12 June 2012; accepted 6 July 2012
Keywords: Notch filter; Power Spectrum; Linear Interpolation; Adaptive Noise Removal
ABSTRACT
The paper presents a novel approach to adaptive removal of power-line interference, taken to be at 50 Hz, from high resolution ECG sampled at 1 KHz. ECG data consists of 12 lead data. Each of the 12 leads contains power line interference at the time of acquisition. So power line interference needs to be removed from each lead. An approach that uses the power spectral density over the range of interest is used to determine the exact frequency of the interfering component and filter coefficients for the desired notch filter are determined using an interpolation technique.
1. INTRODUCTION
Power-line interference is a common source of noise encountered during ECG acquisition. It happens due to the frequency component of the AC mains that occurs at 50/60 Hz (depending on the region). The problem is that this frequency component does not occur exactly at 50 Hz. So a fixed notch filter of 50 Hz will notch effectively remove the noise component effectively even if it occurs at 49 or 51 Hz. The paper proposes a technique which first locates the peak that occurs in the region of interest and estimates the coefficients of the filter required to remove the detected noise component. The technique is not just limited to noise detect at 50 Hz it can be used to detect and remove noise at any frequency adaptively. The algorithm is also efficient as it only calculated the frequency spectrum over the region of interest and hence it is not computationally intensive.
2. METHOD
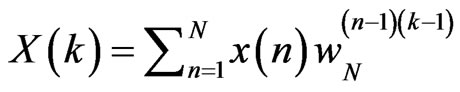
10 second data of ECG sampled at 1 KHz is used as an input. The DFT is evaluated over these 10,000 points for the frequency range of 45 to 55 Hz. A fewer number of points can also be used while calculating the DFT (but at a slight expense of accuracy). The formula for the DFT (given in [1]) is given below:
 (1)
(1)
where  corresponds to the input signal of ECG data, N corresponds to the total number of points (10,000 in our case),
 (2)
(2)
And k corresponds to the component of the DFT. It ranges from the value corresponding to 45 Hz to the value corresponding to 55 Hz. It can be calculated from the following formula:
 (3)
(3)
“Fs” is the sampling frequency, “N” is the number of points In the DFT and f the frequency for which k is to be calculated.
From the calculated DFT, the max point in the range of 45 - 55 Hz and the corresponding frequency is determined. The coefficients for a notch filter with that frequency are determined using an interpolation technique. The notch filter is a 2nd order IIR filter with numerator and denominator polynomials going up to 2nd order. All the coefficients are the same for notch filters in the range of 45 to 55 Hz except for the 1st order, corresponding to (n – 1), denominator and numerator coefficient (which are identical) but vary linearly as the frequency of the notch is increased. Figure 1 shows a plot of the 1st order coefficient as the frequency increases from 45 to 55 Hz.
The trend followed by the coefficients is almost linear; hence linear interpolation can be used to estimate the 1st order coefficient for a frequency that lies within this range.
The formula used for Fs = 1 KHz and a bandwidth of 1 Hz is given in (4):
 (4)
(4)
where f is the detected frequency and −1.86388191743263 and −1.90233884591712 are the first order coefficients for the notch filter at frequencies of 55 and 45 Hz respectively.
3. RESULTS
Figure 2 shows the FFT for an ECG data sample over the range of 45 to 55 Hz. The spike exists exactly at 49.13 Hz. The adaptive algorithm we implemented estimated the spike at 49.1333 Hz and removes this noise, after estimating the coefficients for the notch filter, as shown in Figure 3.
4. CONCLUSION
A technique for removing noise at specific frequencies through notch filters has been implemented. A high
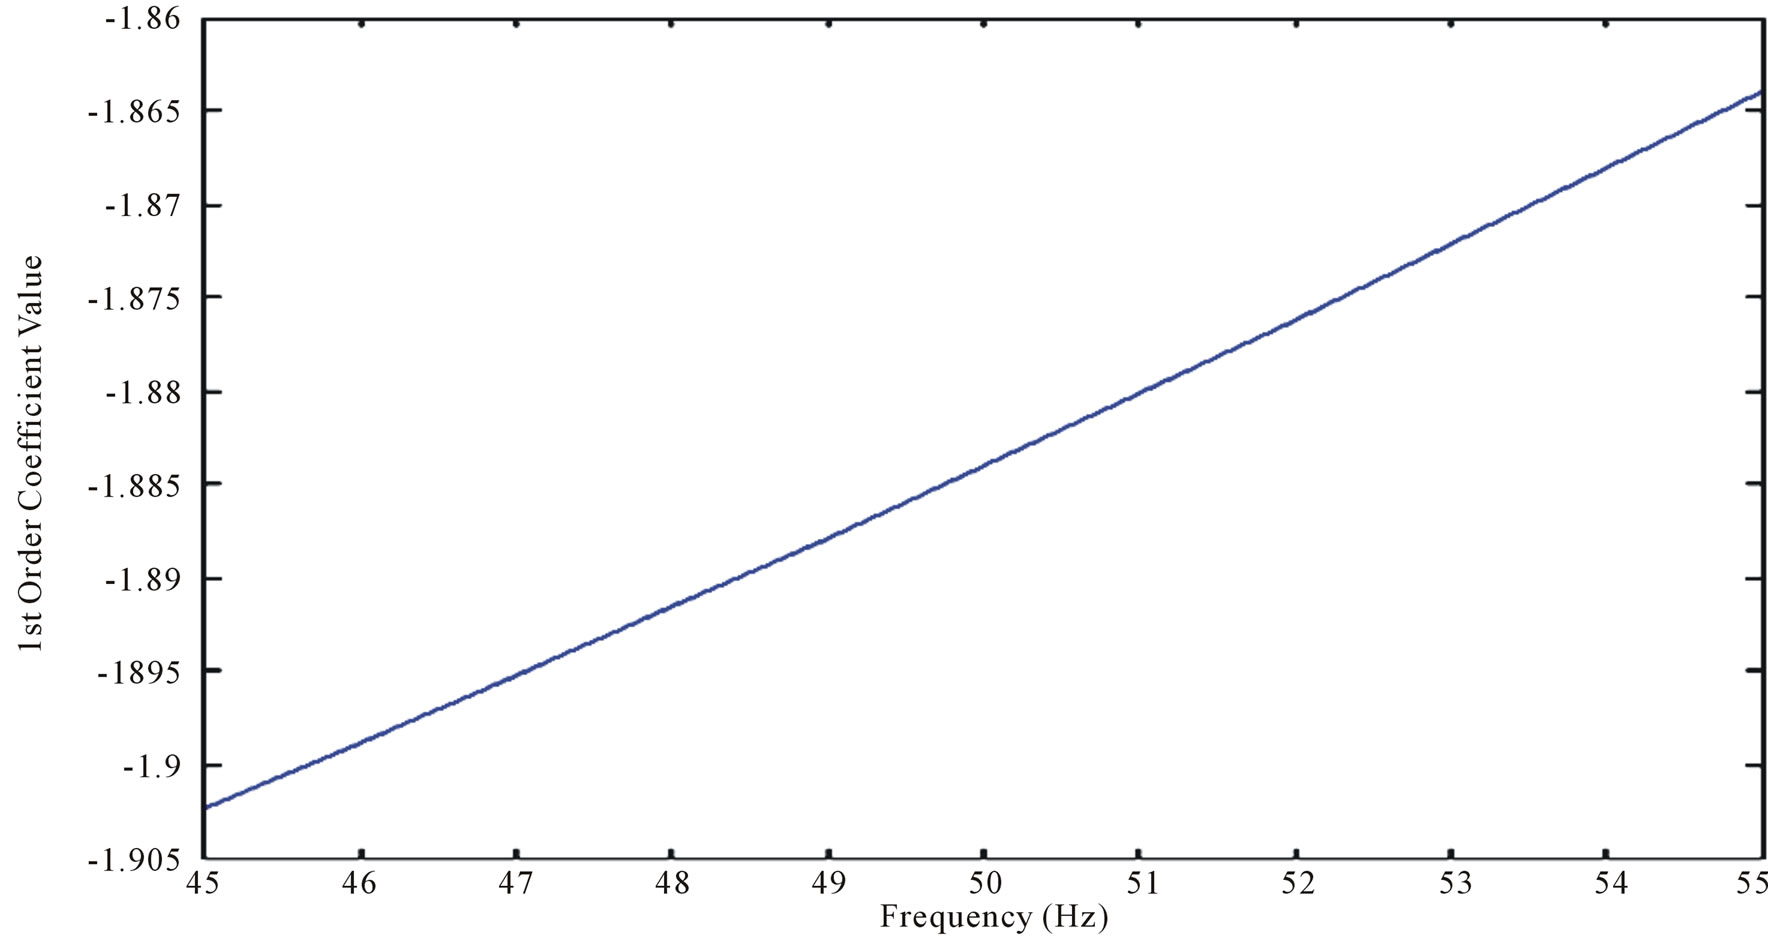
Figure 1. 1st Order Coefficient vs Frequency plot for notch filter designed for 1 KHz sampling frequency.
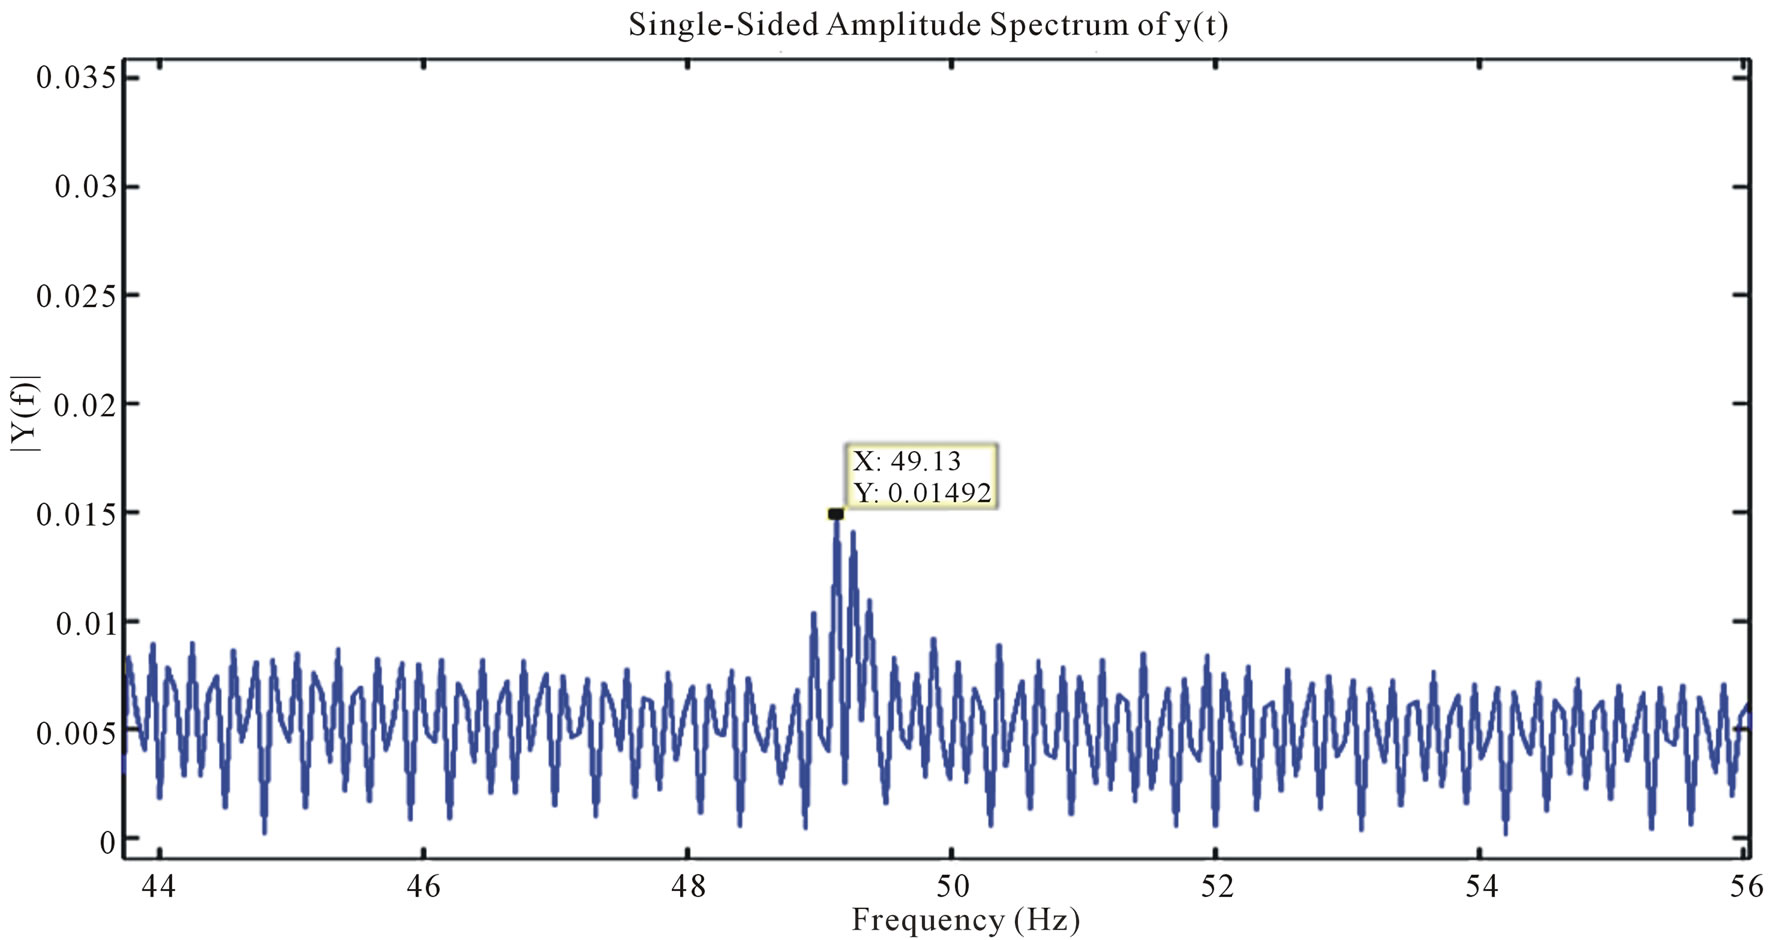
Figure 2. FFT for raw ECG Data acquired at 1 KHz over the range of 45 to 55 Hz (x-axis: Frequency in Hz, y-axis: Power Spectrum).
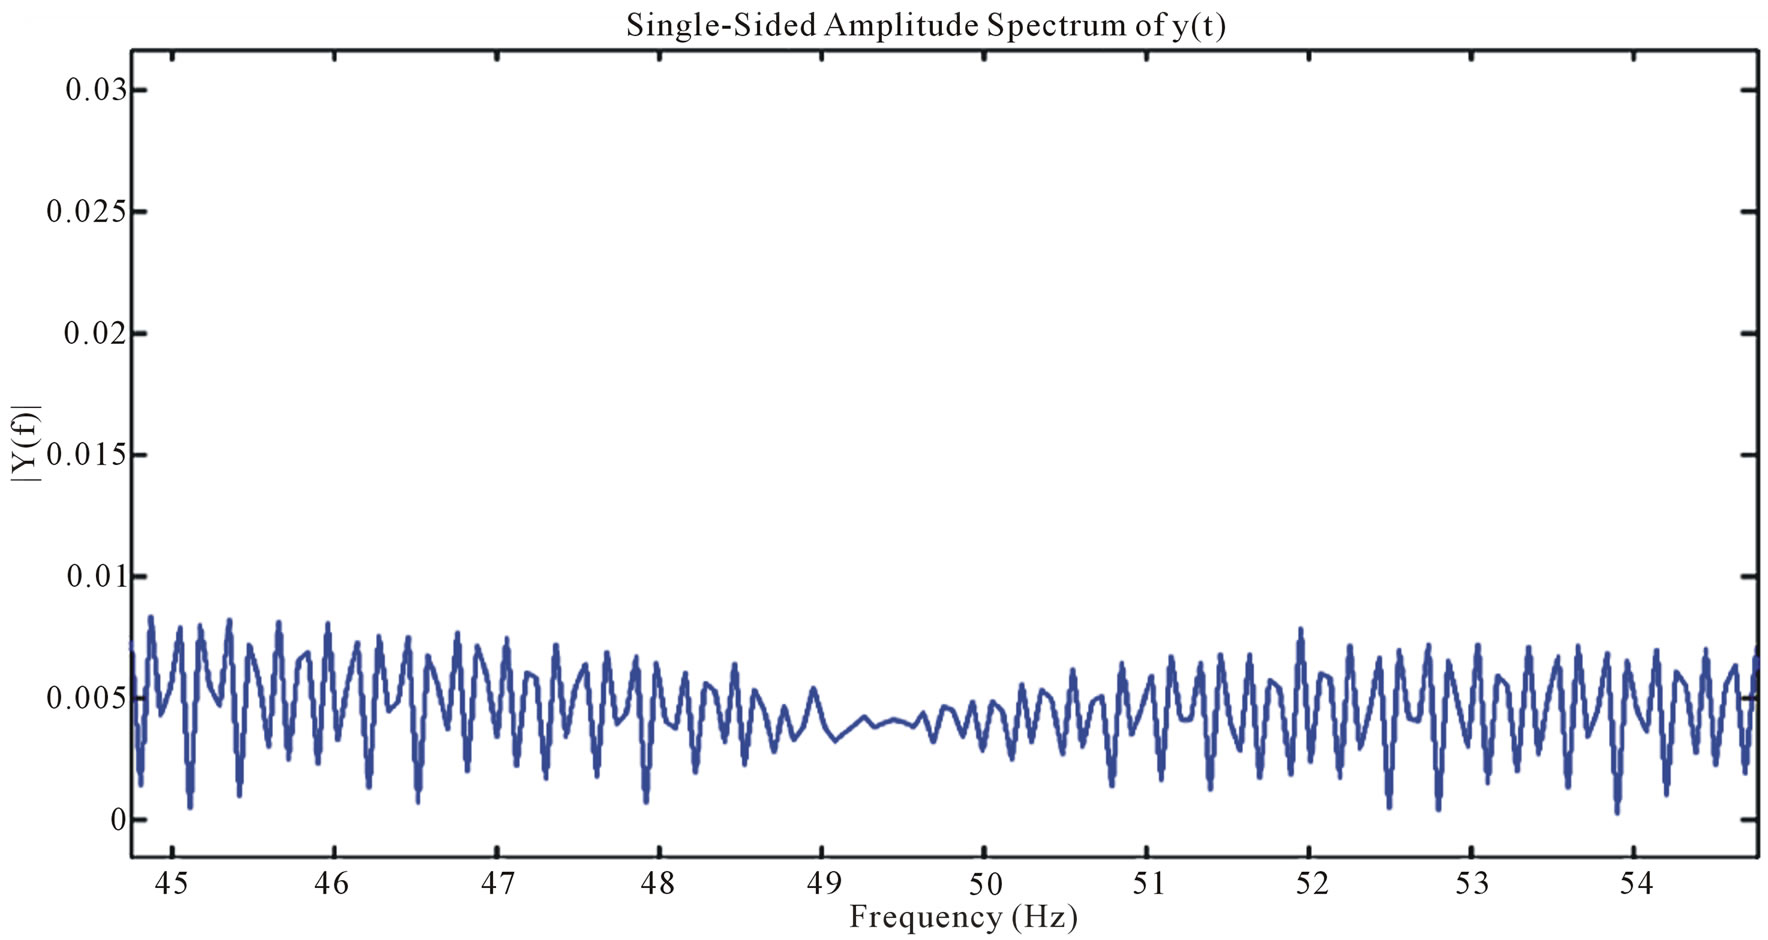
Figure 3. FFT for ECG Data acquired at 1 KHz over the range of 45 to 55 Hz after noise at 49.13 Hz is adaptively removed (x-axis: Frequency in Hz, y-axis: Power Spectrum).
number of points while calculating the DFT leads to an accurate estimation of the frequency of the noise. The technique does not require a desired signal as is required in traditional adaptive techniques [2-4] and hence can be implemented on any sort of data.
REFERENCES
- Proakis, J.G. and Manolakis, D.G. (1996) Digital signal processing. 3rd Edition, Prentice Hall, Upper Saddle River, 343-345.
- Olguín, D.O., Bouchereau, F. and Martínez, S. (2005) Adaptive notch filter for EEG signals based on the LMS algorithm with variable step-size parameter. Conference on Information Sciences and Systems, Baltimore, 16-18 March 2005.
- Mihov, G. (2011) Subtraction procedure for removing powerline interference from ECG: Dynamic threshold linearity criterion for interference suppression. The 4th International Conference on Biomedical Engineering and Informatics (BMEI), Sofia, 15-17 October 2011.
- Malindi, P. (2002) Cancelling power line interference in electrophysiological signals. ECT Research Journal, 2.