Advances in Bioscience and Biotechnology
Vol.3 No.1(2012), Article ID:17190,5 pages DOI:10.4236/abb.2012.31006
Industry dynamics in biotechnology
![]()
Swiss Federal Institute of Technology, Lausanne, Switzerland
Email: Fariba.Hashemi@epfl.ch
Received 1 October 2011; revised 14 November 2011; accepted 19 December 2011
Keywords: Biotechnology; Industry Dynamics, Innovation
ABSTRACT
The field of modern biotechnology is thought to have largely begun in 1980, when the United States Supreme Court ruled that a genetically-modified microorganism could be patented. The growth of the Biotechnology industry has stimulated extensive research on its determinants. One of the areas which has attracted a fair amount of attention is the distribution of firm size within an industry. What is less known however, is the dynamics of firm size. This paper considers a statistical model to describe the spatial dynamics of firm size across the biotechnology industry. It is found that firm size fluctuates around its long run stationary equilibrium according to a temporal drift and random disturbance. The empirical results illustrate that diffusion is a potential technique for the analysis of spatial dynamics of firm size.
1. INTRODUCTION
While much attention has been devoted in the economics literature to the explanation of the shape of firm size distribution with reference to steady state arguments [1-7], the dynamics in question have been relatively ignored. Sutton [8] proposes a theory with implications for the evolution of the size distribution but the empirical test of his theory does not include dynamic data. McCloughan [9] simulates the evolution of size distribution of firms but is interested in concentration as a summary measure of the size distribution, rather than on the whole distribution. The stochastic process generating the size of a firm in Jovanovic’s model [10] is characterized by a form of heterogeneity, the model implies a monotone convergence, with the size distribution of survivors increasing stochastically over time. The present study builds on Jovanovic, but proposes a framework for the smooth evolution of density of cross-sectional distribution of firm size instead. It is shown that interesting issues arise when one considers how firm structure evolves over time, rather than simply attending to equilibrium implications of processes. Information on the shape and time-evolution of the size distribution of firms over an extended period of time can be used to make inferences about an underlying process; specifically, on which characteristics lead to which kinds of dynamics.
2. THE MODEL
Consider an industry consisting of a constant number of firms with different sizes. Average costs of producing an amount x of output are a non-increasing function of firm size, for a given quality of output. Each firm may have significant fixed costs, and marginal costs may essentially be constant. Furthermore, consumers prefer small firms for perceived higher quality of service. The set of firms forms a distribution which evolves over time.
Consistent with the above, it is hypothesized that the dynamics of firm size distribution rely on two counteracting forces: 1) a mean-reversion process along time, and 2) a diffusion process across space, driven by learning, trial and error and imitation [11,12]. More precisely, for the drift spread, it is assumed that there exists some equilibrium distribution of firm size with a certain mean and variance, towards which the ensemble of firms gravitate. The diffusive flux is related to the concentration field, by postulating that the flux goes from regions of high concentration to regions of low concentration, following Fick’s law, with a magnitude that is proportional to the concentration gradient.
Remark: In the study of transport phenomena (heat transfer, mass transfer and fluid dynamics), “flux” is defined as the flow through a unit area per unit time. In biology, flux relates to movement of a substance between compartments. In the case of movement of molecules across a membrane, flux is defined by the rate of diffusion or transport of a substance across a permeable membrane. Equations based on Fick’s law have been commonly used to model transport processes in neurons, biopolymers, pharmaceuticals, porous soils, population dynamics, semiconductor doping process, etc. Theory of all voltametric methods is based on solutions of Fick’s equation. For an elaboration see [13,14].
In general, one can study a Markov process generated by a matrix of transitions from one firm size to another, where the Markov process can be treated as firm size diffusion. Then one can apply the general Fokker-Planck equation to describe evolution in time of firm size. Hence, assuming that firm size behaves like a stochastic process and that it is continuous and Markovian, we consider the most natural candidate; a classical linear stochastic differential equation driven by Gaussian white noise:
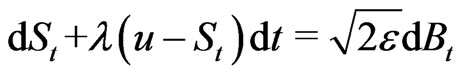 (1)
(1)
where  is firm size.
  denotes velocity of adjustment to stationary equilibrium interpreted as firm size adjustment rate. For simplicity, assume this rate to be constant. u denotes the mean of the stationary equilibrium distribution,
  is a constant diffusion parameter, and
  is the Brownian motion. Equilibrium in this paper refers to a statistical equilibrium, which is characterized by a stationary probability distribution of firm size1.
3. ANALYSIS OF THE MODEL
Letting f denote probability density, and s firm size, the time-development of the distribution in Eq.1 can be expressed by:
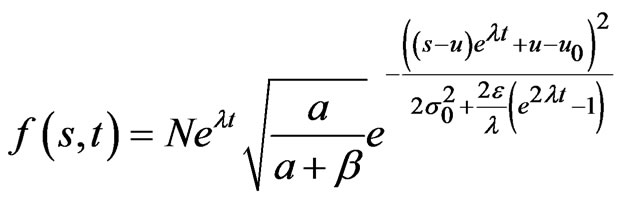 (2)
(2)
where
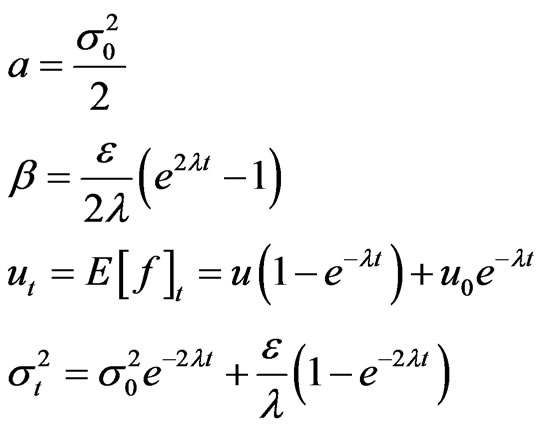 (3)
(3)
 represents the initial mean of firm size distribution and
  represents the initial variance. N is the normalization constant. The process derived from the diffusion model evolves according to an Ornstein-Uhlenbeck, but with a transition, such that the mean tends to u, instead of 0.
4. EMPIRICAL APPLICATION
Our data set describes the biotechnology industry between the years 1989-2007. The sample consists of a total of 197 biotechnology firms primarily engaged in the research, development, manufacturing and/or marketing of products based on genetic analysis and genetic engineering2. Observations were available annually. We have chosen number of employees as proxy for firm size realizing that for technological and research industries such as biotechnology, there are additional measures one could use. On this, we have built on earlier literature on firm size where size had been proxied by sales, income, number of employees, or total assets [1,4,7,16-18]. An interesting property of firm size distributions noted in previous studies of large firms is that the qualitative character of such distributions is independent of how size is defined [4].
Figure 1 provides a description of the evolution of the distribution of firm sizes in the data, where our measure of firm size is the total number of employees. The vertical axis measures firm size in logarithms, and the horizontal axis measures time in years. The solid curve represents the mean size of the industry and the dotted curves one standard deviation around the mean.
Estimation
The model has been applied to log firm size distribution in the biotechnology industry as a function of time. The dynamic process has five parameters: , u, ε,
  , and λ.
  denotes the initial mean of the size distribution (1989), and u denotes the mean of the steady state distribution.
  is the initial variance, ε represents the strength of the diffusion effect, and λ represents the strength of the mean reversion. The process derived from the diffusion model is the size distribution of the population at chosen sequences of times through the observation period. It evolves according to an Ornstein-Uhlenbeck, but with a transition, such that the mean tends to u, instead of 0. From the analytic solution to the model, the dynamics of the size distribution can be followed through time, given our initial distribution function3.
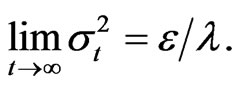
Table 1 reports estimates for the five model parameters, along with the standard errors and t-values.
Figure 2 graphically illustrates the mean of the firm size distribution in the biotechnology data (dotted curve), superimposed on the mean of the size distribution as predicted by the model (bold solid curve, +/– one standard deviation). The vertical axis on this panel measures the mean of the size distribution (in logarithms) and the horizontal axis measures time in years.
Figure 3 graphically illustrates the standard deviation of the size distribution in the biotechnology industry (dots), superimposed on the standard deviation of the
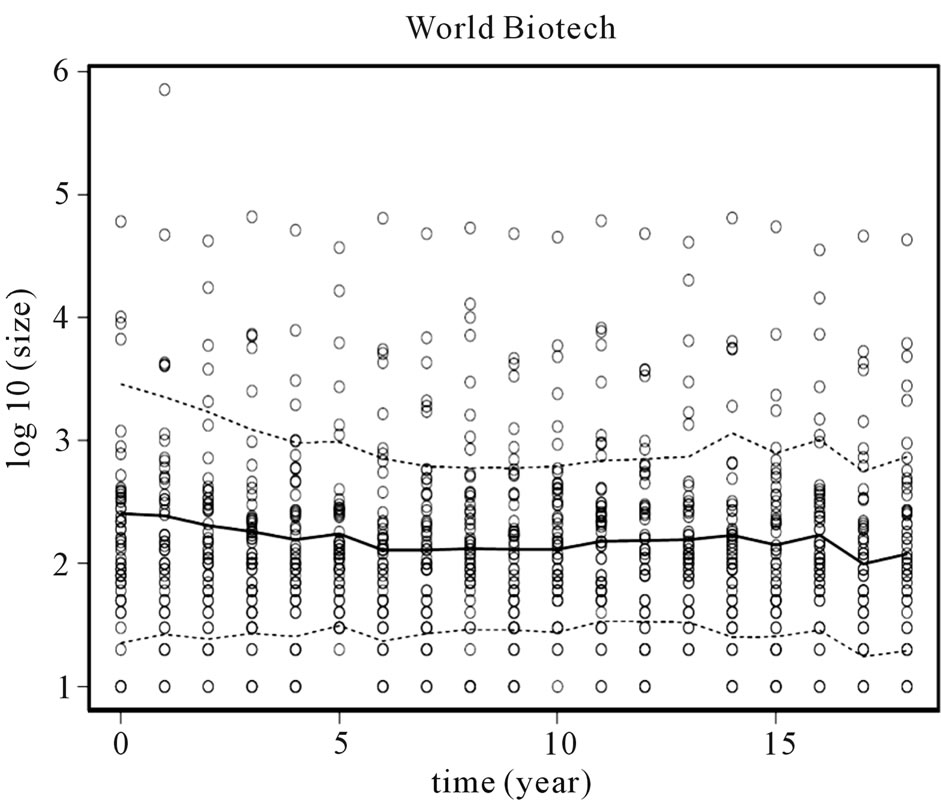
Figure 1. Distribution of firm size in biotechnology industry.
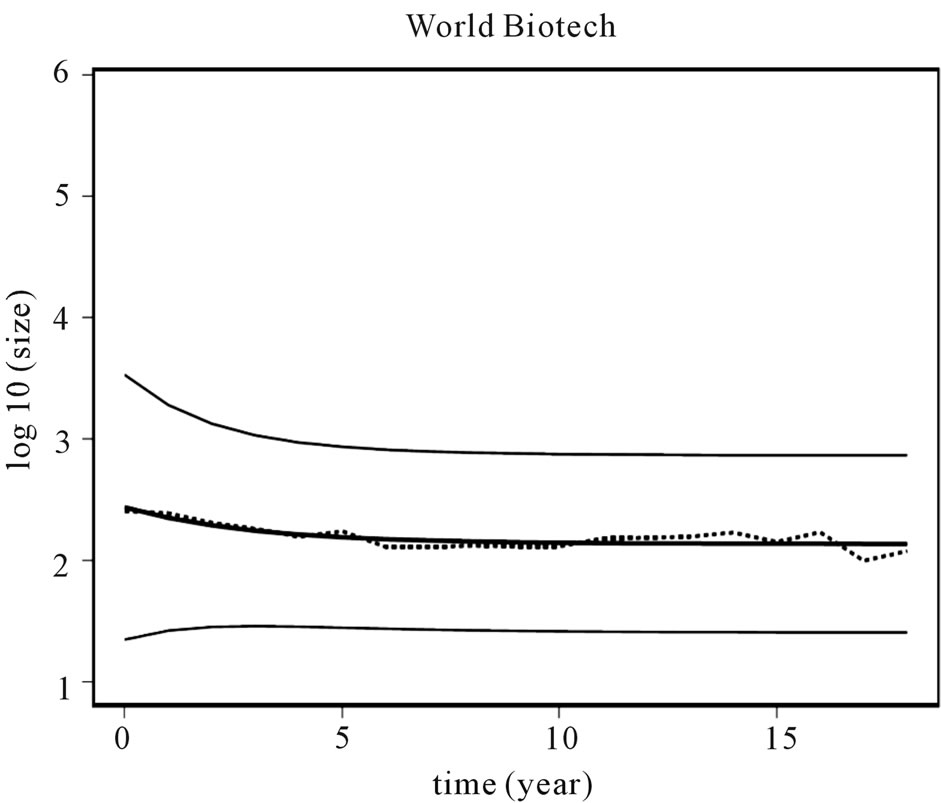
Figure 2. Distribution mean.
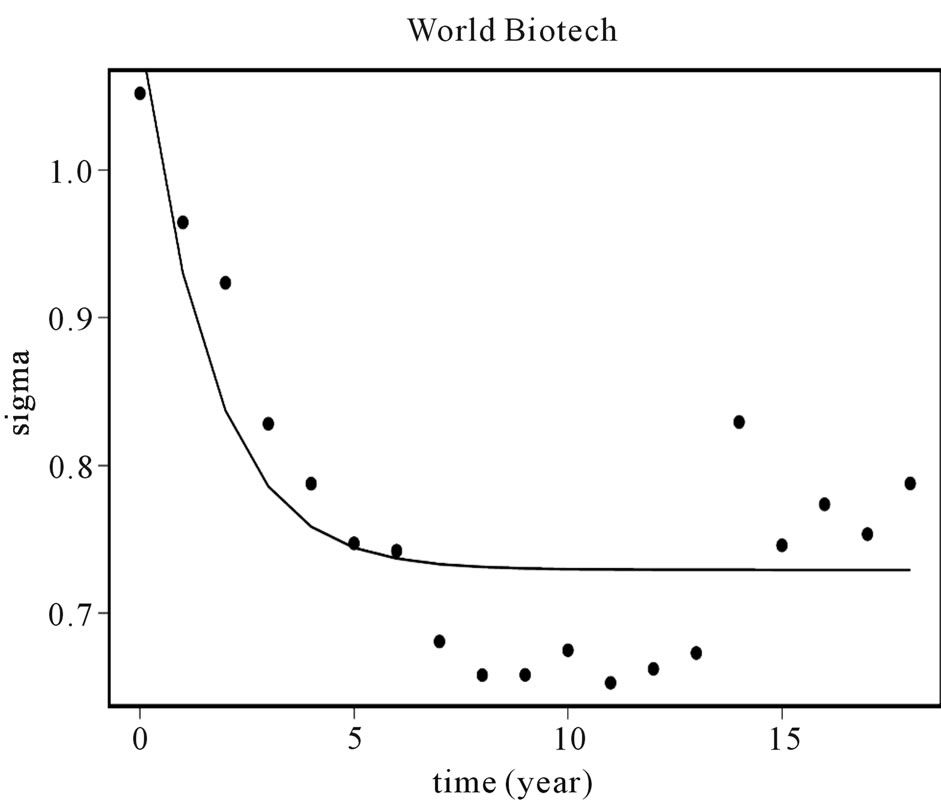
Figure 3. Distribution standard deviation.
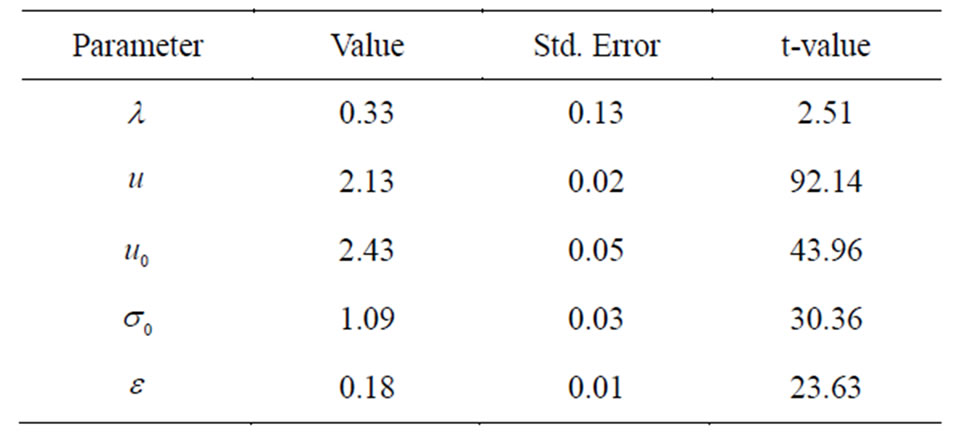
Table 1. Parameter estimates for biotechnology industry.
distribution as predicted by the model (solid curve).
In order to confirm that the parameter estimates reliably characterize the real data presented in the descriptive analysis, Figure 4 graphically illustrates the evolution of the firm size distribution (log-normals) over time for the industry, superimposed on histograms which describe the time evolution of the distribution of firm sizes in the data (for selected years). The solid curves in these figures illustrate the distribution of firm size as predicted by the model, and the dotted curves illustrate the distribution of firm size in the data. The vertical axes in these figures denote frequency, and the horizontal axes measure firm size in logarithms. These figures illustrate that the nice pattern which we see in the fitted log normals are being pulled out of a set of histograms whose shape are irregular.
The following observations can be made concerning our results:
1) Figure 3 illustrates that the mean of the distribution is clearly evolving, corresponding to our theoretical predictions.
2) Figure 4 illustrates that the variance of the distribution is evolving, likewise corresponding to our theoretical predictions.
3) Table 1 reports that the value for the strength of the mean reversion process  is positive, corresponding to our theoretical predictions.
4) The value for the strength of the diffusion effect  is small and positive, likewise corresponding to our theoretical predictions. The diffusive limit is:
 The results predict that if we start with a normal distribution and let the model drive the distribution, the distribution variance will tend toward a constant
  and concentrated around a mean u.
5. CONCLUSIONS
A methodology has been proposed which is a more transparent way to quantify the dynamics of firm size, as it avoids the complications associated with dynamic inference and statistical regression fallacy inherent in statistical cross-sectional tests [24,25].
The model developed in this paper can be extrapolated
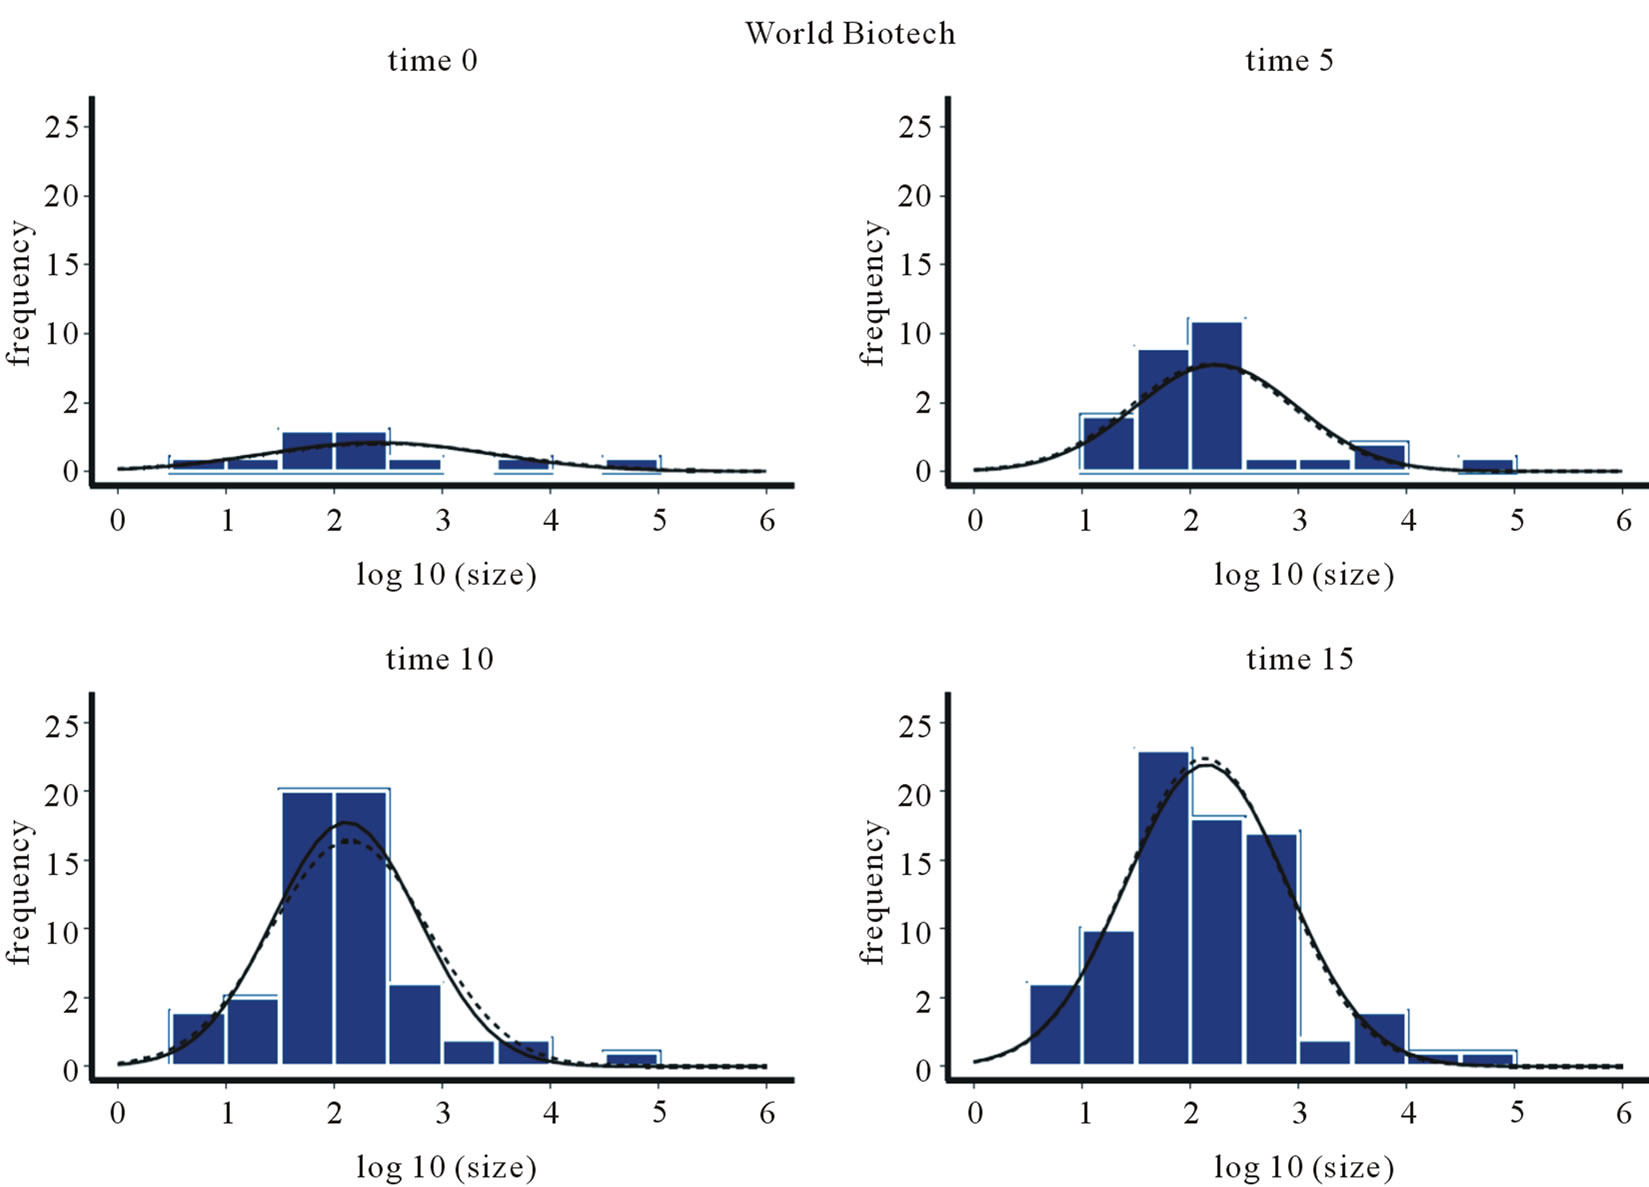
Figure 4. Predicted versus actual distribution.
to new and different situations. The methodology proposed can be fruitfully extended to map industry characteristics on the dynamics of firm structure. Such an extension would demonstrate how information on the shape and time evolution of the size distribution of firms over an extended period of time can be used to make inferences about an underlying process; specifically on which characteristics lead to which kinds of dynamics. Of special interest is whether the learning speed and dynamics are dependent on industry size, stage of growth, and level of competition. Such analysis would have poignant policy implications with respect to competition and trade, as well as the diffusion of knowledge across firms and how this might be impacted by a myriad of government policies with respect to intellectual property. This is important because a good understanding of which kinds of characteristics lead to which kinds of dynamics can help us understand how incentives should be provided for the socially optimal amount of creative activity to take place. From an industrial organization perspective, it would be valuable to estimate the minimum future expected income necessary to attract potential innovators in the biotechnology industry. This becomes even more important when one considers that technological innovation continuously changes the opportunity cost and reservation values of the various stakeholders involved in R & D within the industry.
In general, forces driving the dynamics of firm size distribution are so varied and complex, that a model which allows mapping industry characteristics into dynamics becomes substantive. Given that significant amount of resources are reallocated across firms due to firm level dynamics associated with uncertainty, these questions are important not only for public policy but for investment decision making as well.
6. Acknowledgments
Information on Fick’s law has been quoted from Wikipedia (Fick’s law). Information on previous literature on firm size distributions has been quoted from Luis Cabral and Jose Mata (2003) “On the Evolution of the Firm Size Distribution: Facts and Theory”, American Economic Review 93, 1075. Moreover, the author has benefited from insights offered by Omega statistical consulting regarding the empirical analysis in this paper. Parts of the statistical analysis in this paper likewise appear in Hashemi, F. (2012) Dynamics of Firm Size in Healthcare Industry. Health, 4, 155-164. doi:10.4236/health.2012.43024.
REFERENCES
- Ijiri, Y. and Simon, H.A. (1977) Interpretations of departures from the pareto curve firm-size distributions. Journal of Political Economy, 82, 315-331. doi:10.1086/260194
- Simon, H.A. and Bonini, C.P. (1958) The size distribution of business firms. American Economic Review, 48, 607-617.
- Hopenhayn, H.A. (1992) Entry, exit, and firm dynamics in long run equilibrium. Econometrica, 60, 1127-1150. doi:10.2307/2951541
- Axtel, R. (2001) Zip distribution of US firm sizes. Science, 293, 1818-1820. doi:10.1126/science.1062081
- Lucas, R.E. (1978) On the size-distribution of business firms. Bell Journal of Economics, 9, 508-523. doi:10.2307/3003596
- Segerstrom, P.S. (1991) Innovation, imitation, and economic growth. Journal of Political Economy, 99, 807- 827. doi:10.1086/261779
- Simon, H.A. and Charles P.B. (1958) The size distribution of business firms. American Economic Review, 48, 607-617.
- Sutton, J. (1998) Technology and market structure: Theory and history. MIT Press, Cambridge.
- McCloughan, P. (1995) Modified gibrat growth, entry, exit and concentration development. Journal of Journal of Industrial Economics, 43, 4053.
- Jovanovic, B. (1982) Selection and the evolution of industry. Econometrica, 50, 649-670. doi:10.2307/1912606
- Levine, D. (2011) Neuroeconomics? International Review of Economics, forthcoming. doi:10.1007/s12232-011-0128-7
- Fudenberg, D. and Levine, D. (2009) Learning and equilibrium. Annual Review of Economics, 1, 385-419. doi:10.1146/annurev.economics.050708.142930
- Besson, O. and de Montmollin, G. (2004) Space-time integrated least squares: A time-marching approach. International Journal for Numerical Methods in Fluids, 44, 525-543
- Okubo, A. (1980) Diffusion and ecologyical problem: Mathematical models’. Biomathematics, 10, SpringerVerlag, Berlin.
- Hashemi, F. (2003) A dynamic model of size distribution of firms applied to US biotechnology and trucking industries. Small Business Economics, 21, 27-36. doi:10.1023/A:1024433203253
- Sutton, J. (1997) Gibrat’s legacy. Journal of Economics Literature, 35, 40-59.
- Pfaffermayr, M. (2008) Firm growth under sample selection: Conditional sigma convergence in firm size? Review of Industrial Organization, 31, 303-328. doi:10.1007/s11151-008-9159-y
- Hutchinson, J. Konings, J. and Walsh, P. (2010) The firm size distribution and inter-industry diversification. Review of Industrial Organization, 37, 65-82. doi:10.1007/s11151-010-9260-x
- Hongler, M.-O., Filliger, R. and Blanchard, P. (2006) Soluble Models for Dynamics Driven by a Super-Diffusive Noise. Physica, 370, 301-315. doi:10.1016/j.physa.2006.02.036
- Hongler, M.-O., Soner, H. and Streit, L. (2004) Stochastic control for a class of random evolution models. Applied Mathematics and Optimization, 49, 113-121.
- Hashemi, F. (2000) An evolutionary model of the size distribution of firms. Journal of Evolutionary Economics, 10, 507-521. doi:10.1007/s001910000048
- Taylor, R. (1984) Predation, population and community biology series. Chapmann and Hall, London.
- Ricciardi, L. (1977) Diffusion processes and related topics in biology. Lecture Notes in Biomathematics, SpringerVerlag, Berlin.
- Friedman, M. (1992) Do old fallacies ever die? Journal of Economic Literature, 30, 2129-2132.
- Quah, D. (2003) Empirics for economic growth and convergence, in “The economics of structural change”. Elgar Reference Collection, 3, pp. 174-196.
NOTES
1Reference [15] provides a full analysis of this model albeit in a different context.
2The 197 companies comprise the universe of all firms in the biotechnology industry as reported by Compustat.
3References [19-23] provide an elaboration.