Advances in Bioscience and Biotechnology
Vol.4 No.2(2013), Article ID:28415,13 pages DOI:10.4236/abb.2013.42028
Efficiency of different vaccination strategies for childhood diseases: A simulation study
![]()
1Department of Basic and Applied Science, Unaizah Community College, Qassim University, Unaizah, KSA
2Department of Scientific Computing, Faculty of Computers and Information, Benha University, Benha, Egypt
Email: moneim97@yahoo.com
Received 14 June 2012; revised 15 July 2012; accepted 23 July 2012
Keywords: Simulation; SEIR Model; Periodic Vaccination; Poincaré Filter; Childhood Diseases
ABSTRACT
Vaccination strategies are designed and applied to control or eradicate an infection from the population. This paper studies three different vaccination strategies used worldwide for many infectious diseases including childhood diseases. These strategies are the conventional constant vaccination strategy, the periodic step (pulse) vaccination strategy and finally the mixed vaccination strategy of both the constant and the periodic one. Simulation of the different vaccination programs is conducted using three parameter sets of measles, chickenpox and rubella. The Poincaré section is playing as a filter of our simulation results to show a wide range of possible behavior of our model. Critical vaccination level is been estimated from the results to prevent severe epidemics.
1. INTRODUCTION
Vaccination programs are used as a tool to control the spread of epidemics. The simplest vaccination strategy is to vaccinate all susceptible individuals at a constant rate. This may also be combined with vaccination of a fixed fraction of very young children at the smallest possible age where maternal antibodies no longer confound the effect of the vaccine, commonly 9 - 18 months for measles. In the absence of vaccination, many common childhood diseases show a regular periodic oscillation with period of a whole number of years [1,2]. We ignore the effect of maternal antibodies in this paper, so children are vaccinated from birth. Much work has been done analysing seasonal periodic outbreaks of infectious diseases considering seasonal variation in the contact rate [1-3].
Recently it is well known that in some circumstances a periodic vaccination strategy, for example pulse vaccination, can be a more efficient use of limited immunisation resources than continuous constant vaccination effort [4-6]. In this paper we study a general continuous periodic vaccination strategy ![]() and extend the results of [7]. This is combined with vaccination of a given proportion of newborn individuals. As in many real diseases there is a time delay between an individual becoming infected and becoming infectious we introduced an exposed or latent class into the model. We consider the model both with a periodic disease transmission rate and a constant one.
and extend the results of [7]. This is combined with vaccination of a given proportion of newborn individuals. As in many real diseases there is a time delay between an individual becoming infected and becoming infectious we introduced an exposed or latent class into the model. We consider the model both with a periodic disease transmission rate and a constant one.
If the combined vaccination strategy is applied in the situation where no disease is present, then the number of susceptibles eventually reaches a unique periodic solution. Our results lead us to conjecture that this combined periodic and fixed vaccination strategy is sufficient to eliminate disease from the population exactly when the weighted time-averaged disease-free susceptible population is less than a certain threshold value.
1.1. The Conventional Strategy
The conventional strategy is used to vaccinate a fixed proportion of newborns of whom a proportion p,  are successfully vaccinated. This constant rate strategy reduces the effective total birth rate of susceptible individuals from
  to
to  where
where  is the per capita birth rate and
  is the total population size. So the effect of applying the conventional strategy is to significantly reduce the size of the susceptible population [8].
Study of a simple SIR model with constant vaccination shows that there is disease free equilibrium point
 Examination of the stability of this disease free equilibrium shows that there is a critical level
  of the proportion of susceptibles who are successfully vaccinated given by
where  the basic reproductive number (the number of secondary cases produced by a single infected person entering a population at the disease free equilibrium) is given by
This critical value of p determines the stability of the disease free equilibrium of the the SIR model. The disease free equilibrium is stable if  and unstable when
  To eradicate the infection from the population by applying this constant rate vaccination strategy, it is necessary to keep the susceptible population beneath a certain critical value by vaccinating a large enough proportion p of the susceptibles such that
 . Therefore the herd immunity must exceed a critical level in order for the reproductive number to be reduced to be less than unity in value [9]. Anderson and May [10] found that for parameter values corresponding to measles the critical value of
  approximately. This means that, to eradicate the infection from the population it is necessary to vaccinate at least 95% of newborns immediately after the birth. But it is difficult and expensive to implement a vaccination for a large population with such a large coverage. Also existing measles vaccines are only about 95% efficient. So it is better to try another vaccination strategy to find a way to keep the disease free equilibrium stable with a smaller coverage of vaccination. This new way is the time dependent vaccination strategy.
1.2. The Pulse Vaccination Strategy
Pulse vaccination vaccinates susceptibles at discrete points in time, usually at regular intervals. Many recent works studied epidemic models with pulse vaccination strategy. The pulse vaccination was the main aim of these epidemiological investigations [11-16]. One such example is the use of annual immunisation days which were successful in eradicating measles from Gambia between 1967 and 1972 [17]. In recent times a pulse vaccination strategy has been applied in South and Central America and highly successfully applied to poliomyelitis in the same region [18,19]. This method is now used in Brazil and is both easier to arrange and has a greater uptake than the conventional continuous vaccination strategy. Pulse vaccination has been used in Africa recently albeit with only partial success [6]. Agur et al. [4] discuss the possibility of implementation of the pulse vaccination method in Israel.
Pulse vaccination has also been used in the United Kingdom. In November 1994 a single dose of combined measles and rubella (MR) vaccine was given to children aged 5 to 16 years. In England and Wales an average of 92% of these children were vaccinated. This policy caused a significant fall in the number of cases of measles reported to the Office of Population Censuses and Surveys. It was concluded that application of pulse immunisation to all schoolchildren would probably prevent a large amount of morbidity and mortality and would have a marked effect on measles transmission for several years [5].
Nokes and Swinton [5] use simple steady-state and age-structured dynamic models to extend the theory of the mechanism of action of pulse vaccination, and to explore the relationship between the maximum permitted interval between pulses and key epidemiological, demographic and vaccination variables.
Shulgin et al. [6] studied an SIR model with a pulse vaccination with each pulse at the time t is  where
where  is a constant and
  is the Dirac delta function. They consider a series of pulse vaccinations
 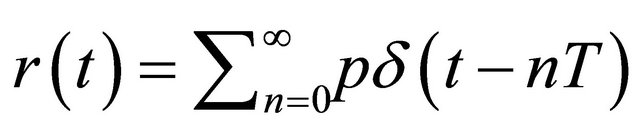 vaccinating a fraction
 ![]() of the susceptibles individuals at times separated by the inter-pulse vaccination period T. They found that an infection free solution is possible and the number of susceptible and recovered populations are periodic functions with period equal to the period of the vaccination pulse.
of the susceptibles individuals at times separated by the inter-pulse vaccination period T. They found that an infection free solution is possible and the number of susceptible and recovered populations are periodic functions with period equal to the period of the vaccination pulse.
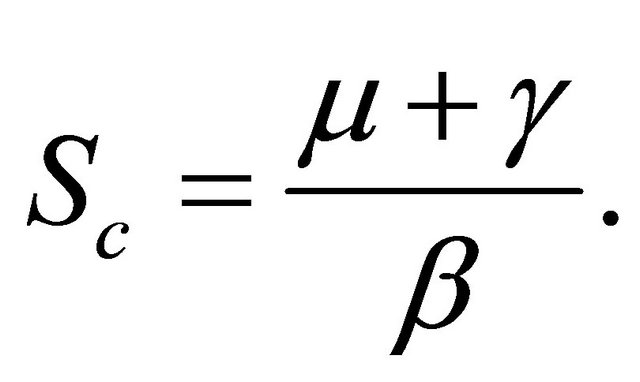
They also found that when the disease transmission rate  is a constant, the disease free periodic solution (DFS) is locally stable if the mean value of the susceptible population, over a single pulse period, is below a certain critical value
They used Floquet theory to examine the stability of the DFS when  is a non-constant periodic function with the same period as
![]() . Floquet theory is a good framework to study the stability of a linear periodic system
. Floquet theory is a good framework to study the stability of a linear periodic system
where  is a periodic matrix such that
  . This framework starts by calculating the monodromy matrix of this system which is the fundamental matrix
  at
at 
Floquet multipliers which are the eigenvalues of the monodromy matrix are the critical parameters which determine the stability of the periodic linear system. If all the Floquet multipliers are less than unity in absolute value the trivial solution of the linear system is stable but if one of them is bigger than unity in absolute value the solution will be unstable [20].
Shulgin et al. [6] found that the necessary condition for all Floquet multiplier to be less than unity in absolute value is that
Here  denotes the number of susceptibles at time
 ![]() for the DFS. This is the condition for local stability of the disease free solution (DFS) and under this condition there is no chance of any severe epidemic to occur.
for the DFS. This is the condition for local stability of the disease free solution (DFS) and under this condition there is no chance of any severe epidemic to occur.
Aron [21] studied an SEIR model with sinusoidal form of seasonal variation in the contact rate and introduced a time dependent vaccination rate  into this model. During this study the vaccination rate
  is taken as a simple step function
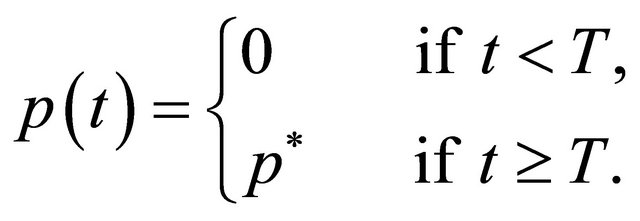
This strategy instantaneously introduces vaccination of a constant proportion  of newborns individuals at time
![]() . She found numerically that periodic endemic solutions coexist for the post-vaccination SEIR model. She also found that the period of the endemic solution depends on the pre-vaccination reproduction number. The vaccination strategy reduces the reproduction number by a factor
. She found numerically that periodic endemic solutions coexist for the post-vaccination SEIR model. She also found that the period of the endemic solution depends on the pre-vaccination reproduction number. The vaccination strategy reduces the reproduction number by a factor  [9] so the post-vaccination reproduction number is
  times the pre-vaccination one.
1.3. The Mixed Vaccination Strategy
Finally in the mixed vaccination policy both the conventional and the vaccination pulse strategies are applied simultaneously. Because the conventional strategy is currently used in many countries world wide, it is useful to combine both the pulse and the conventional strategy to provide a good comparison with the conventional strategy [5]. They also found that applying the mixed strategy allows the system to return back to its equilibrium level faster and with less chance of severe epidemics than the conventional one.
Shulgin et al. [6] also studied this strategy and they found that the optimal pulse interval between the vaccination pulses is a factor  shorter than in the pulse vaccination strategy, where
  is the proportion of susceptibles who are vaccinated at birth. They found also that applying the mixed strategy is better than using only the pulse strategy, as in the mixed strategy the basic reproductive number is a fraction
  of its value in the pulse strategy. Now we shall investigate a more realistic and complicated SEIR model with a general continuous periodic vaccination rate
![]() . Simulating the aggregation of the disease under the effect of different types of vaccination rates is our point of view.
. Simulating the aggregation of the disease under the effect of different types of vaccination rates is our point of view.
2. THE SEIR MODEL WITH VACCINATION
The SEIR model of the spread of infectious diseases makes the following assumptions:
1) The total population size is  and the per capita birth rate is a constant
 . As births balance deaths we must have that the per capita death rate is also
 .
.
2) The population is uniform and mixes homogeneously.
3) The population is divided into susceptible, exposed, infective and recovered individuals. The total number of individuals in each of these classes are respectively  and
and .
.
4) The infection rate  is defined as the total rate at which potentially infectious contacts occur between two individuals. A potentially infectious contact is one which will transmit the disease if one individual is susceptible and the other is infectious, so the total rate at which susceptibles become exposed is
  Biological considerations mean that
  is continuous. We also assume that either (i)
 is not identically zero, positive, non-constant and periodic of period
 ![]() or (ii)
or (ii) is a constant.
5) The susceptibles move from the exposed class to the infective class at a constant rate ![]() where
where  is the average latent period conditional on survival to the end of it.
6) The infectives move from the infective class to the recovered class at a constant rate  where
where  is the average infectious period conditional on survival to the end of it.
7) A fraction ![]()
 of all new-born children are vaccinated. In addition all susceptibles in the population are vaccinated at a time dependent periodic rate
![]() . This is the periodic vaccination strategy. We shall suppose that
. This is the periodic vaccination strategy. We shall suppose that ![]() is periodic with period
is periodic with period  for some integer numbers
 ![]() including
including .
.
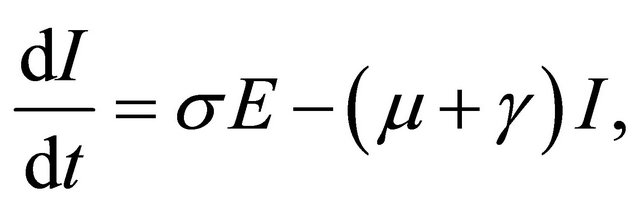
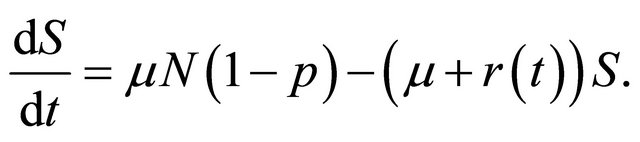
Our SEIR model with time dependent vaccination strategy can be written as a set of four coupled non-linear ordinary differential equations as follows:
 (1)
(1)
 (2)
(2)
 (3)
(3)
and
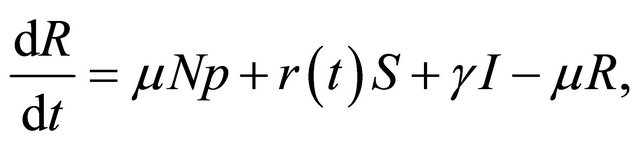 (4)
(4)
with
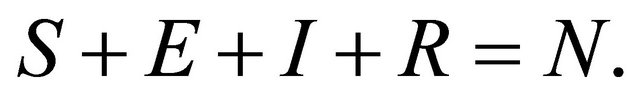 (5)
(5)
Here the disease transmission rate  and the vaccination rate
 ![]() are non-zero, positive, continuous periodic functions. The system (1)-(5) has no equilibrium points but a disease free solution (DFS), with
are non-zero, positive, continuous periodic functions. The system (1)-(5) has no equilibrium points but a disease free solution (DFS), with  is still possible.
Consider the region  in
in  defined by
The system of differential equations (1)-(4) with initial conditions in  obviously starts off in the region
 . The right-hand sides of these equations are differentiable with respect to
  and
and  with continuous derivatives. It is straightforward to show using standard techniques [22] (and considering separately the cases
  and
and  or
or ) that the Equations (1)-(4) with initial conditions in
  have a unique solution that remains in
  for all time and
 .
.
3. THE DISEASE FREE SOLUTION
In the case that ![]() is a non-constant bounded continuous periodic function, there is no equilibrium point for the system (1)-(5). So there is no disease free equilibrium point. But still there is a periodic DFS corresponding to the case that
is a non-constant bounded continuous periodic function, there is no equilibrium point for the system (1)-(5). So there is no disease free equilibrium point. But still there is a periodic DFS corresponding to the case that  In this case (1) becomes
 (6)
(6)
If , (6) has a solution for
  . We shall examine the behaviour of this solution. Integrating (6) we find that
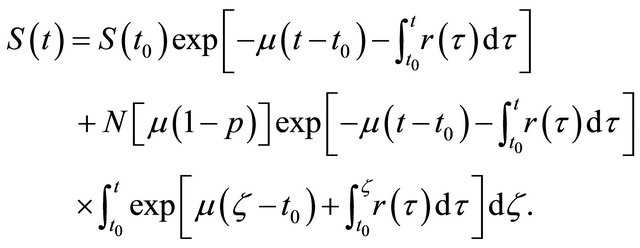 (7)
(7)
Hence
 (8)
(8)
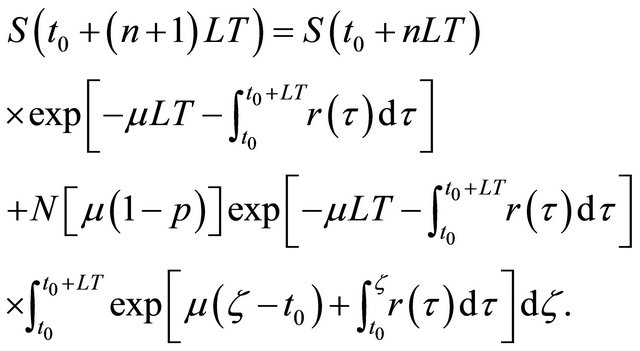
Equation (8) gives a recursive relationship between the number of susceptibles at time 
 If we let
  then (8) defines a mapping
  such that
If  and
and  are different values of
 ![]() then we have that
then we have that
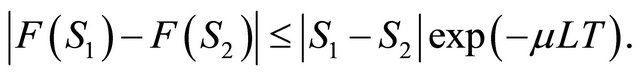
So  is a contraction mapping [23] and has a unique fixed point
  such that
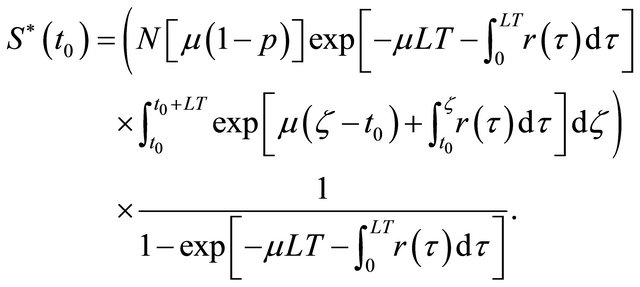 (9)
(9)
Hence  So
So  is a periodic function of
  Differentiating (9)
  is continuously differentiable with respect to
 ![]() and
and 
 and
and  is a disease free periodic solution of the system (1)-(5) which repeats itself every
  years. We have the following result:
Theorem 1. Equations (1)-(5) have a disease free periodic solution of period  which is continuously differentiable and this is the only disease free periodic solution to (1)-(5), and any disease free solution to (1)-(5) approaches this one as time becomes large.
Proof see [24] for the case .
.
Recall that , the basic reproduction number of the disease is defined as the expected number of secondary cases caused by a single infected case entering the disease-free population at equilibrium [10]. Anderson and May [10] call this the basic reproduction rate, but it is a number not a rate. Consider a single newly infected person entering the population at the DFS. During the latent period this person suffers a death rate
  and leaves for the infectious class at rate
![]() . Assuming that the time taken for these two events to happen follow independent exponential distributions the probability that the individual survives his or her incubation period is
. Assuming that the time taken for these two events to happen follow independent exponential distributions the probability that the individual survives his or her incubation period is . Similarly the average length of the infectious period is
 . The average value taken over a cycle of the expected number of secondary cases produced by a single infected person entering the population at the DFS is our conjectured value for
 , namely
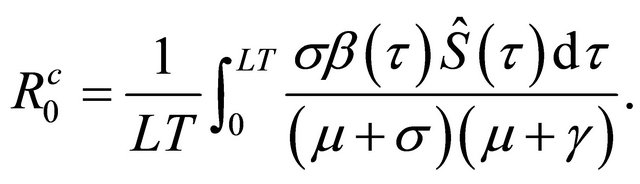 (10)
(10)
Define
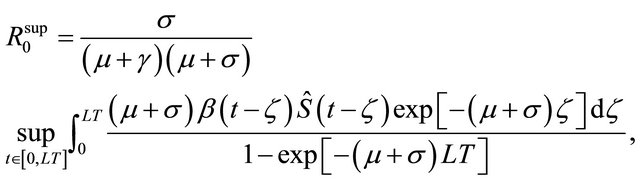 (11)
(11)
and
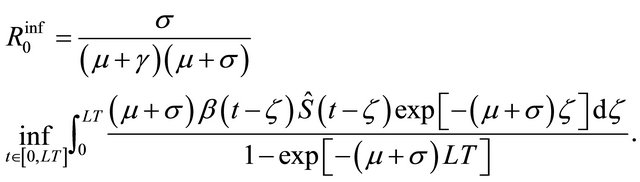 (12)
(12)
It is proved that 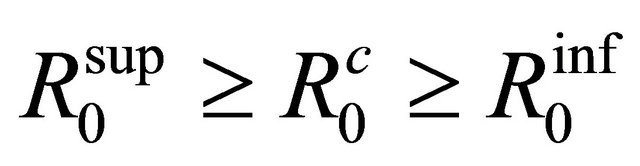 with both of the inequalities being strict if
  is non-constant on
  [22]. We expect that if
  the disease will take off whereas if
  the disease will die out. However we have been able to show only the result that if
  the disease will die out and if
  then the disease will take off if it is initially present. In the following sections we shall formally investigate these results [22].
4. THE SIMULATION
In this paper the simulations of the SEIR model with three different vaccination strategies have been conducted using the XPPAUT package and data estimated from the literature. Parameter values corresponding to the childhood diseases of measles, chickenpox and rubella have been used.
A constant population size of  has been considered. We also supposed that
  corresponding to an average human lifetime of 50 years [2,21]. We chose this value to be consistent with previous studies even though the actual value of the average lifetime in many countries is higher. For example the average lifetime in the UK is around
  years. We do not feel that this will have much effect on the results of our simulations as we are mainly considering childhood diseases and the proportion of individuals who catch the disease at 50 years or later is negligible. Mainly the following specific values of
  and
and  have been taken as in [3,10,25-27] for our models:
1) Measles:  and
and ;
;
2) Chickenpox: and
and ;
;
3) Rubella:  and
and .
.
We have taken also  as estimated from the literature, for our simulations results for all of the bifurcation diagrams presented and for the three diseases under investigation as follows:
  for measles,
  for chickenpox and
  for rubella respectively.
The key parameter in the analytical results was the basic reproduction number  [22,24]. So the computer simulations of our models were performed using values of
  to insure that the disease is in the endemic state. The values of
  were determined by the value of
  the mean level of the disease transmission function, and
  which determines the amplitude parameter of the periodic transmission rate
This paper targeted the long term behaviour of the system in response to changes in the vaccination parameter, (the value the vaccination rate of the conventional strategy, the amplitude of the vaccination function of both the pulse and the mixed one), which is our bifurcation parameter. The basic idea of this study is simply that, given a set of parameter values compound with appropriate initial values then the endemic equilibrium solution is obtained by running the system for a long time to eliminate transient solutions. Filtering the equilibrium solutions by looking at Poincaré sections of them taken every year (recall that the underlying seasonal variation in the contact rate has period one year). So in this paper the vaccination parameter is used as a filter of the long term equilibrium solution. By plotting the sections of the long term endemic equilibrium solutions against the vaccination parameter we obtain a number of points in a vertical line corresponding to each value chosen for the vaccination parameter. These points on the filter, represent the period of the stable long term periodic solution of our model. For example a single point indicates a solution of period one year, two points a solution of period two years, ![]() points a solution of period
points a solution of period ![]() years and an infinite number of points a chaotic solution. In the following simulation results which represent global bifurcation diagrams for SEIR model with vaccination using our filter are given. We say global because the filter described above is used to plot the bifurcation diagrams for a large range of values of the vaccination parameter. The comparison of the simulation results of our model show that the type of vaccination parameter affecting the pattern of the dynamics of the disease. The pattern of the mixed vaccination is the simplest pattern and the most controllable one.
years and an infinite number of points a chaotic solution. In the following simulation results which represent global bifurcation diagrams for SEIR model with vaccination using our filter are given. We say global because the filter described above is used to plot the bifurcation diagrams for a large range of values of the vaccination parameter. The comparison of the simulation results of our model show that the type of vaccination parameter affecting the pattern of the dynamics of the disease. The pattern of the mixed vaccination is the simplest pattern and the most controllable one.
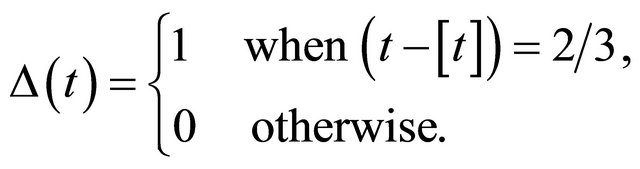
This paper looked at bifurcation diagrams for three different vaccination functions one of which is the constant strategy. These three vaccination programs are applied for the SEIR model with the seasonally periodic transmission function the more realistic reparameterised step function as,  , with mean value
 , of period one year [22,24], where
and  is the largest integer number less than
Our three different vaccination strategies are of the following forms:
1) The constant vaccination function  to vaccinate the newborns as many as possible all the time.
2) The periodic binary step vaccination function  with period one year to vaccinate the susceptible population
 , where
3) The mixed vaccination strategy which is composed of the periodic function , combined with the constant vaccination one
  In all of our simulations we have taken
 .
.
The simulation study is been designed to start off just before school opening days. It means that the disease transmission rate is at its highest value. Therefore at this critical moment we start our vaccination to control the disease dynamics or possibly prevent severe epidemics to occur. We simulate our model with the three different vaccination strategies under consideration by varying the vaccination parameter  from
from  to
to  in value. Then plotting the long term solution against the vaccination parameter to have wide range of possible behaviour of the disease under consideration. From the obtained patterns we can decide easily which vaccination strategy is more effective than the others.
We start off our simulation with the most studied disease, measles, with the three different vaccination strategies under consideration. Figure 1(a) represents the bifurcation diagram of measles when the vaccination strategy is the convectional constant one. This pattern shows that at low level of vaccination rate measles have long period solutions, these solution tend to chaos behaviour by a series of period doubling. This complicated pattern is interrupted by six, ten and twelve years periodic solutions. Increasing the value of  we obtained a region of long period or aperiodic solutions until
  reaches the value
  approximately then a long period, 20 years or more, periodic solution appears up to the value
 . Increasing the value of
  slightly again a one year periodic solution appears and persists to decrease and tends to its limiting value at the end of range. These results agree with the previous results [4,10] which predict that, the effective value of
  of the conventional constant vaccination strategy should exceed 0.95 in value. In other words the percentage of the number of vaccinated newborns should exceed 95% to prevent severe epidemics to occur. This proportion of newborns is very difficult to be vaccinated for different reasons [22].
Figure 1(b) represents the bifurcation diagram of measles when the vaccination parameter is the amplitude of the periodic step function . This pattern start off by long period periodic solution at low values of the amplitude of the vaccination function. Increasing the value of
  aperiodic solutions interrupted with long period solutions appear until the value of the amplitude reaches the value 0.3. Unlike the conventional vaccination strategy, increasing the amplitude slightly a three years periodic solution is obtained followed by a one year periodic solution which persists until the value of
  becomes 0.5 in value. This one year periodic solution is interrupted with a long period periodic solution. Increasing the value of
  more the one year periodic solution persists but decreases to its limiting value as the
  tends to the end of its range. It is important to note that, the step periodic vaccination forces the behavior of the system to be simply more than the conventional one. and the control of the dynamics of the disease is possible for a lower values of
  compared with the conventional strategy.
Figure 1(c) represents the corresponding bifurcation diagram of measles when the vaccination strategy is the mixed strategy and amplitude  of the periodic step function
  is vaccination parameter. In this vaccination strategy there is another proportion of vaccinated newborns, this proportion is been taken as
 . This pattern starts with a band of long period periodic solutions followed by six years periodic solutions then a one year periodic solutions interrupted with long period periodic solutions. When the value of
  exceeds 0.2 a one year periodic solution appears and persists until the of
  reaches 0.5 in value. Increasing the value
  further the one year periodic solution decreases monotonically to its limiting value as the amplitude parameter tends to its end of range. It is important to note that the level of susceptible population is half the value of the corresponding value of the susceptible population when the vaccination strategy is the step periodic one only. This result is expected and obtained in several previous works. The most important result here and it seems to be a novel result is the simple pattern of measles with the mixed vaccination strategy. This patterns shows disappearance of very long period solutions and the pattern does not contain any chaotic behaviour.
Therefore we can claim that the mixed vaccination strategy is the most effective policy to control measles disease. Moreover using this mixed vaccination strategy reduces the number of the susceptibles in the system by a fraction ![]() which is the rate at which the newborns are vaccinated.
which is the rate at which the newborns are vaccinated.
Figure 2(a) represents the bifurcation diagram of chickenpox with the vaccination strategy. Similar to measles this pattern shows that at the conventional vaccination strategy can not eradicate nor control the disease until the vaccinated proportion of the newborns exceeds the value of 0.95. This pattern contains different bands of periodic solutions and long period possibly aperiodic solutions until the constant vaccination rate . Therefore when the rate
  exceeds the value 0.95, the number of susceptibles start to fall down monotonically. In other words the percentage of the number of vacci-
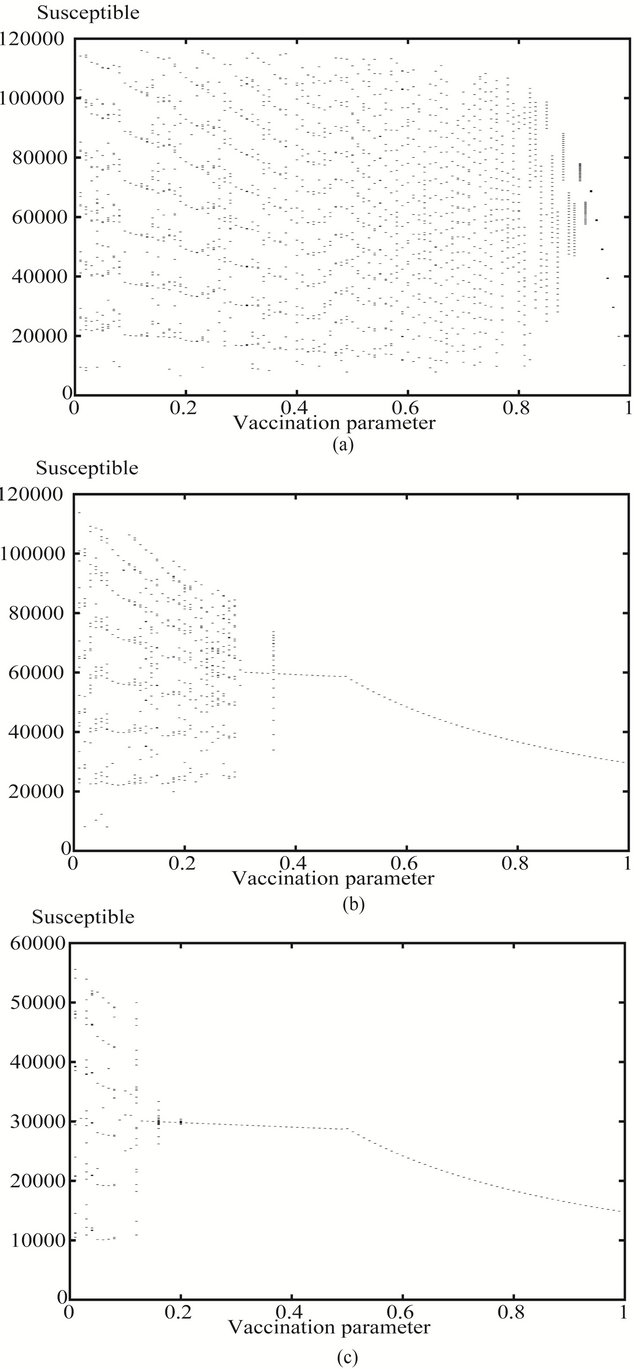
Figure 1. The bifurcation diagrams of measles parameter values of number of susceptibles against vaccination parameter (a) the values of p1 of the convection constant vaccination strategy P(t) = p1; (b) the amplitude p1 of the non constant periodic vaccination function p(t) = p1 ± (t) and (c) the amplitude p1 of the mixed vaccination strategy of both the constant and periodic step one.
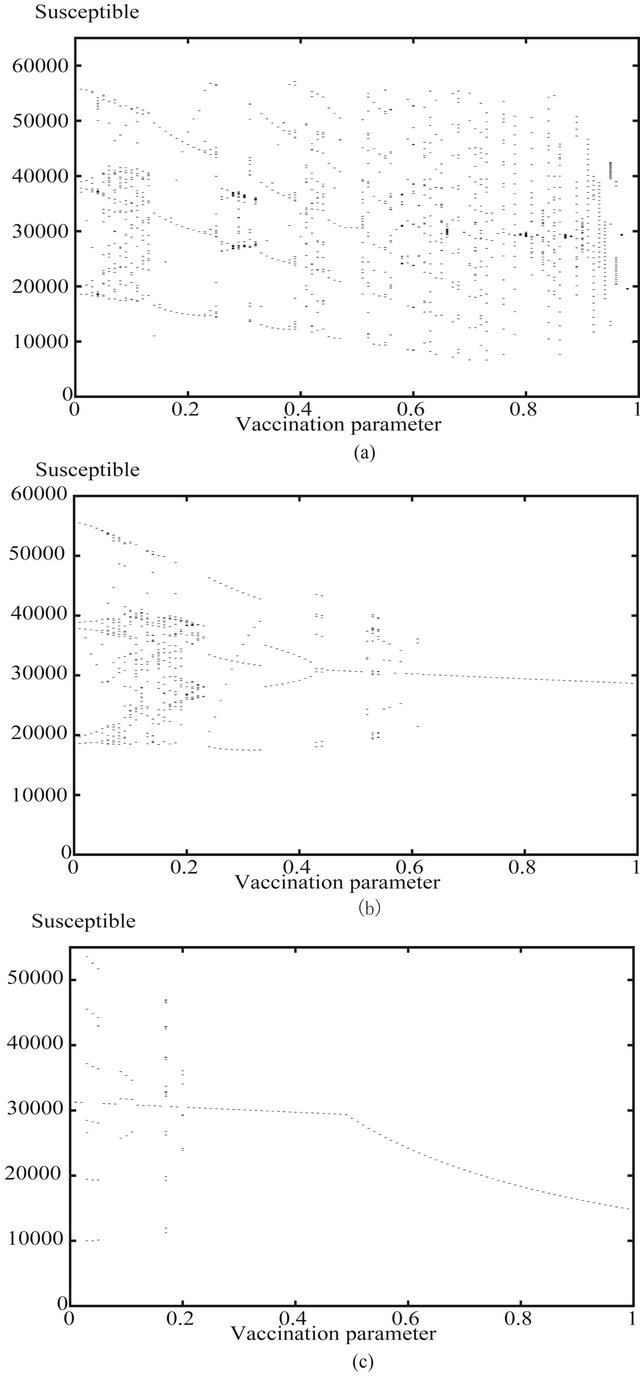
Figure 2. The bifurcation diagrams of chickenpox parameter values of number of susceptibles against vaccination parameter (a) the values of p1 of the conventional constant vaccination strategy P(t) = p1; (b) the amplitude p1 of the non constant periodic vaccination function p(t) = p1 ± (t) and (c) the amplitude p1 of the mixed vaccination strategy of both the constant and periodic step one.
nated newborns should exceed 95% to prevent severe epidemics to occur. This proportion of newborns is very difficult to be vaccinated for different reasons [22].
Figure 2(b) represents the bifurcation diagram of chickenpox when the vaccination is the periodic step function . This pattern start off by six year periodic solution then followed by a series of period doubling to a band of long period periodic solution. Increasing the vaccination parameter a band four years periodic solution appears followed by two years periodic solutions then eight years periodic solutions appear which is terminated into a one year periodic solutions. Increasing the value of the vaccination parameter more a band of long period periodic solutions appears followed by a three years periodic solution which is interrupted by a one year periodic solution until the value of
  reaches the value 0.6. Increasing the value
  again a one year periodic solution appears and decreases slowly to its limit as
  tends to one. Similar to measles disease, the pattern corresponding to the step periodic vaccination is more simple than the conventional one. Also when
  exceeds the value 0.6 there is only a one year band of solution which is easy to control at lower values of
  compared with the conventional strategy.
Figure 2(c) represents the corresponding bifurcation diagram of chickenpox when the vaccination strategy is the mixed strategy. This patterns starts with a one year periodic solution followed by a seven years periodic solution then a one year periodic solution switched into a three years periodic solution. Increasing the amplitude farther another band of one year periodic solution is obtained and interrupted with a sixteen and a six years periodic solutions. This one year periodic solution persists until the amplitude  reaches 0.5 in value. Increasing the value the vaccination parameter slightly the one year periodic solution starts to decrease monotonically to reach half the value of the limiting value of susceptibles when the step vaccination strategy is applied only as p1 tends to one in value. Similar to measles disease, the pattern of chickenpox with the mixed vaccination strategy shows neither long period solutions nor any chaotic behaviour.
Figure 3(a) represents the bifurcation diagram of rubella with the vaccination strategy. Similar to measles this pattern shows that using the conventional vaccination strategy can not eradicate nor control the disease until the vaccinated proportion of the newborns exceeds the value of 0.95. This pattern contains different bands of periodic solutions and long period possibly aperiodic solutions until the constant vaccination rate . Therefore when the rate
  exceeds the value 0.95, the number of susceptibles starts to fall down monotonically. In other words the percentage of the number of vaccinated newborns should exceed 95% to prevent severe epidemics to occur. This proportion of newborns is very difficult to be achieved for many different reasons [22].
Figure 3(b) represents the bifurcation diagram of rubella when the vaccination is the periodic step function . This pattern starts off by three years periodic solution then followed by a band of four years periodic solutions then six years periodic solution appears. Increasing the vaccination parameter slightly two years periodic solutions appears followed by eight years periodic solutions then to another two years periodic solution for the second time. Increasing the value of the vaccination parameter more another band of six years periodic solutions appears again followed by a one year periodic solution at the midway of the vaccination range. Unlike the pattern of the constant vaccination strategy, increasing the vaccination parameter again a band of four years periodic solution continues to appear until the value of vaccination parameter reaches the value 0.6. Increasing the value
  again a one year periodic solution appears and persists to the limiting value of
 . Similar to measles disease, the pattern corresponding to the step periodic vaccination is simpler than the conventional one. Also when
  exceeds the value 0.6 there is only a one year band of solution which is easy to control at lower values of
  compared with the conventional strategy.
Figure 3(c) represents the corresponding bifurcation diagram of rubella when the vaccination strategy is the mixed strategy. This patterns starts with a band of long period periodic solutions or aperiodic solutions corresponding to very low values of the amplitude parameter followed by a band of three years periodic solution then a one year periodic solution switched suddenly into a five years periodic solution and return back to one year periodic solution again which persists until the amplitude becomes 0.5 in value. Increasing the value of the vaccination parameter slightly this one year periodic solution starts to decrease monotonically to approach half the corresponding value of susceptibles when the step vaccination strategy is applied only as the  tends to one in value. Similar to measles and chickenpox diseases, the pattern of rubella with the mixed vaccination strategy shows the simplest behaviour.
5. SUMMARY AND DISCUSSION
It is important to simulate our model with exposed or latent class and with different vaccination strategy, to evaluate which strategy is more efficient. We have simulated the control of the dynamics of three childhood infectious disease by using three different types of vaccination strategies. We perform these simulations for an SEIR model with a seasonally varying disease transmission rate. Using a periodic vaccination strategy in such an SEIR model seems to lead to periodicity in the disease dynamics [22]. In this paper we try to control or
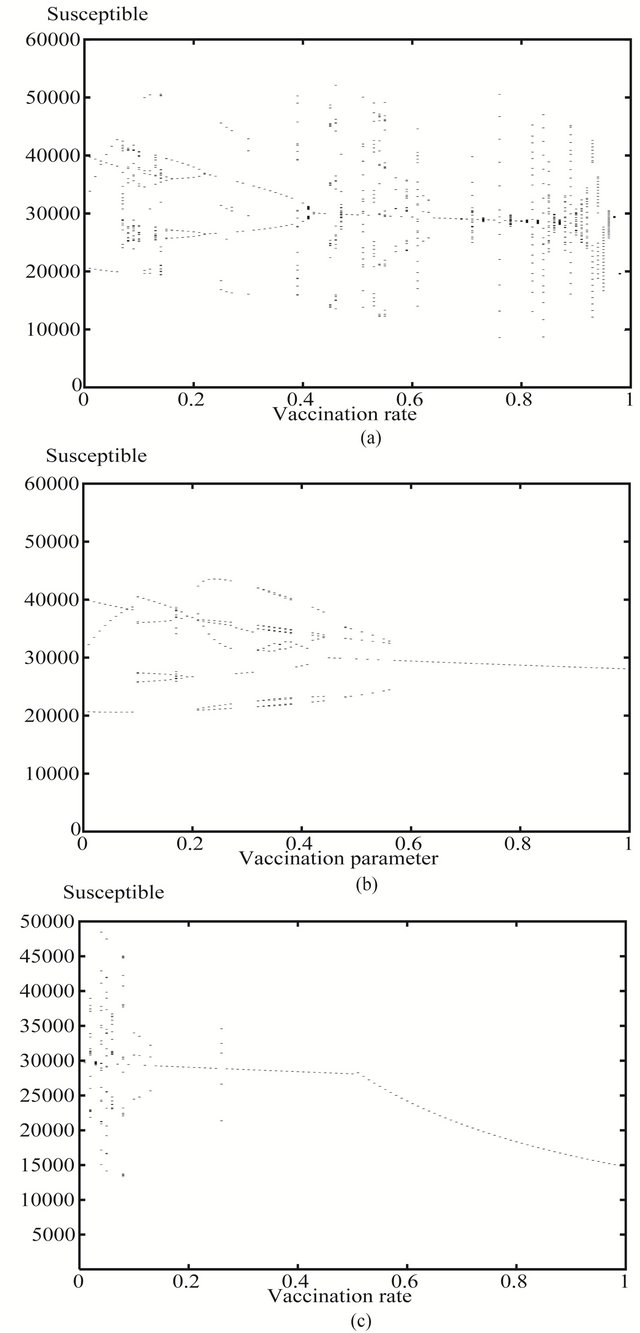
Figure 3. The bifurcation diagrams of rubella parameter values of number of susceptibles against vaccination parameter (a) the values of p1 of the convectional constant vaccination strategy P(t) = p1; (b) the amplitude p1 of the non constant periodic vaccination function p(t) = p1 ± (t) and (c) the amplitude p1 of the mixed vaccination strategy of both the constant and periodic step one.
possibly eradicate diseases by applying the most efficient vaccination strategy. Efficiency means sometimes fewer number of vaccinated individuals leads to perfect control of the disease. This work can be summarised as follows: In Section 1 a short introduction to common practically used vaccination strategies was given. Section 2 outlined the SEIR model which we studied and gave the assumptions formulating the model. Section 3 addressed the results of the previous work by [22,28] which showed that there is a unique DFS for our SEIR epidemic model and this solution is periodic with period equal to that of the vaccination function. Also a conjectured expression for , the basic reproduction number of the disease, is given when the vaccination campaign
 ![]() is used. Lower and upper bounds,
is used. Lower and upper bounds,  and
and  respectively, for this expression were also defined. In this section the stability of the DFS of our model is stated. We found that the DFS was GAS when
  and in this case the infection will ultimately fade out of the population [22, 28].
Section 4 comprises the computer simulations model for different infectious diseases including measles. The simulation results presented in this paper were conducted when the basic reproduction number  However we tried to simulate our model with a seasonal variations in the incidence of childhood infectious diseases due to the opening and closing of schools using our suggested reparameterised periodic step function
  . Also we use a periodic step vaccination strategy that starts to give the susceptibles a pulse of vaccine at the opening of schools, using the vaccination function
 . These new results for this periodic contact rate
  in combination with the vaccination strategy
 , are totally original for any set of parameter values of childhood infectious diseases.
For a highly infectious disease such as measles, using vaccination at birth only, approximately 91% - 94% of newborn individuals must be vaccinated to guarantee elimination of the disease [10]. It is hard to achieve this level of vaccination coverage, particularly bearing in mind that measles vaccine efficacy is only around 95%, that some individuals may be difficult for the health services to locate and others may refuse vaccination for various other reasons. Using a continuous periodic vaccination strategy in conjunction with vaccination of a fixed proportion of newborn individuals, reduces the proportion of newborns who need to be immunised to a more realistic level. Moreover from (9) one can see easily that using such a mixed vaccination strategy uniformly reduces the level of fluctuation of susceptibles in the DFS compared with a purely periodic vaccination function . Hence it is more optimal to use a combined vaccination approach in order to prevent major outbreaks of infectious disease occurring.
We conjectured that to control or eradicate the disease it was both necessary and sufficient to keep the mean value of the product of the disease transmission rate and the susceptible population at the DFS beneath a critical threshold value. If this is true then it is possible for a few individuals to be vaccinated, provided only that the weighted mean value of the number of susceptibles at the DFS over the period of the vaccination function does not exceed the threshold value, the disease will still be eradicated. This contrasts with the strategy of constant vaccination where a critical fixed level of immunisation effort must always be applied to guarantee eradication, and this is an advantage of a periodic vaccination strategy over a constant one.
However the simulation results have indicated that using different functional forms of vaccination strategies generates different patterns of solutions for each disease parameter. The bifurcation diagrams show that the simplest patterns are those of the mixed vaccination strategy. Apart from some of the results these diagrams show a one year solution for the whole diagram except the first quarter of range of the vaccination parameter. The most complicated diagrams are those of the constant vaccination parameter which show a wide range of periodic and aperiodic solutions all over there patterns for all of the three diseases.
It is interesting to note the difference between the bifurcation diagrams in the case of using a periodic pulse vaccination function and the constant conventional vaccination strategy for all of the three diseases, (measles, chickenpox and rubella) studied. The bifurcation diagram for the periodic step vaccination shows that the disease reaches the DFS at a vaccination level of less than 60% of the total number of the susceptible population. On the other hand the constant vaccination strategy failed to control the disease before the vaccination rate exceeds 95%.
Finally it is important to note the difference between the bifurcation diagrams, when using the periodic pulse vaccination function and using the mixed vaccination strategy for all of the three diseases under investigation. The patterns show that, the level of vaccinated population at which the disease starts to be controlled, in the case of using the mixed vaccination strategy is much fewer than that of the only periodic vaccination strategy. The diagrams show that, the effective vaccination parameter p1 in the case of the mixed vaccination is about a third of the that of the only periodic pulse vaccination strategy for all of the three diseases. Using a continuous periodic vaccination strategy in conjunction with vaccination of a fixed proportion of newborn individuals, reduces the proportion of newborns who need to be immunised to a more realistic level. Moreover from (9) one can see easily that using such a mixed vaccination strategy uniformly reduces the level of fluctuation of susceptible in the DFS compared with a purely periodic vaccination function . This agrees with our simulation results. As the diagrams show that at the end of range of the vaccination parameter, the number of susceptible population in the system when the mixed vaccination strategy is used, is approximately half its corresponding number of susceptible population in the system when the purely periodic vaccination strategy is used. Hence it is more optimal to use a combined vaccination approach in order to prevent major outbreaks of infectious disease occurring.
REFERENCES
- London, W.P. and Yorke, J.A. (1973) Recurrent outbreaks of measles, chickenpox and mumps. I. American Journal of Epidemiology, 98, 453-468.
- Schwartz, I.B. and Smith, H.L. (1983) Infinite subharmonic bifurcations in an SEIR model. Journal of Mathematical Biology, 18, 233-253. doi:10.1007/BF00276090
- Dietz, K. (1976) The incidence of infectious diseases under the influence of seasonal fluctuations. In: Berger, J., Bühler, W., Repges, R. and Tautu, P., Eds., Lecture Notes in Biomathematics, Springer-Verlag, Berlin, 1-15.
- Agur, Z., Cojocaru, L., Mazor, G., Anderson, R.M. and Danon, Y. (1993) Pulse mass measles vaccination across age cohorts. Proceedings of the National Academy of Sciences USA, 90, 11698-11702. doi:10.1073/pnas.90.24.11698
- Nokes, D. and Swinton, J. (1995) The control of childhood viral infections by pulse vaccination. IMA Journal of Mathematics Applied in Medicine and Biology, 12, 29- 53. doi:10.1093/imammb/12.1.29
- Shulgin, B., Stone, L. and Agur, Z. (1998) Pulse vaccination strategy in the SIR epidemic model. Bulletin of Mathematical Biology, 60, 1123-1148. doi:10.1016/S0092-8240(98)90005-2
- Moneim, I.A. (2011) Different vaccination strategies for measles diseases: A simulation study. Journal of Informatics and Mathematical Sciences, 3, 227-236.
- Schenzle, D. (1984) An age-structured model of preand post-vaccination measles transmission. IMA Journal of Mathematics Applied in Medicine and Biology, 1, 169- 191. doi:10.1093/imammb/1.2.169
- Anderson, R.M. and May, R.M. (1983) Vaccination against rubella and measles: Quantitative investigations of different policies. The Journal of Hygiene, 90, 259-325. doi:10.1017/S002217240002893X
- Anderson, R.M. and May, R.M. (1995) Infectious diseases of humans: Dynamics and control. Oxford University Press, Oxford.
- Gao, S., Chen, L. and Teng, Z. (2007) Impulse vaccination of an SEIR epidemic model with time delay and varying total population size. Bulletin of Mathematical Biology, 69, 731-745. doi:10.1007/s11538-006-9149-x
- Gao, S., Chen, L., Nieto, J.J. and Torres, A. (2006) Analysis of delayed epidemic model with pulse vaccination and saturation incidence. Vaccine, 24, 6037-6045. doi:10.1016/j.vaccine.2006.05.018
- D’Onofrio, A. (2002a) Stability properties of pulse vaccination strategy in SEIR epidemic model. Mathematical Biosciences, 36, 57-72. doi:10.1016/S0025-5564(02)00095-0
- D’Onofrio, A. (2002b) Pulse vaccination strategy in the SIR epidemic model: Global asymptotic stable eradication in presence of vaccine failures. Mathematical and Computer Modelling, 36, 473-489. doi:10.1016/S0895-7177(02)00177-2
- Zhang, T.L. and Teng, Z.D. (2009) Extinction and permanence for a pulse vaccination delayed SEIR epidemic model. Chaos, Solitons & Fractals, 39, 2411-2425. doi:10.1016/j.chaos.2007.07.012
- Zeng, G., Chen, L. and Sun, L. (2006) Existence of periodic solution of order one of planar impulsive autonomous system. Journal of Computational and Applied Mathematics, 186, 466-481. doi:10.1016/j.cam.2005.03.003
- Williams, P.J. and Hull, H.F. (1983) Status of measles in the Gambia, 1981. Reviews of Infectious Diseases, 5, 391- 394. doi:10.1093/clinids/5.3.391
- De Quadros, C.A., Andrus J.K. and Olivé, J.M. (1991) Eradication of poliomyelitis: Progress. Pediatric Infectious Disease Journal, 10, 222-229. doi:10.1097/00006454-199103000-00011
- Sabin, A.B. (1991) Measles, killer of millions in developing countries: Strategies of elimination and continuing control. European Journal of Epidemiology, 7, 1-22. doi:10.1007/BF00221337
- Iooss, G. and Joseph, D. (1980) Elementary stablility and bifurcation theory. Springer-Verlag, New York. doi:10.1007/978-1-4684-9336-8
- Aron, J.L. (1990) Multiple attractors in the response to a vaccination program. Theoretical Population Biology, 38, 58-67. doi:10.1016/0040-5809(90)90003-E
- Moneim, I.A. (2005) Use of a periodic vaccination strategy to control the spread of epidemics with seasonally varying contact rate. Mathematical Bioscience and Engineering, 2, 591-611. doi:10.3934/mbe.2005.2.591
- Burton, T.A. (1985) Stablility and periodic solutions of ordinary and functional differential equations. Academic Press, New York.
- Moneim, I.A. (2007a) Seasonally varying epidemics with and without latent period: A comparative simulation study. Mathematical Medicine and Biology, A Journal of the IMA, 24, 1-15.
- Hethcote, H.W. (1989) Three basic epidemiological models. In: Gross, L., Hallam, T.G. and Levin, S.A., Eds., Applied Mathematical Ecology, Springer-Verlag, New York, 119-144. doi:10.1007/978-3-642-61317-3_5
- Duncan, C.J., Duncan S.R. and Scott, R. (1997) The dynamics of measles epidemics. Theoretical Population Biology, 52, 155-163. doi:10.1006/tpbi.1997.1326
- Greenhalgh, D. (1990) Deterministic models for common childhood diseases. International Journal of Systems Science, 21, 1-20. doi:10.1080/00207729008910344
- Moneim, I.A. (2007b) The effect of using different types of contact rate. Computers in Biology and Medicine, 2, 591-611.