Modern Economy
Vol.4 No.12(2013), Article ID:41311,14 pages DOI:10.4236/me.2013.412091
The Impact of Economic Growth and Tax Reform on Tax Revenue and Structure: Evidence from China Experience
1Department of Public Finance, School of Public Finance, Central University of Finance and Economics, Beijing, China
2Department of Economics, School of Columbia Arts and Sciences, The George Washington University, Washington, USA
Email: zengkanghua2007@126.com, zydexixi@126.com, coral2009cufe@gmail.com
Copyright © 2013 Kanghua Zeng et al. This is an open access article distributed under the Creative Commons Attribution License, which permits unrestricted use, distribution, and reproduction in any medium, provided the original work is properly cited. In accordance of the Creative Commons Attribution License all Copyrights © 2013 are reserved for SCIRP and the owner of the intellectual property Kanghua Zeng et al. All Copyright © 2013 are guarded by law and by SCIRP as a guardian.
Received July 17, 2013; revised August 17, 2013; accepted August 24, 2013
Keywords: Economic Growth; Tax Reform; Total Tax Revenue and Structure
ABSTRACT
This paper aims to study the mechanism of how economic growth and tax reform affect total tax revenue and structure over the period (1950-2011). On the basis of the introduction of China’s previous main measures in tax reform, this paper uses methods as descriptive statistics, multi-segment linear regression model and principal component analysis to analyze how economic growth and tax reform affect the total tax revenue and structure mainly from three aspects as the total amount of the tax, the value-added tax and the corporate income tax, which are under the background of tax reform. The empirical results show that economic growth not only has a significant impact on the total tax revenue and structure changes, but also has a long-term stability relationship with total tax revenue. And in a long term, there is no extraordinary growth of tax revenue. In addition, every tax reform shows a clear impact on the tax structure, while the impact of changes in the total tax revenue is diminishing over time.
1. Introduction
From the year 1950 to 2011, China had mainly experienced seven tax reforms respectively in 1953, 1958, 1973, 1980, 1983, 1984 and 1994 (actually, the number of China’s tax reforms during this period is more than seven, but these seven reforms on which this paper focuses are the most leading ones), and then current complex tax system which is mainly composed by value-added tax and enterprise income tax is formed. If dividing the evolution of the China’s tax system into three periods, the first period is from China when establishing a unified national tax system in 1950 to the reform and opening up in 1979. During this period, China experienced three large tax reforms respectively in 1953, 1958 and 1973 whose general guiding principle is to simplify the tax system and further weaken the tax functions. The second period is from 1980 to 1993, during which China’s tax system experienced the establishment of “PRC Individual Income Tax” and “The People’s Republic of China Sino-foreign joint venture enterprise income tax” in 1980, and the first step of “Tax for Profits” in 1983 as well as the second step in 1984. Then, a complex tax system was established in China’s transition period. And the third period is from 1994 to the present, during which the 1994 tax reform is the most profound one in New China’s tax reform history. And the tax reforms after that were all making adjustments and improvements continuously based on that and didn’t change the basic framework of today’s tax system. How to evaluate the seven tax reforms in an economic sense? What are the impacts of tax reform on the total amount of tax and structural changes? And how does it affect the relationship between taxation and economy? Researches on these issues prove helpful for mechanism of how economic growth and tax reform affect total tax revenue and structure, and provide empirical test for how tax reform promotes economic growth and affects tax amount and structure. Based on the thinking above, the purpose of this paper is to study how the tax amount and structure were affected by the economic growth and tax reform in the seven tax reforms after the tax system was established in 1950 which was right after the founding of new China. The rest of this paper is organized as follows: The second section is a review of related recent literature; the third section is the study methods and data; and empirical analysis and some conclusions are in the fourth and fifth sections respectively.
2. Review of Related Recent Literature
Before conducting researches on these issues, it is necessary to summarize other researches’ work on tax revenue, taxation and economic growth simply and generally. From the past 10 years Chinese researches have lunched many studies on the relationship between tax revenue and economic empirically [1]. A research report (2003) from China State Administration of Taxation Research Institute says that: economic growth and price level have the most direct and significant effects on the increase in tax revenue, and the impact of price level on the tax revenue growth is greater than the impact of GDP; under normal conditions, the tax revenue growth should keep pace with economic growth, basically, the resilient of tax revenue to economic growth reasonably should range between 0.8 - 1.2 [2]. Qingwang Guo and Bingyang Lv (2004) analysis the tax output—capital ratio, the rate of GDP growth and macroand marginal tax rates between macroscopic in China as a whole as well as the eastern, central and western regions by constructing two-variable intercept fixed effect model, the empirical conclusion is that excessive growth of the tax brings serious negative effects on economic growth. From the national perspective, the marginal macro tax rate increase of 1% cause fell of 0.027 percent on economic growth; excessive growth of tax revenue level cause reduction of output per unit capital, revenue growth in Midwest causes more negative impacts on economic growth than the eastern region [3]. Guangjun Fu (2005) made the co-integration test on the relationship between tax revenues and GDP in China with data from 1986 to 2003 as a sample, and validate cointegrated exists between them [4]. Xiaofang Li, Tiemei Gao, Yunfang Liang (2005) build SVAR model on government spending, real GDP and tax revenue to study the dynamic effects of taxation and government expenditure policies on output. Also through the establishment of four variables SVAR model to study the impact on investment, consumption and export government from spending and taxation ,the empirical conclusion is: the government expenditure has a positive relationship with outputs, tax increase have a negative impact on consumption; government expenditures promote consumption. Tax increase harms investment, while the expansion of government expenditure promotes investment [5]. Jin Ge (2010) puts economic growth and the optimal tax model from Chamley (1986) as in [6] and economic growth and the optimal model of public expenditure from Barro (1990) as in [7] to be integrated, discussed achieved path under the framework of optimal financial expenditure and optimal taxation in endogenous economic growth theoretically, thereby obtain a general analysis framework on economic growth, public expenditure and dynamic optimal taxation. The article also cites a special case, and the model conclusion was simulated to estimate the best macroscopic rate.
In recent years, the finding out reasons for rapid tax revenue growth is a hot tax issues, but most of the approaches adopted are using normative analysis [8]. Peiyong Gao (2006) concludes that Chinese tax revenue growth is due to “economic growth, policy adjustment and strengthen the collection and other factors” as well as on the basis of interaction influence of economic growth, inflation, GDP and tax structural differences, progressive tax system, strengthening tax administration and foreign trade in-exports to GDP growth and tax differences and other factors, the special factors supporting sustained rapid growth of China’s tax are Chinese tax authorities’ collection is huge, a syndrome of Chinese tax yield (statutory tax levy with real negative ratio) increased to illustrate his point [9]. Xuren Xie (2011) attributes the reasons for China’s tax revenue growth to economic factors, price factors, policy factors, administration factors and the impact of major emergencies from a qualitative point of view. For the research of China’s tax reform and evolution, many scholars conduct studies from the background of domestic tax reform and steps on tax reform, the economic effects tax reform may produce more from a tax reform on the related tax impact in the field research, such as personal income tax reform on the impact of individual consumption, the impact of VAT changes on VAT.
Foreign researchers’ study on tax issues take empirical analysis and measurement methods generally, and put tax placed on endogenous economic growth, tax reform, education, income distribution, etc to inspect, study on this issue towards diversified, integrated direction [10]. Gerald W. Scully (2003) says that the tax reform is to achieve a trade-off between fairness and efficiency (economic growth) by constructing two models of government spending and taxation into the analytical framework of economic growth and using OLS, 2SLS and 3SLS to estimate under maximum economic growth, and then expand a two-equation structural model to estimate its parameters to detect the fair tax rates between unfair distribution and economic growth, and estimated US unequal distribution of income during 1960-1990 achieving the greatest economic growth. The result is that the estimate of tax rate is 25.1% achieving maximum economic growth model using Barrow, but the standard deviation of parameter estimates is not efficient, so estimates are unreliable. When government expenditure is divided into productive and non-productive, productive expenditure coefficient is positive but relatively small, unproductive coefficient is negative but relatively large, non-stationary regression residuals, the regression results need to be treated with caution. But with Scully model the optimal estimate of the tax rate is 19.3% in the macro, the coefficient is highly significant, the residual is stationary [11]. Raj Chetty and Emmanuel Saez (2006) selected 5000 enterprises in addition to foreign-funded enterprises, financial firms and public enterprises, using data from the third quarter in 1981 to the first quarter in 2005 the United States through the comparison analysis before and after 2003 tax reform in Profits Tax, confirmed the impact of 2003 Annual Income tax on corporate behavior, but there are differences existing research results on how much the impact at different times, and although it is difficult to assess the tax reform on corporate total expenditure changes, it has impacts on corporate profits change before and after the tax reform [12]. William F. Blankenau, Nicole B. Simpson, Marc (2007) puts the public educational expenditure, taxation and economic growth into an analytic framework, uses 1960-2000 panel data of 23 developed countries to construct several overlapping generations growth model, estimates the parameters of the model through ordinary least squares, and they find that through empirical analysis economic growth in developed countries has a positive relationship with public educational expenditure, and this relationship is extremely sensitive to the government budget constraint. They also found that if it is inappropriate to consider the crowding-out effect in the case, there would be no significant economic growth in public educational expenditure. One explanation for this conclusion is that if choose the inappropriate method of financing, it will not find the relationship between the public educational spending and economic growth [13]. Marco Battaglini and Stephen Coate (2008) proposes a dynamic political and economic theory of financial expenditure, taxation and debt through the mathematical models, this theory is based on the famous tax smoothing fiscal policy advocated by Barro, they put public expenditure, optimal tax theory and debt into the political and economic theoretical framework. The theory has multiple paths to expand, especially in the business cyclical fluctuations in tax revenues cycle, the government can make use of the budget surpluses and deficits to prevent dramatic changes in tax rates.
The literature on economic growth, taxation and tax reform is voluminous, we can not list all the relevant literature, the literature described above is just the tip of the iceberg, and they are subjectively selected with a very limited review of the literature, the literature is inevitable biased review, however, we still found that due to researchers’ country, perspective, object, method, time interval and index options are quite different, the conclusions are same, similar or very different in these documents, which proves the existence of diversity comprehensive and complex, due to the limited space, there is no need to present and compare the conclusions, it is also difficult to comply a certain literature or a certain path in this study, we started our study on the basis of these documents, according to our research capabilities and master data situation to determine perspective to examine the issue, we believe that our research perspective is unique as there are rarely from the perspectives of economic growth and tax reform together to study China’s tax volume and structure from the year 1950 to 2011. So we will follow our design ideas to study this issue.
3. Study Methods and Data
In order to study the effect of economic growth and tax reform on the tax effects of changes in volume and structure since the founding of China, the paper describes seven major tax reforms from the year 1950 to 2011, this description is mainly focused on the change of the total number of taxes, because taxes and structural changes are closely related to the total number of taxes.
Despite the changes of the tax amount and structure is affected by many factors, we believe that the most fundamental factors are the economic and institutional factors, we regarded the economic factors as endogenous variables, and institutional factors are exogenous variables. From the year of 1950 to pre-1977, in the constrains of Chinese planned economy, economies of scale and the former Soviet theory of light duty, changes in total tax revenue is relatively flat, while changes in the tax structure factors influenced by tax reform is big, based on these above factors, it is suggested to from the three perspective of descriptive statistics, tax time sequence, how the structure of GDP and tax reform influence the total number and structure of tax, to establish this research path.
We will divide the interval time based on tax reform, use the average tax year, the annual increase, the average annual growth rate, range minima, maxima interval, interval macro tax burden and tax reforms to describe the range of values of total tax changes in the amount and structure, trying to change these values to capture the total and structural differences between a tax reform and the adjacent tax reform.
In order to describe the situation of tax changes, we use TAXt to represent the total tax revenue, GSHSHt to represent industrial and commercial tax, Tt to represent time, define T1950 = 1, T1951 = 2, T1952 = 3 and so on, continue to use the interval classification method, divide time interval according to tax reform, introduce the dummy variable Dit, and establish multi-segment regression model (I) and (II):
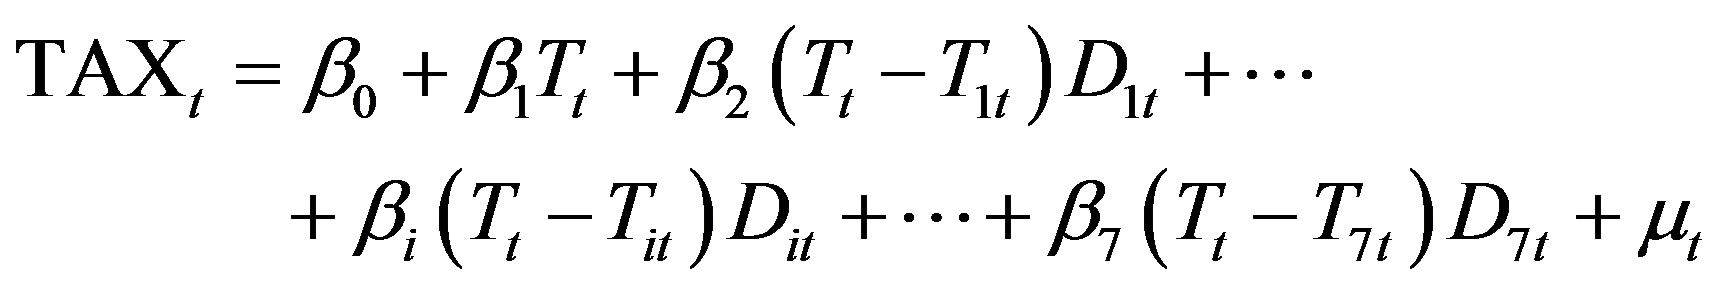 (I)
(I)
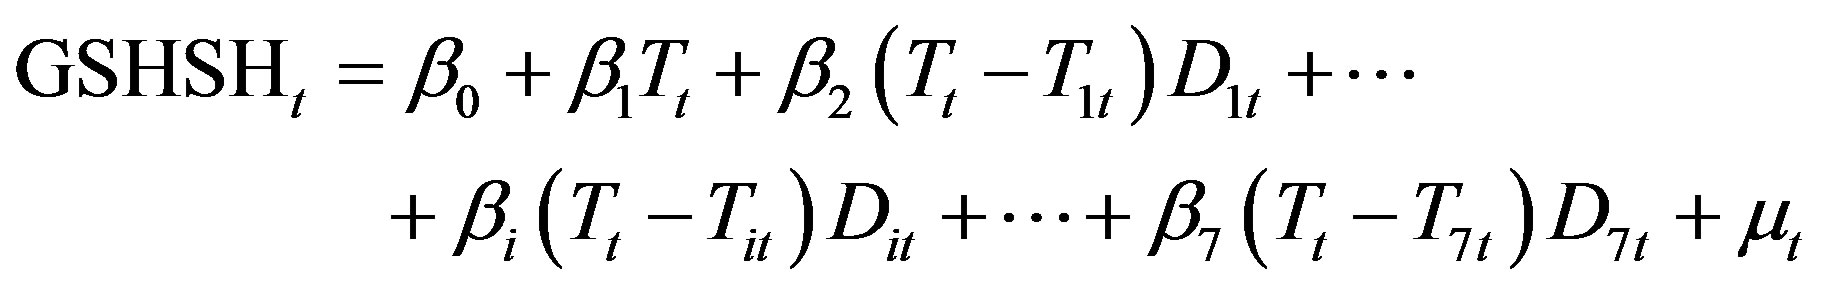 (II)
(II)
Here,  represent parameters to be estimated, T1t tax reform represents the 1st time, Tit tax reform represents the i-th time; D1t’s value is 1 or 0, 1 means the 1st tax reform year to year 2nd year before tax reform, namely the 1st tax reform and the implementation of this tax reform until after the 2nd year of the previous year tax reform experienced years, take 0 indicates other years. Dit represents the i-th dummy variable, 1 means the i-th year of tax reform to tax reform (i + 1) times the year before the year that the i-th tax reform and the implementation of the reform of the tax system until after the i + 1 tax reform experienced year preceding the year the year; take 0 indicates other years.
From the view of macroeconomics, the change of the total tax revenue is mainly determined by the GDP. As a result, the relation between the total tax revenue and the GDP is revealed. Define the variable Dit and the multiline regression model (III) and (IV) are as below,
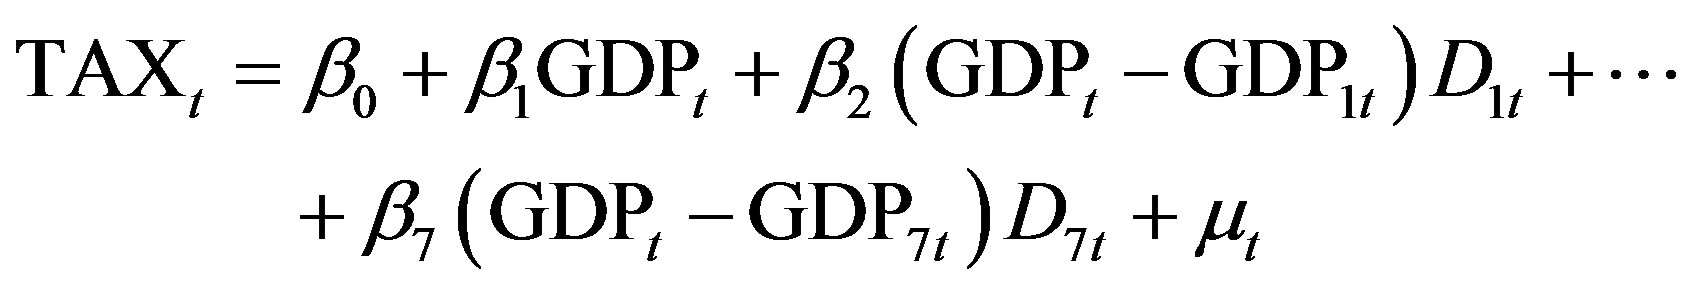 (III)
(III)
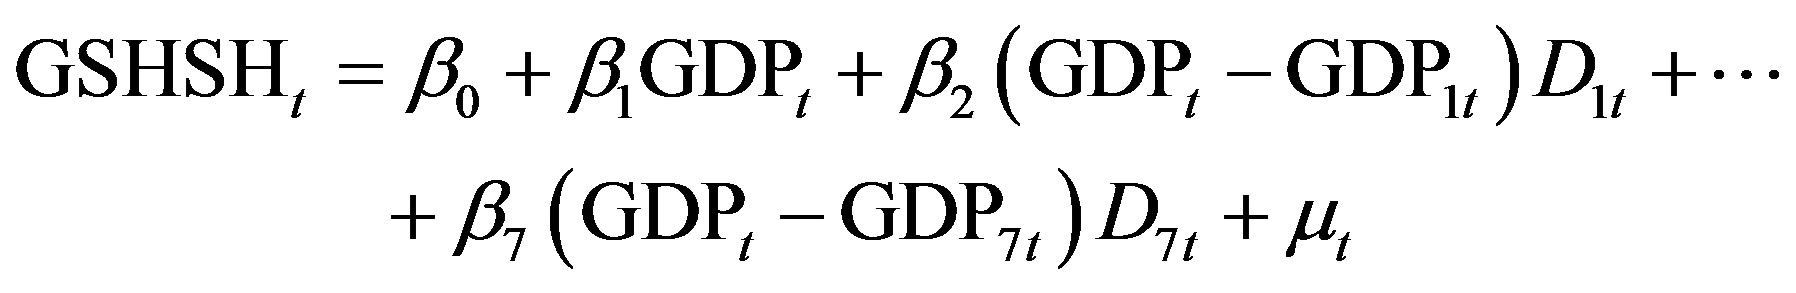 (IV)
(IV)
In the Equation (II),  are parameters to be estimated, GDP1t is the GDP in the year of the first tax reform, GDPit is the GDP in the year of the i-th tax reform, and Dit is the same with Equation (I).
This paper focuses on the study of China’s total tax revenue and tax structural changes since 1994, for the tax reform in 1994 is the most comprehensive and profound one since the founding of New China. It established the Chinese pair of main tax (VAT and corporate income tax) for complex tax system, the tax system has been running for nearly 20 years, during which a number of tax reforms carried out locally and the tax structure had undergone some changes, but they did not change the tax system in this complex basic framework. So here examine their movements from three perspectives as the total tax revenue, value-added tax and enterprise income tax, and use the impulse response function and principal component analysis to explore how the total tax revenue, VAT and corporate income tax affected by economic factors. Still represents the total tax revenue by TAXt, VAT by ZZSt and CIT use QYSt expressed. The analysis needs some economic variables: Chinese industrial output (CGIt), Chinese retail merchandise sales (TRSt), China import and export volume (TIEt), China’s total energy consumption (TECt), savings deposits of urban and rural residents (TSDt).
Many factors affect revenue, so here choose Chinese industrial output index (CGIt), Chinese retail merchantdise sales index (TRS), China import and export volume index (TIEt), China’s total energy consumption indicators (TECt), savings deposits of urban and rural residents indicators (TSDt) to make principal component analysis respectively with the total tax revenue (TAXt), VAT (ZZSt) and corporate income tax (QYSt). Let  be a p-dimensional random vector, mean
 , covariance
 , consider the linear transformation:
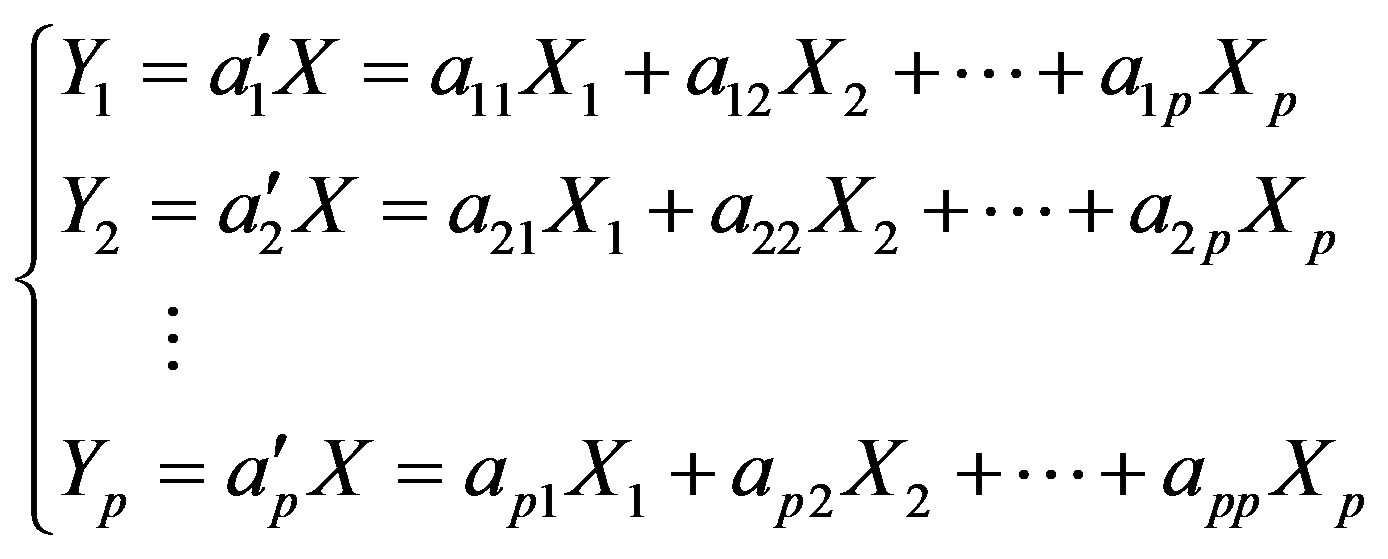 (V)
(V)
If (1)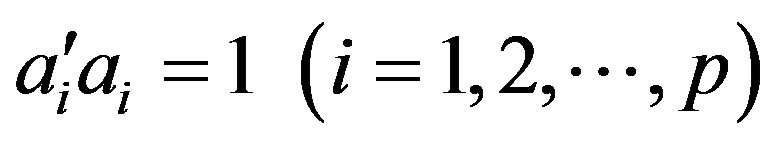 ;
;
(2) If i>1, then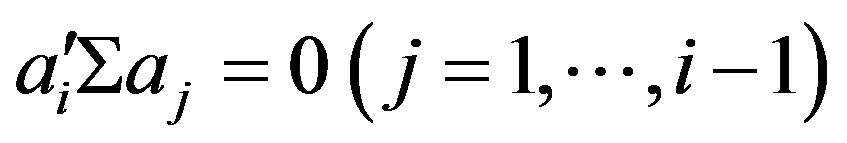 ;
;
(3)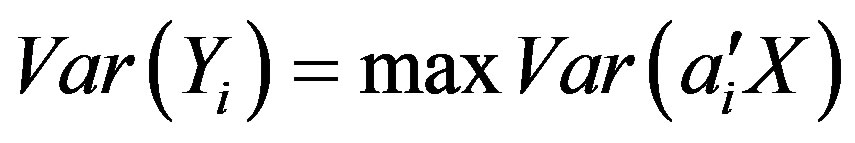 . Then
  is the X component of the i-th main
 .
.
The data collected in this paper is statistical data at current prices without making any deal with in order to reflect the nature of the original data. Unless otherwise stated, data in the text are original annual data. Annual data is from “New China Statistical Data Compilation of 60 Years”, “China Statistical Yearbook” and “China Inland Revenue Statistics (1950-2004)”. Data in 2011 is from the Chinese Ministry of Finance website and China Social Economic Development Bulletin in 2011 which released of the China National Bureau.
4. Empirical Analysis
4.1. Changes of Taxes Affected by Tax Reform
China established a unified national tax system in 1950, and introduced the 15 types of taxes, which are agricultural tax, excise, cotton marketing in tax, transaction tax, business tax, stamp duty, vehicle license tax, slaughter tax, property tax, real estate tax, special consumption act tax, deposit interest income tax, payroll tax, the salt tax and tariffs.
4.1.1. The Tax Reform in 1953
The tax reform in 1953 was implemented to accommodate the new China’s first five-year plan, which includes: 1) to change the transaction tax to commodity circulation tax and livestock transaction tax; 2) to simplify excise tax; 3) to simplify business tax (to simplify the sales tax, income tax, vendors business license tax, and temporary business tax to business tax, income tax, and temporary sales tax); 4) to combine the real estate tax and property tax into urban real estate tax; 5) to cancel special consumption act tax, only levied culture entertainment tax; 6) to cancel cotton marketing tax; 7) deposit interest income to interest income; 8) cancel the payroll tax. After the reform 12 types of taxes existed: excise taxes; commodity circulation tax; livestock transaction tax; business tax; vessel usage license tax; slaughter tax; urban real estate tax; cultural entertainment tax; interest income; salt tax; tariffs and agricultural tax. This tax reform played an active role to promote economic recovery and growth and to transform the private economy in China at that time.
4.1.2. The Tax Reform in Year of 1958
The tax reform in 1958 was carried out under the guidelines of “stable tax burden, simplified the tax system” after the socialist transformation of the private economy, this reform was just simplified the original tax regime, and introduced the business tax and bazaars transaction tax. It includes: 1) to combine the excise tax, commodity tax, the business tax and stamp tax into industrial and commercial tax; 2) the introduction of industrial and commercial tax; 3) the introduction of market transaction tax.
After the reform there still remained 12 taxes: industrial and commercial tax, business tax, livestock trading tax, vehicle license tax, market transaction tax, slaughter tax, urban real estate tax, entertainment tax, interest income tax, salt tax, tariff and agricultural tax.
4.1.3. The Tax Reform in Year of 1973
The guideline of the tax reform in 1958 is to further simplify the tax system, and it just levied industrial and commercial tax for the state-owned enterprises which accounted for the dominance of economy, and levied industrial and commercial tax and business tax for the collective enterprises. The elements of this tax reform were: 1) to change the consolidated industrial and commercial tax into business tax; 2) to cancel cultural entertainment tax; 3) to abolish the interest tax. After the reform there remained 10 types of taxes: industrial and commercial tax, business tax, livestock trading tax, vehicle license tax, market transaction tax, slaughter tax, urban real estate tax, salt tax, tariff and agricultural tax.
Thus, from the year of 1950, when China founded a unified tax system, to the reform and opening up in 1979, the general trend of China’s tax reform is to simplify the tax system and reduce the types of the taxes. And there was almost no main tax type in this period.
4.1.4. The Tax Reform in Year of 1980
In the beginning of the reform and opening up, China’s economic system transformed from a planned economy to a planned commodity economy. To meet the needs of economic system’s reform and opening up, the tax’s function strengthened, in this context; in 1980 the two taxes of foreign nature were introduced: personal income tax and joint ventures business corporate income tax. After the tax reform there were 12 types of taxes, which are: industrial and commercial tax, business tax, livestock trading tax, vehicle license tax, market transaction tax, slaughter tax, urban real estate tax, salt tax, personal income tax, Sino-foreign joint venture enterprise income tax, tariffs and agricultural taxes.
4.1.5. The Tax Reform in Year of 1983
The tax reform in year of 1983 had a great significance since the reform and opening up, this tax system reform mainly carried out around the first step of the “interest to tax” of the state-owned enterprises, it included: 1) the introduction of value added tax; 2) the introduction of a foreign enterprise income tax; 3) the introduction of special fuel oil tax; 4) the introduction of state-owned enterprise income tax; 5) the introduction of the building tax. After the reform there were 17 types of taxes: industrial and commercial tax, business tax, livestock trading tax, vehicle license tax, market transaction tax, slaughter tax, urban real estate tax, salt tax, personal income tax, joint venture income tax, VAT, foreign enterprise income tax, special fuel oil tax, state-owned corporate income tax, building tax, tariffs and agricultural taxes.
4.1.6. The Tax Reform in Year of 1984
Because the tax reform of 1983 was not in place, another tax system reform was carried out in 1984, which included: 1) the introduction of taxes on products; 2) the introduction of sales tax; 3) the introduction of resource tax; 4) the introduction of state-owned enterprises bonus tax. This tax system reform were mainly carried out around the second step of the “interest to tax” of the state-owned enterprises, and the types of the taxes increased up to 21, whom were: industrial and commercial tax, business tax, livestock trading tax, vehicle license tax, market transaction tax , slaughter tax, urban real estate tax, salt tax, personal income tax, joint venture income tax, VAT, foreign enterprise income tax, special fuel oil tax, state-owned corporate income tax, building tax, product tax, business tax, resource tax, state-owned enterprises bonus taxes, tariffs and agricultural taxes.
In short, through the two tax reforms in 1983 and 1984, China has initially established the complex tax system which turnover tax and income taxes accounted for the main place.
4.1.7. The Tax Reform in Year of 1994
In the late 1980s to the early 1990s, although levying some new taxes caused taxes gradually increased, the pace of tax reform is not large. In 1992, China established a socialist market economic system. Against this background, Chinese tax reform tax system which was formed in 1984 and later obviously can not meet the requirements of social and economic development. So, as to adapt to the socialist market economic development needs, China carried out once the most profound reform on the tax system in 1994. This tax reform is mainly around the simplified tax system, balance the tax burden, reasonably afford and eliminate planned economy regime, establish double subject taxes as value added tax and enterprise income tax and other aspects to implement. This tax reform’s contents: 1) Unite the industrial and commercial tax, product tax and value added tax into VAT; 2) Unite the personal income adjustment tax, urban and rural individual industrial and commercial households income tax and personal income tax into personal income tax; 3) Unite the collective enterprise income tax, state corporate income tax and corporate income tax into private income; 4) Levying land tax; 5) Cancel Salt tax and incorporate it into the resource tax; 6) Cancel the bonus tax, fairs transaction tax, livestock tax and special consumption tax. The number of taxes became 18 after this reform and they are VAT, business tax, consumption tax, corporate income tax, foreign-invested enterprises and foreign enterprises income tax, personal income tax, travel tax, slaughter tax, property tax, resource tax, urban maintenance and construction tax, land use tax, farmland occupation tax, deed tax, stamp duty, banquet tax, tariffs and agricultural tax. In the late 1990s, major reforms didn’t happen on tax system. In the 21st century, China’s tax reforms are as follows: levying vehicle purchase tax (2001); Cancel agricultural tax (2006), tobacco tax reserved; Unite the foreign-invested enterprises and foreign enterprises income tax and corporate income tax into enterprise income tax (2008); Levying fuel tax, and VAT become consumption-based pattern from production pattern (2009); Preliminary attempt to implement property tax reform in Chongqing and Shanghai (2011); “Camp changed by” in Shanghai pilot (2012).
4.2. Descriptive Statistics for Tax Revenue Generated by Taxation Reform
By looking at the history of China’s taxation reform, we can describe the path of the taxation reform roughly as: multiple tax system → single tax system → Complex tax system → simplification of tax system, here we are going to show the change in the total scale of tax revenue brought about by each tax reform. Table 1 summarizes the change in tax revenue generated by seven tax reforms since the founding of new China.
The lengths of durations for these seven tax reforms are different, so we are using some relative indicators to describe the change in the scale of tax revenue generated by each taxation reform. From Table 2, we can find that the macro tax burden was 14.39% during the period from 1953 which is the year of the first tax reform to 1957, also in this period, the average annual tax revenue was 135.01 hundred million yuan, average annual increase in tax revenue was 7.04 hundred million yuan, and the average annual increase rate was 6.6%. In the meantime, the average annual GDP was 93.85 billion yuan, annual average increase was 6.1275 billion yuan, and the annual average increase rate was 6.7%, so the increase rate of tax revenue kept step with the increase rate of GDP.
The 15-year period started from implement of the
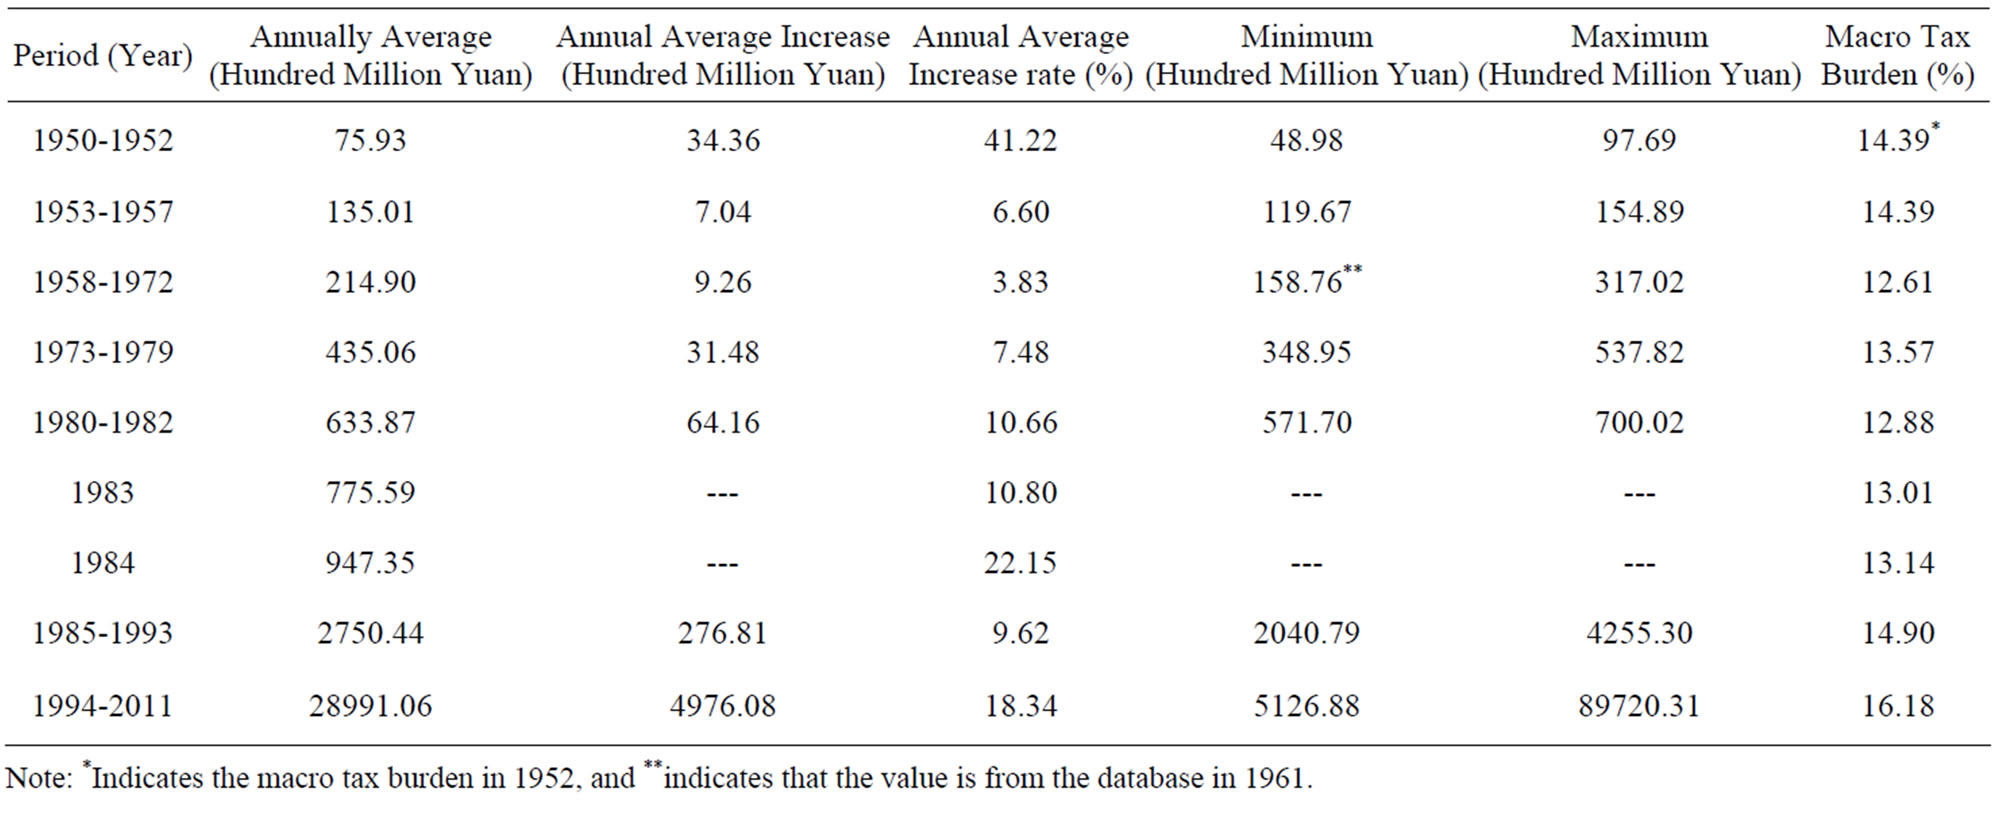
Table 1. Descriptive Statistics for tax revenue by time period of taxation reform.
Note: *Indicates the macro tax burden in 1952, and **indicates that the value is from the database in 1961.
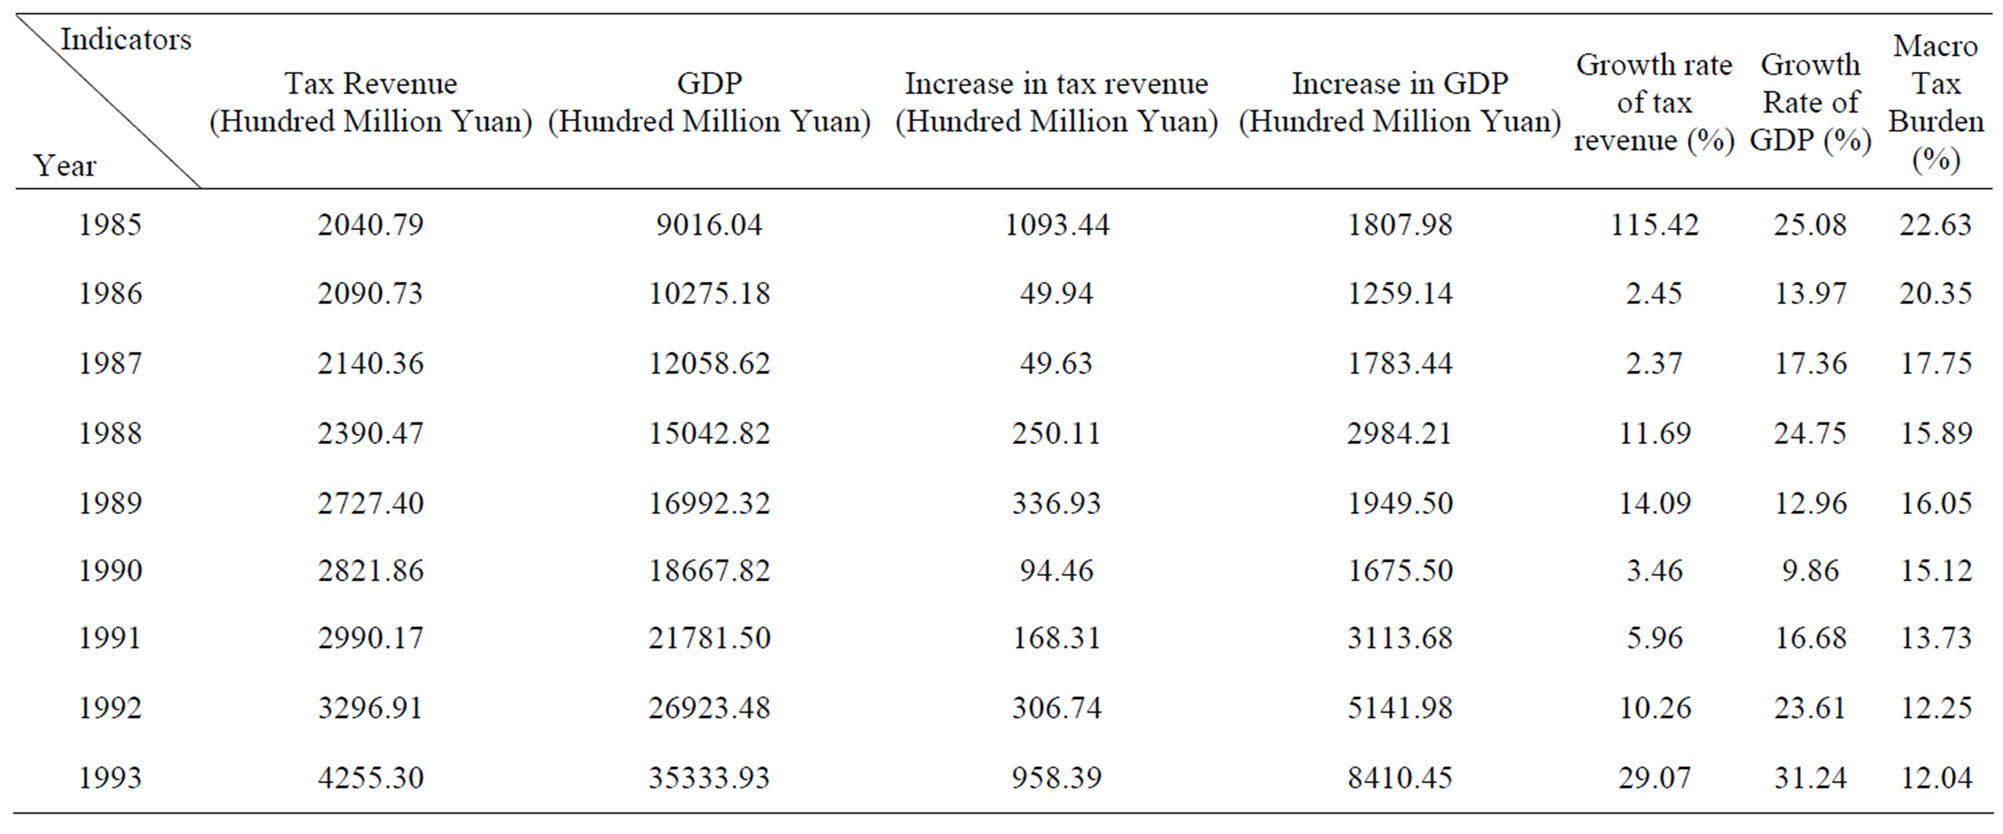
Table 2. Change in tax revenue, GDP and macro tax burden in 1985-1993.
second tax reform in 1958 to 1971 is the time of China’s dramatic social change. Though the average annual tax revenue was 21.49 billion yuan which was greater than that in the period from 1953 to 1957 by 79.89 hundred million yuan, and the average annual increase was 9.26 hundred million yuan which was greater than that in the period from 1953 to 1957 by 2.2 hundred million yuan, but the annual increase rate of tax revenue was only 3.83% which was less than that in the period from 1953 to 1957 by 2.77 percentage points. However In 1958- 1972, the average annual GDP was 170.29 billion yuan, average annual increase of GDP was 87.29 hundred million yuan, and average annual growth rate of GDP was 4.8%. Since the revenue growth rate during this period was nearly a percentage point lower than the GDP growth rate, the tax elasticity was less than 1, leading to macro tax burden’s decrease to 12.61%. It can be seen that the macro tax burden in this period was lower than that in the 1953-1957 period by 1.78 percentage points, mainly because of the decline in economic growth and simplification of tax reform. So obviously tax reform and economic growth have significant effects on the size of the entire tax revenue.
The tax reform in 1973 had simplified the tax system the most since the founding of new China, mainly due to the planned economy and negligence of tax under special economic background. During 1973-1979, the annual average of tax revenue was 435.06 hundred million yuan, average annual increase was 3.148 billion yuan, and the average annual growth rate was 7.48%, while in the same period the average value of GDP was 320.58 billion yuan, the average annual was 221.53 hundred million yuan, and the average annual growth rate was 6.83%. Since the average annual growth rate of tax revenue was higher than the average annual growth rate of GDP by 0.65 percentage points, the tax elasticity was greater than 1, and macro tax burden reached 13.57%. Let us look at the growth rate of tax revenue and growth rate of GDP for each year from 1973 to 1979, there was an obvious difference between the growth rate of tax revenue and the growth rate of GDP, which means tax revenue had been affected by other factors.
Tax reform in 1980 was activated to accommodate the needs of the reform and opening up, and it only added two taxes related to foreign affairs. During 1980-1982, the average annual tax revenue was 633.87 hundred million yuan, the average annual increase was 64.16 hundred million yuan, and the average annual growth rate was 10.66%, which were higher than the values in the period of 1973-1979 by 198.81 hundred million yuan, 32.68 hundred million yuan and 3.18 percentage points respectively. Also in this period, the average annual GDP was 492.02 billion yuan, the average annual increase was 38.89 billion yuan, the average annual growth rate was 8.2%, and macro tax burden was 12.88%. Just look at the growth rate of tax revenue and growth rate of GDP for each year in this period, the values were 6.3% and 11.89% in 1980, 10.81% and 7.61% in 1981, and 11.13% and 8.83% in 1982 respectively. The growth rate of tax revenue in 1980 was lower than the growth rate of GDP in the same year by 5.59 percentage points, the growth rate of tax revenue in 1981 was higher than the growth rate of GDP in the same year by 2.57 percentage points, and the growth rate of tax revenue in 1982 was higher than the growth rate of GDP by 2.3 percentage points, obviously, the two taxes related to foreign affairs promulgated in 1980 showed their impacts on the total tax revenue in 1981 and 1982 fully.
After the first step of implementation of “Tax for Profits” in 1983 and second step in 1984, China’s tax system have changed dramatically. The effects of implementation of the first step of “Tax for Profits” in 1983 showed up in 1984, for example, the tax revenue in 1984 was 947.35 hundred million yuan, and the growth rate was 22.15%, which are greater than those in 1983 by 171.76 hundred million yuan and 11.35 percent points respectively.
The second step of “Tax for Profits” was implemented in 1985, and the increase in tax revenue was particularly obvious. For example, tax revenue in 1985 was 2040.79 hundred million yuan, and its growth rate was 115.42%, which were greater than those in 1984 by 1807.98 hundred million yuan and 93.27 percentage points perceptively. While the growth rate of GDP was only 25.08%, and the macro tax burden was 22.64% which was higher than that in 1984 by 9.5 percentage points. Therefore, tax reform in 1984 had the most significant impacts on change in the tax revenue in 1985.
During 1985-1993, the average annual tax revenue was 2750.44 hundred million yuan, the average annual increase was 276.81 hundred million yuan, average annual growth rate was 9.62%, and macro tax burden was 14.9%. But if we discuss by year, the specific changes are shown in Table 3. Since 1986, the fluctuation of the growth rate of average annual revenue had been relatively greater. Actually, except for the growth rate of GDP was lower than the growth rate of tax revenue in 1989, the growth rate of GDP was higher than the growth rate of tax revenue for the other years. If we compare the macro tax burden in 1984 with that during 1985-1993, macro tax burden for the later period was higher than that in 1984 by 1.76 percentage points, and this was due to the extraordinary increase in tax revenue in 1985. Also the big fluctuation of the increase in tax revenue during 1985-1993 indicates that the adjustments of Chinese economic reform as well as financial distribution were frequent in this period.
The tax reform in 1994 is the most profound and comprehensive reform in the history of new China. As the economy grew, the tax revenue stepped into a sustained stage of rapid growth. During 1994-2011, the average annual tax revenue was 28991.06 hundred million yuan, the average annual increase in value was 4976.08 hun-
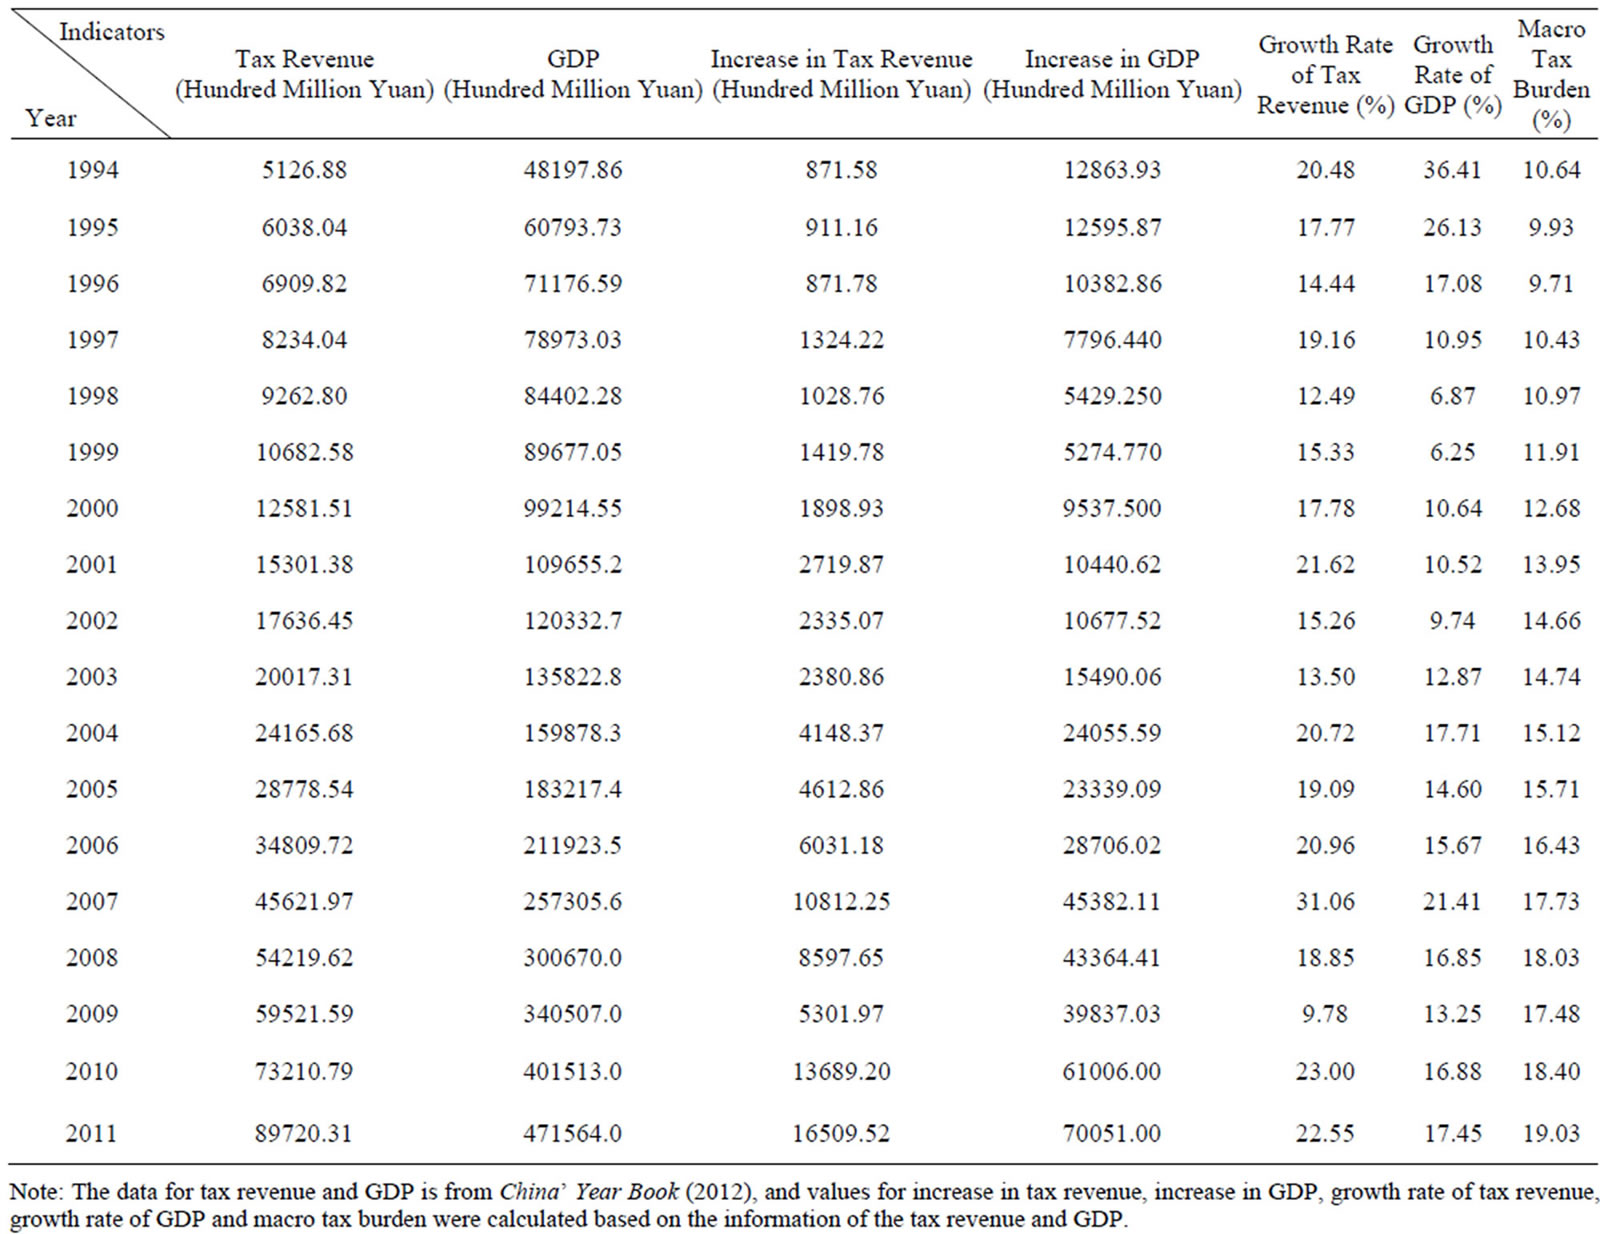
Table 3. The changes in tax revenue, GDP and macro tax burden during 1994-2011.
Note: The data for tax revenue and GDP is from China’ Year Book (2012), and values for increase in tax revenue, increase in GDP, growth rate of tax revenue, growth rate of GDP and macro tax burden were calculated based on the information of the tax revenue and GDP.
dred million yuan, the average annual growth rate was 18.34%, and the macro tax burden was 16.18%. Figure 1 and Table 3 show the changes in the growth rate of tax revenue, growth rate of GDP and macro tax burden for each year.
During 1994-1996, growth rates of GDP were higher than the growth rates of tax, and China’s economic actualized “soft landing” in 1996, in the meantime, the growth rate of GDP fell back to 17.1%. After that, because of the Asian financial crisis and the impact of overcapacity, the growth rate of GDP declined continually in 1997, 1998, and 1999, and then kept increasing until 2007. From 1997 to 2008, the growth rates of tax revenue were higher than the growth rates of GDP, which indicates that the tax elasticity was greater than1, and we have increase in macro tax burden. In 2008 China was affected by the global financial crisis, and showed a recovery increase in GDP in 2010 and 2011 after experiencing the fall of growth rate of GDP in 2008 and 2009. In the period of 2008-2011, the growth rate of tax revenue was 18.85% in 2008, and its trend went up and fell down in the graph, and the reason for that is that China's economy had been severely affected by the financial crisis since September in 2008. And 2009 is the year that China’s economy severely suffered the negative effects of the financial crisis. As the growth rate of economy declined, the growth rate of tax revenue also fell to 9.78%, which was the lowest level since 1994. Based on the data, we can say that the shock of financial crisis to China’s economy directly impacted the growth rate of tax revenue. But along with the measures to stimulate economic growth began to play a positive effect, China’s economy showed the tendency of rapid growth in 2010, and the growth rate of tax revenue reached 23%, and China’s economy maintained rapid growth in 2011, also the growth rate of tax revenue reached 22.55%.
From the analysis above, we can see that China had conducted three large tax reforms from the founding of new China to the beginning of reform and opening up in 1979, and the trend was to simplify the tax system and form a relatively simple one. After the reform and open-
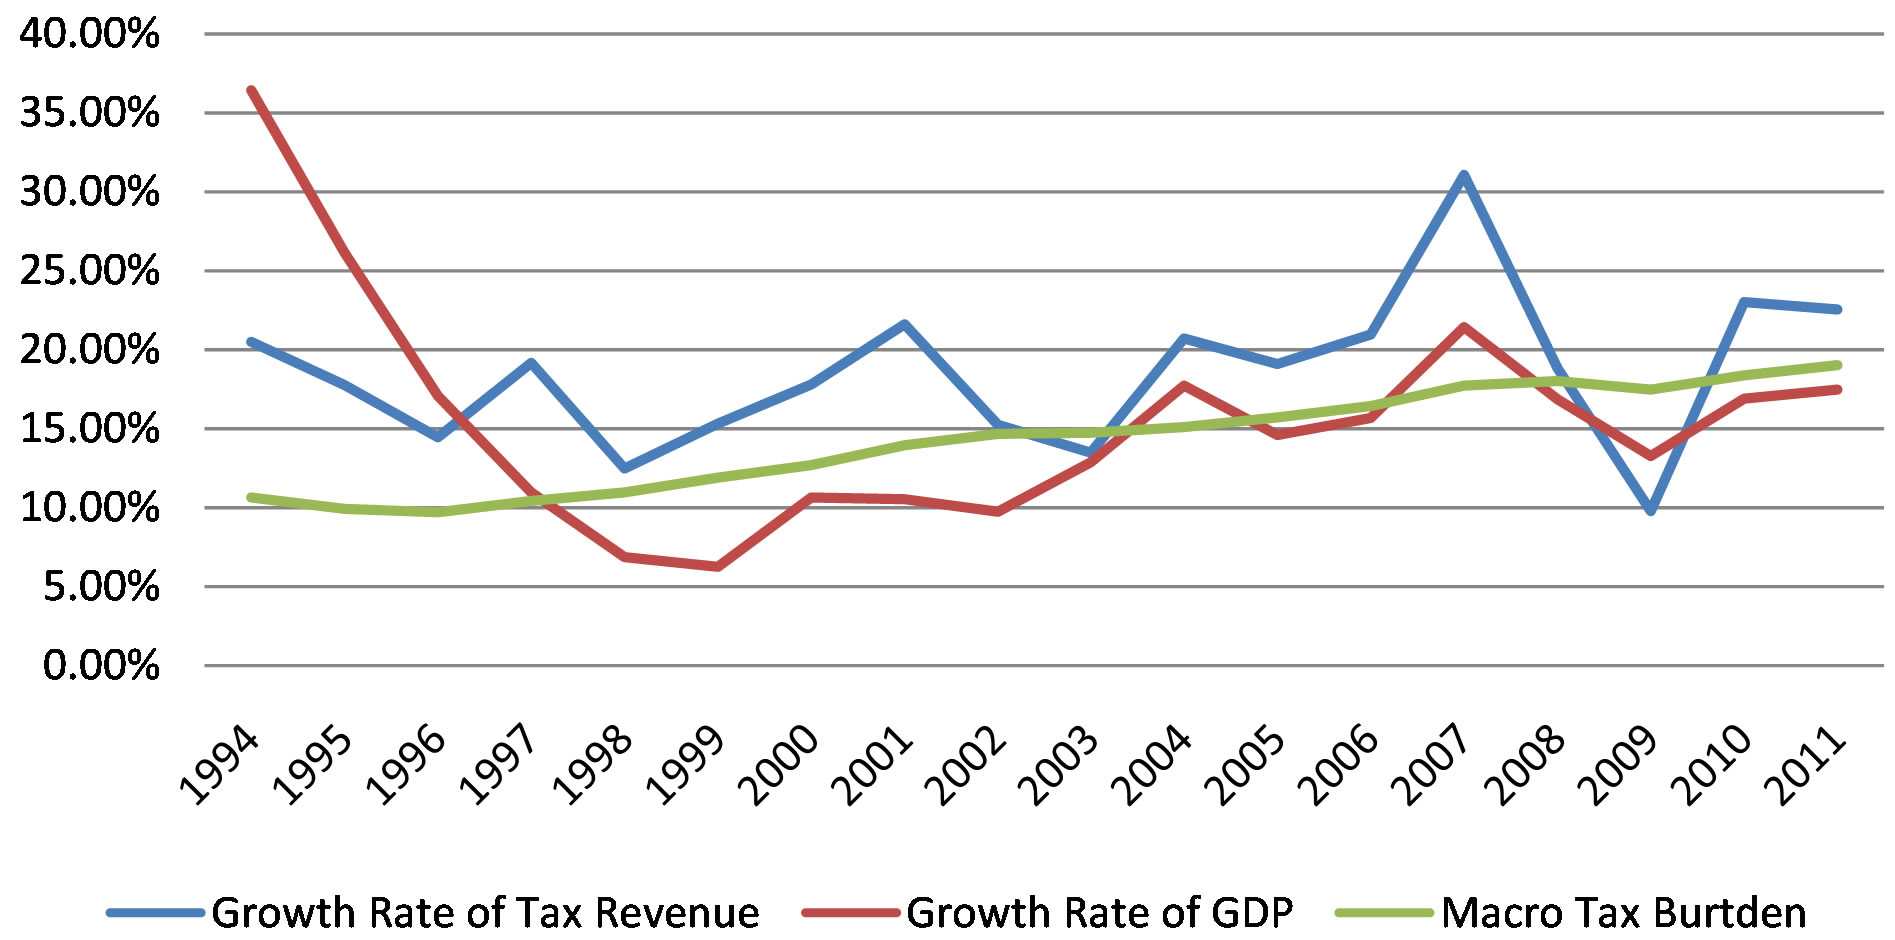
Figure 1. Growth rate of tax revenue, growth rate of GDP and the macro tax burden.
ing up, China has conducted four larger tax reforms, and the trend was to build a complex composite tax system at first and then turn to build a simplified one. The analysis above shows that each tax reform changed the relationship between the economic growth and total tax revenue, indicating that both economic growth and tax reform have significant effects on the change in the total tax revenue.
4.3. Multi-Segment Regression Model
To analyze the effects of tax reforms on the total amount and structure of tax revenue further, we use multi-segment regression models here to estimate the changes in total tax revenue and structure. According to the setting of multi-segment regression model (I), (II), (III), (IV), we divided the time period before the reform and opening up into three periods as well as the time after that to analysis the numerical relationship between GDP and total tax revenue. The results for Multi-line regression model are in the Table 4.
First look at the results for multi-segment regression model (I), we can find that the slopes of segments are negative in 1953-1957, 1973-1979 and 1985-1993, and the slopes are positive in 1958-1972, 1980-1984 and 1994-2011, which suggests that the total amount of tax revenue had changed by stage. Moving trend of Multisegment regression model (III) and that of multi-segment regression model (I) are consistent. But R2 of multisegment regression model (III) is higher than that of multi-segment regression model (I), and the value for the former one is 0.9099, while the later is 0.9225. The tax reforms focused on industrial and commercial tax, so R2 of model (I) is higher than that of model (III).
If we look at the multi-segment regression model (II), we can find that during the 1953-1957,1958-1972, 1973- 1979, 1980-1984, 1985-1993 and 1994-2011, only the slope of regression line in 1973-1979 is negative, and its absolute value approximates zero, while the slopes in the other 5 periods are positive. This means that the growth of total amount of tax revenue is slow after the 1973’s tax reform because the growth of GDP slowed down. For the model (IV), in the six time periods we mentioned above, the slopes in 1973-1979 and 1985-1993 are negative, which reflects that the tax reform changed the relationship between commercial tax and GDP.
4.4. Principal Component Analysis of Tax
Here we use the total industrial output index (CGIt), gross domestic product (GDPt), fixed asset investment (GDTt), total energy consumption indicator (TECt), import and export trade volume index (TIEt), retail merchandise sales index (TRSt), savings deposits of urban and rural residents (TSDt) and total tax revenue (TAXt),
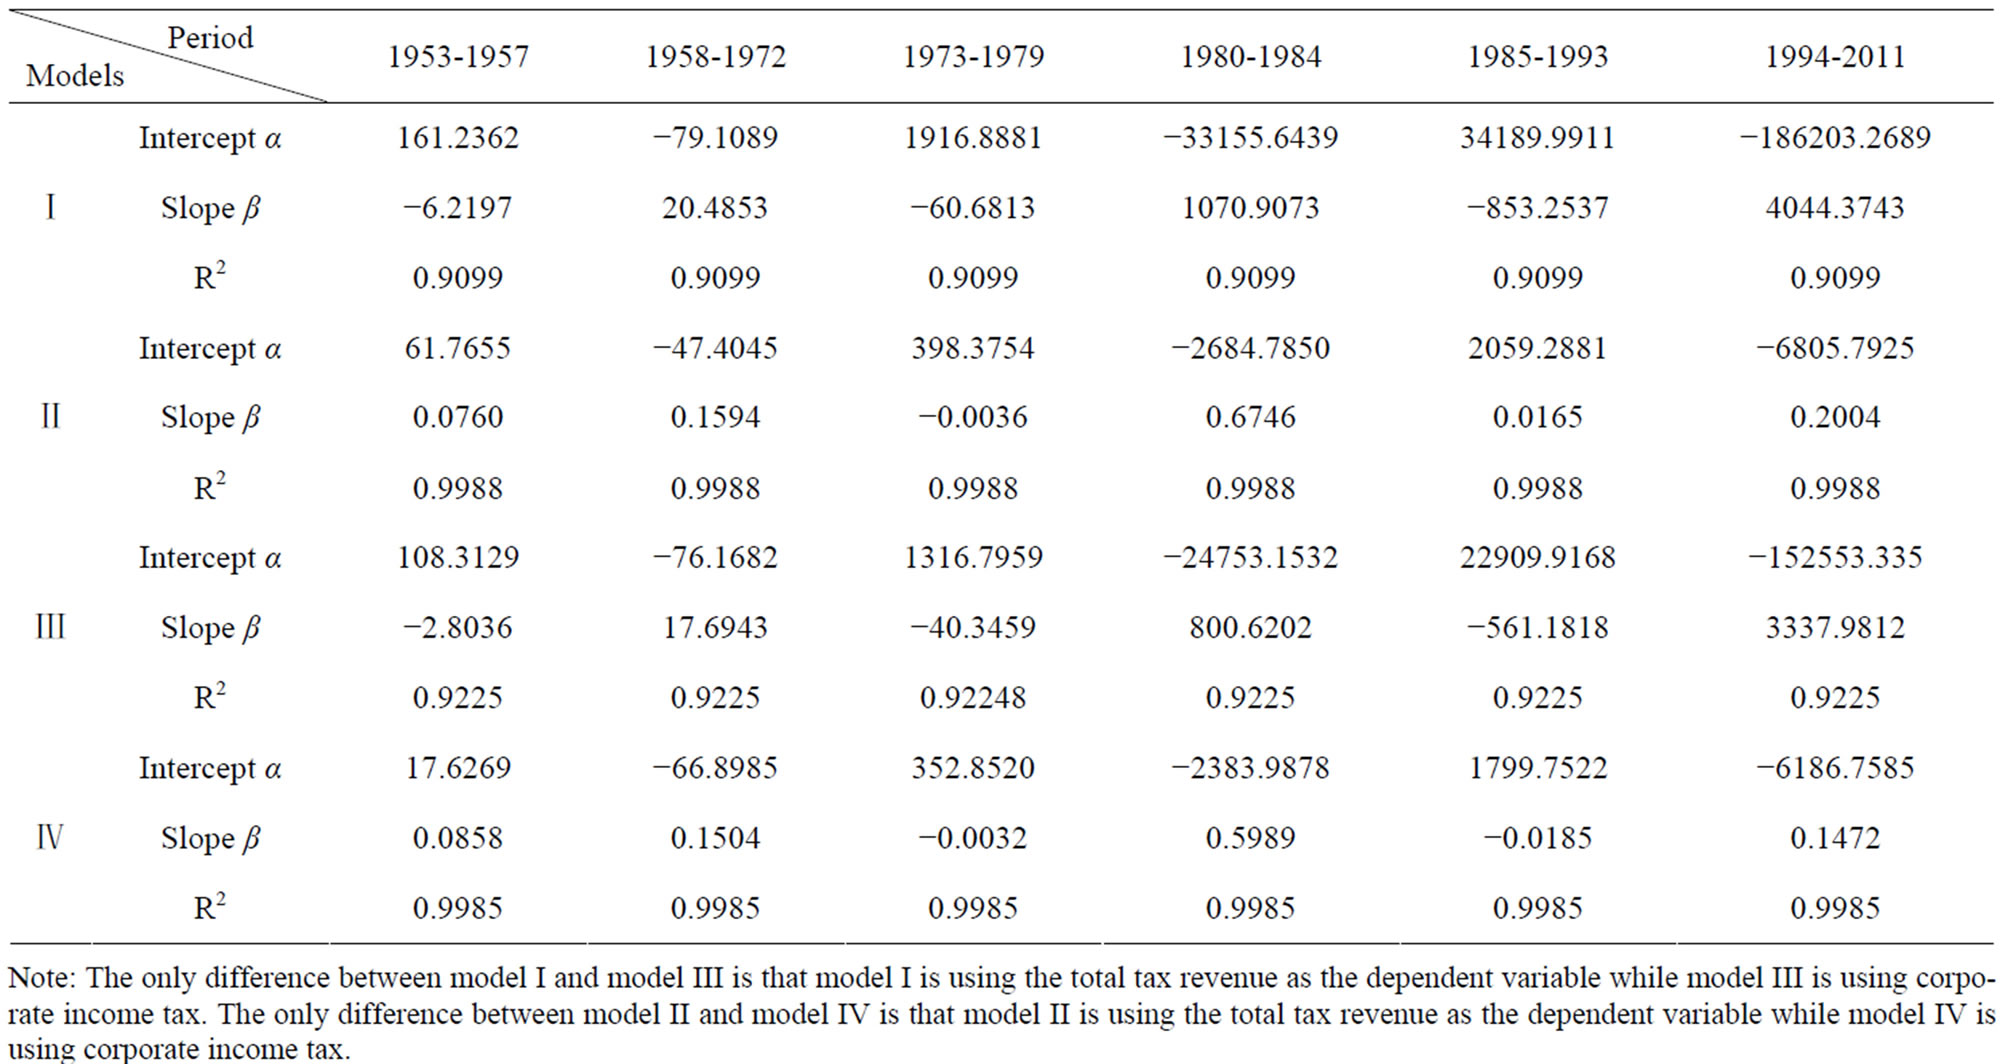
Table 4. Estimation results of multi-segment regression model (I), (II), (III), (IV).
Note: The only difference between model I and model III is that model I is using the total tax revenue as the dependent variable while model III is using corporate income tax. The only difference between model II and model IV is that model II is using the total tax revenue as the dependent variable while model IV is using corporate income tax.
value-added tax (ZZSt), corporate income tax (QYSt) to do principal component analysis.
Table 5 shows the Eigenvalues, Eigenvalue Difference, Percent of Inertia, Cumulative Eigenvalue and Cumulative Percentage. As can be seen from Table 5, the cumulative percentage of the first component reaches 98.39%, and if we just look at the first component and the second one, the cumulative percentage is 99.35%, which means just two components can explain the relationship between total tax rate (TAXt) and other seven indicators we mentioned above.
Table 6 shows loadings. Based on the analysis above, we can use two principal components instead of seven original variables to explain the relationship with TAXt.
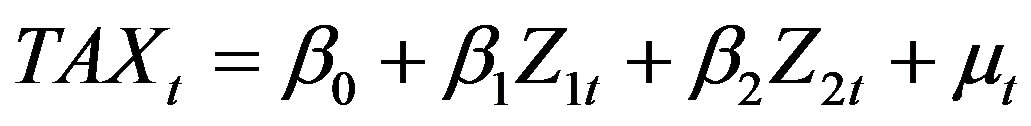
Set the first principal component as Z1, and the second principal component as Z2. The Z1 and Z2 can be written as the following:
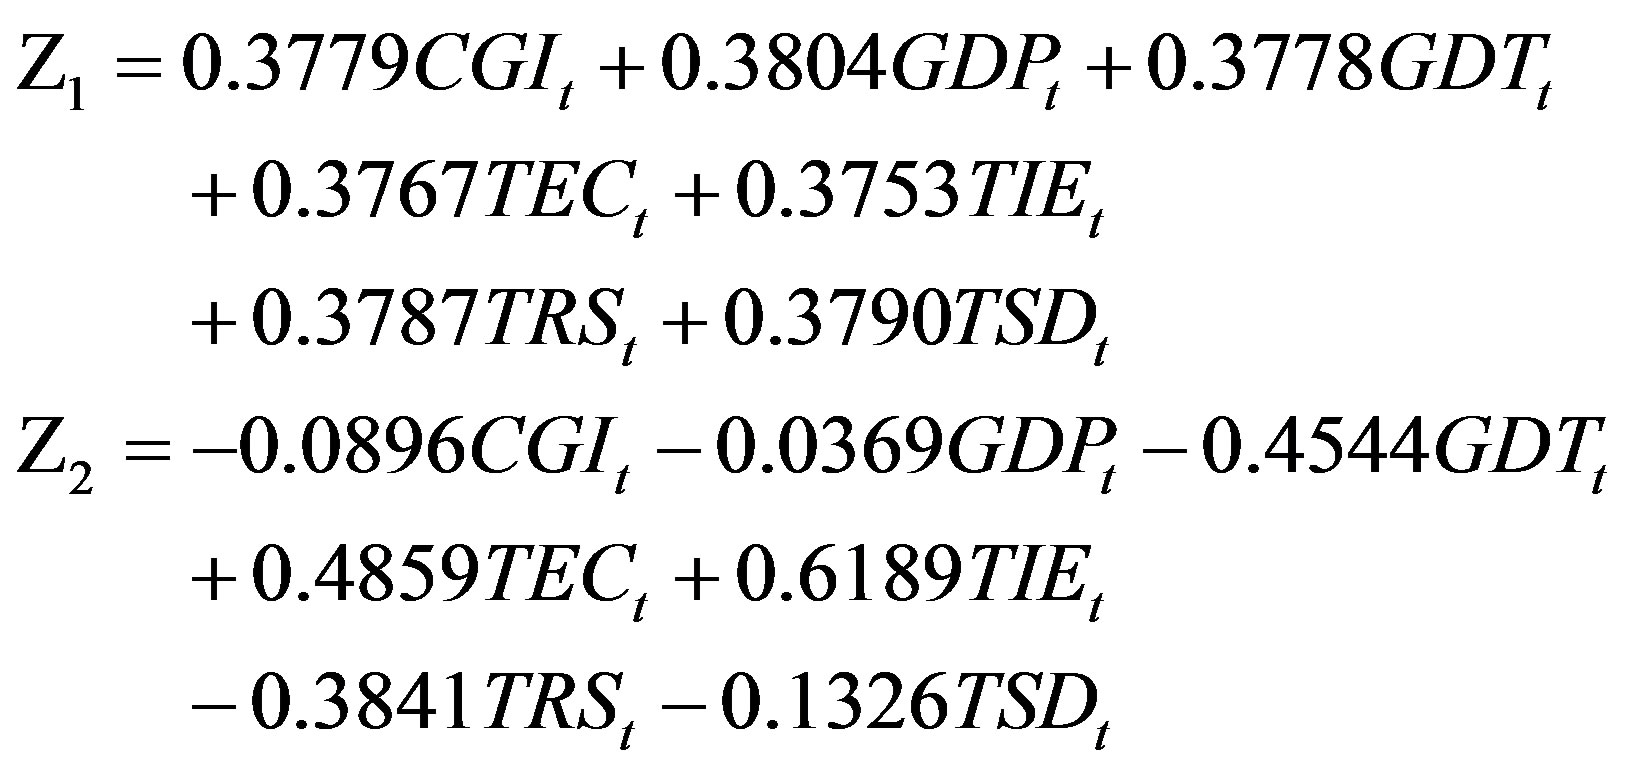
If we use CGIt, GDPt, GDTt, TECt, TIEt, TRSt, TSDt and TAXt to do the regression, the estimation results are not very good because independent variables are highly correlated. Since Z1 and Z2 are uncorrelated, we set up the principal component regression model by using these two components.
We get the estimation values for Z1 and Z2 based on the data of CGIt, GDPt, GDTt, TECt, TIEt, TRSt, TSDt, and then run the regression above, and the results are the following:
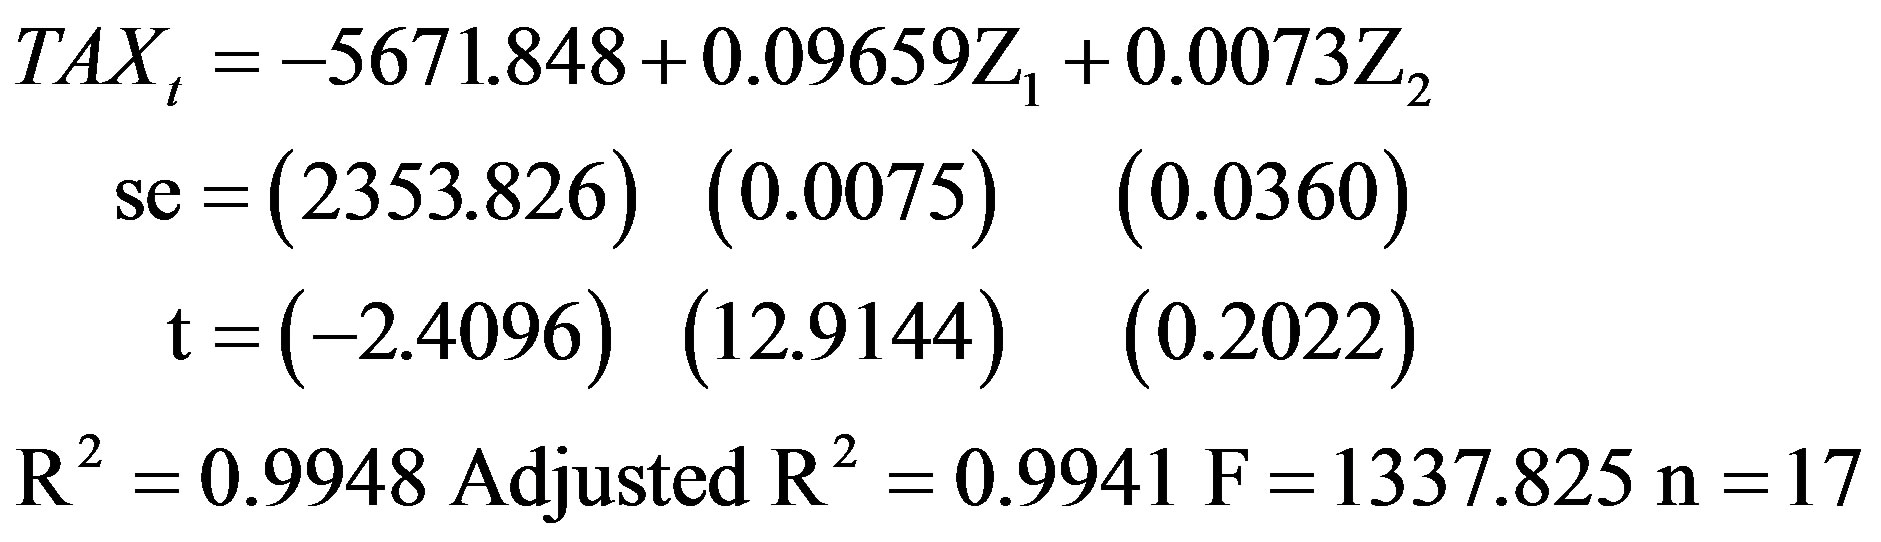
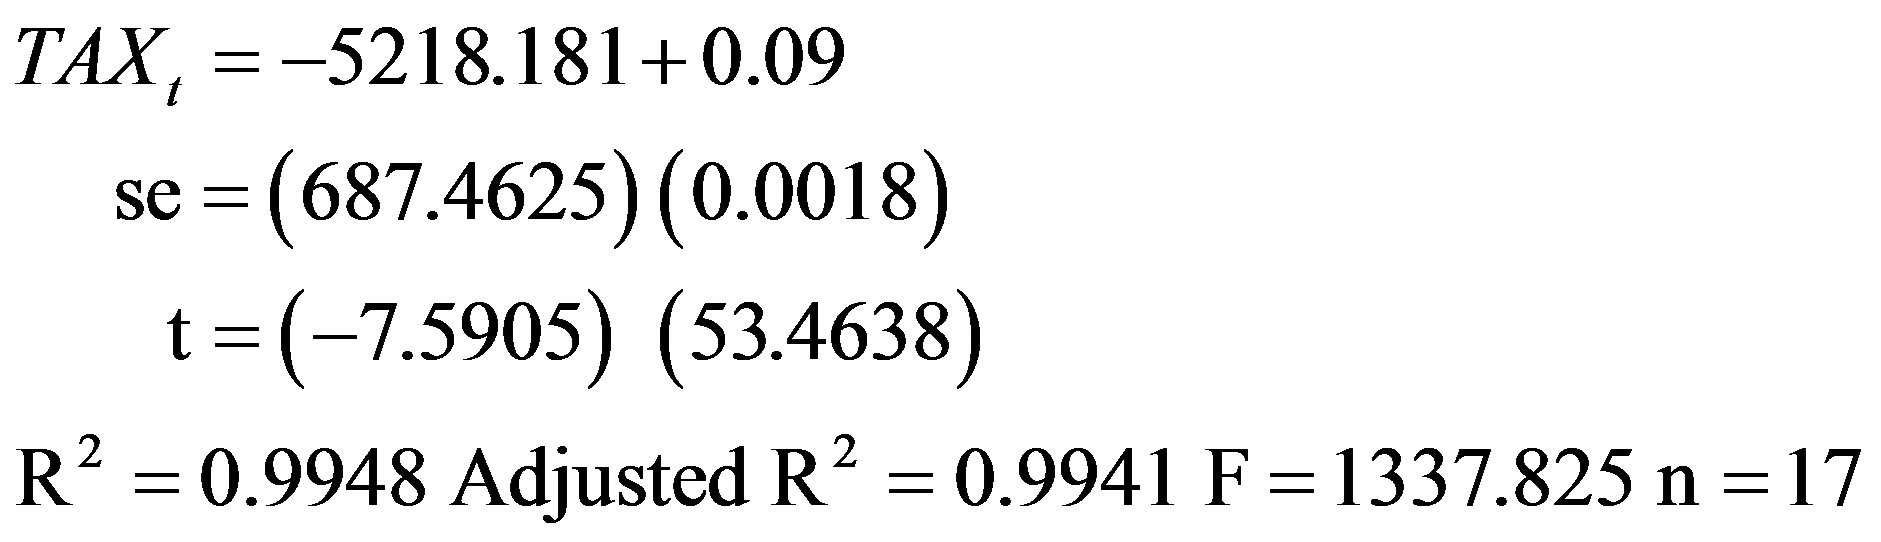
As we can see that the estimation results are significant overall, but coefficient on Z2 is not statistically significant. Actually the cumulative percentage of the first component reaches 98.39%, which indicates that we can drop Z2 confidently. And the results after dropping Z2 are the following:
As we know that Z1 is the linear estimation of original variables, and it is not a directly observable variable. So in order to investigate the relationship between the change in Z1 and other original variables, we attach the Figure 2" target="_self"> Figure 2 here.
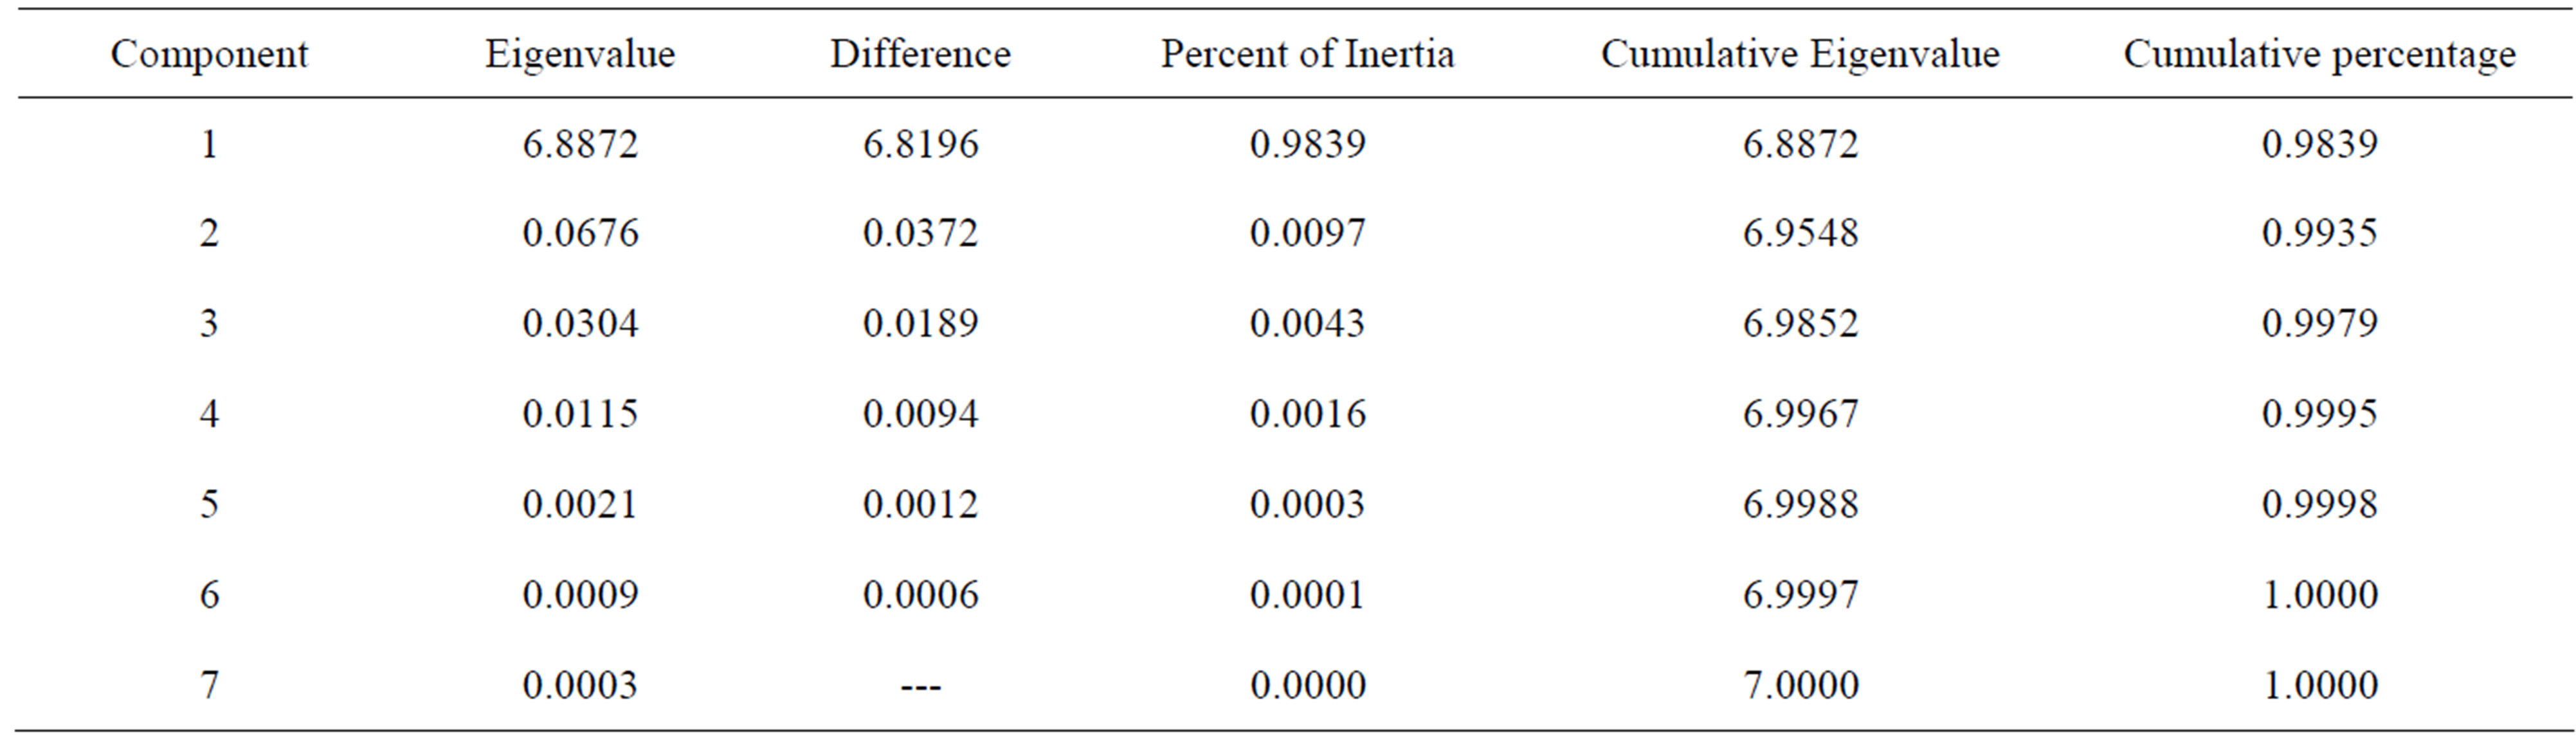
Table 5. Eigenvalues and percentage of explained inertia by each component.
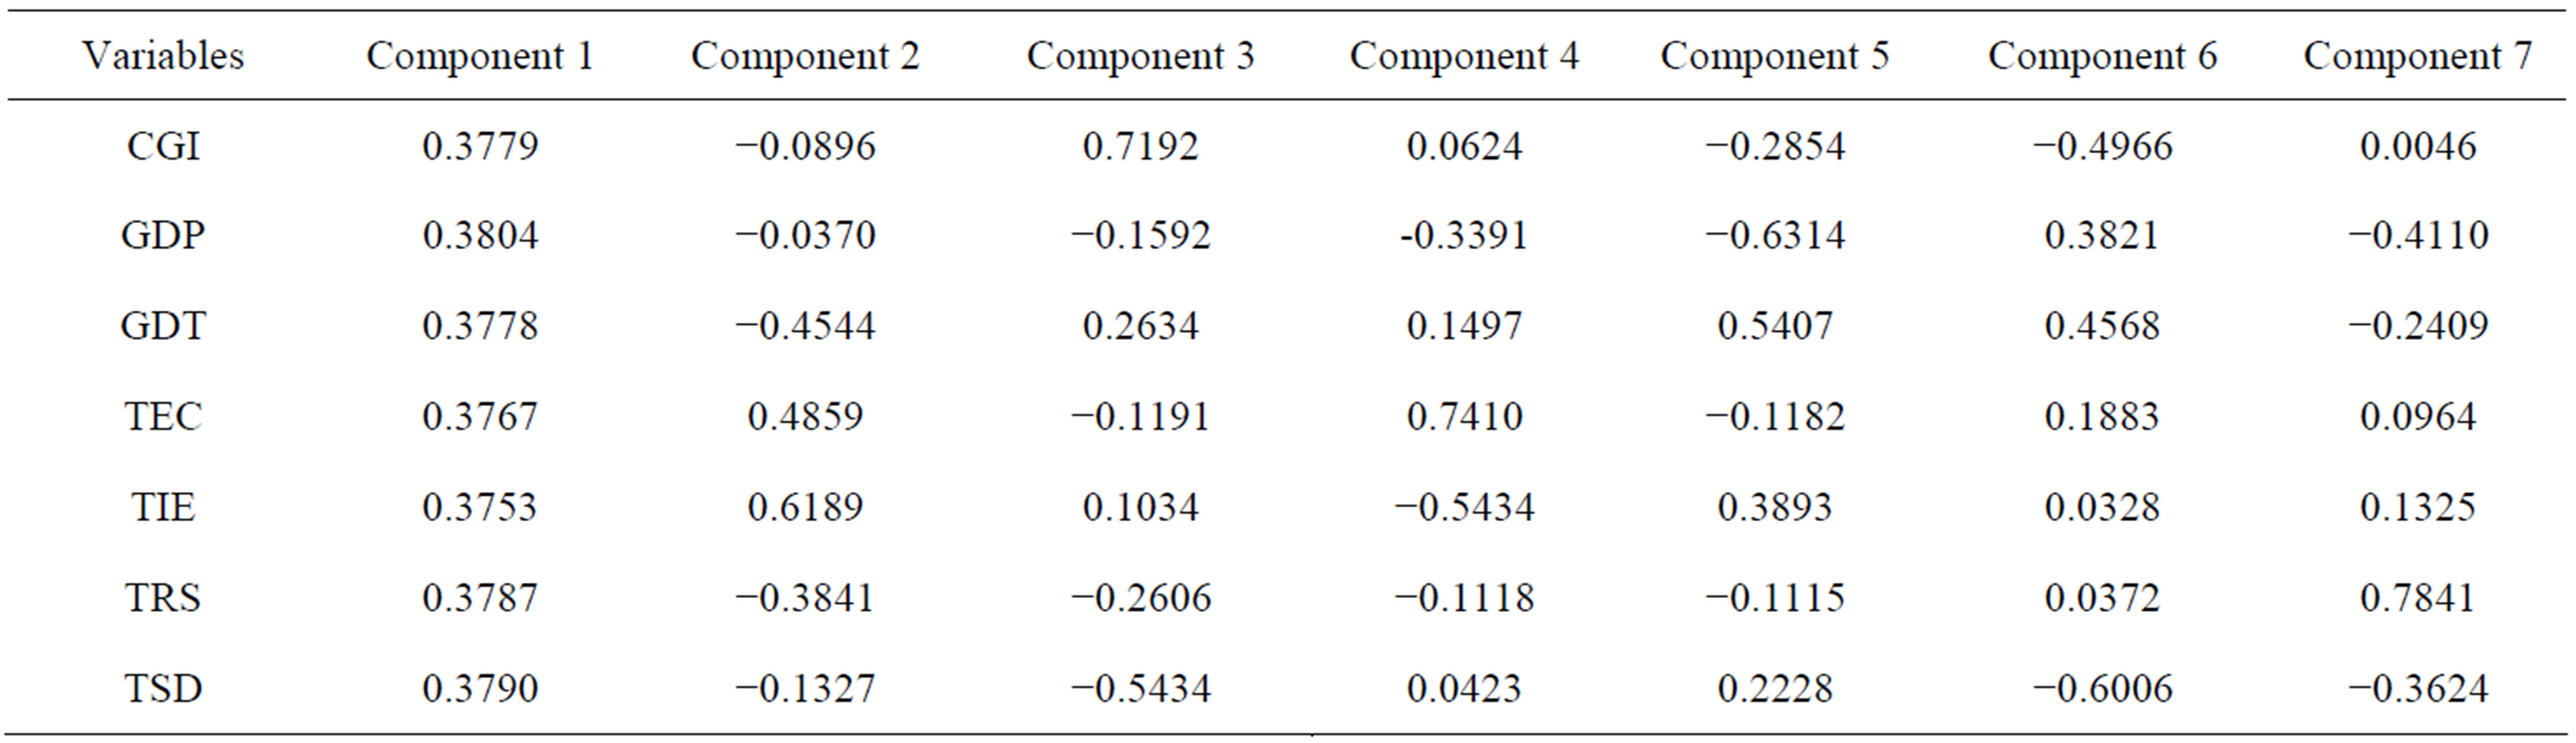
Table 6. Loadings.
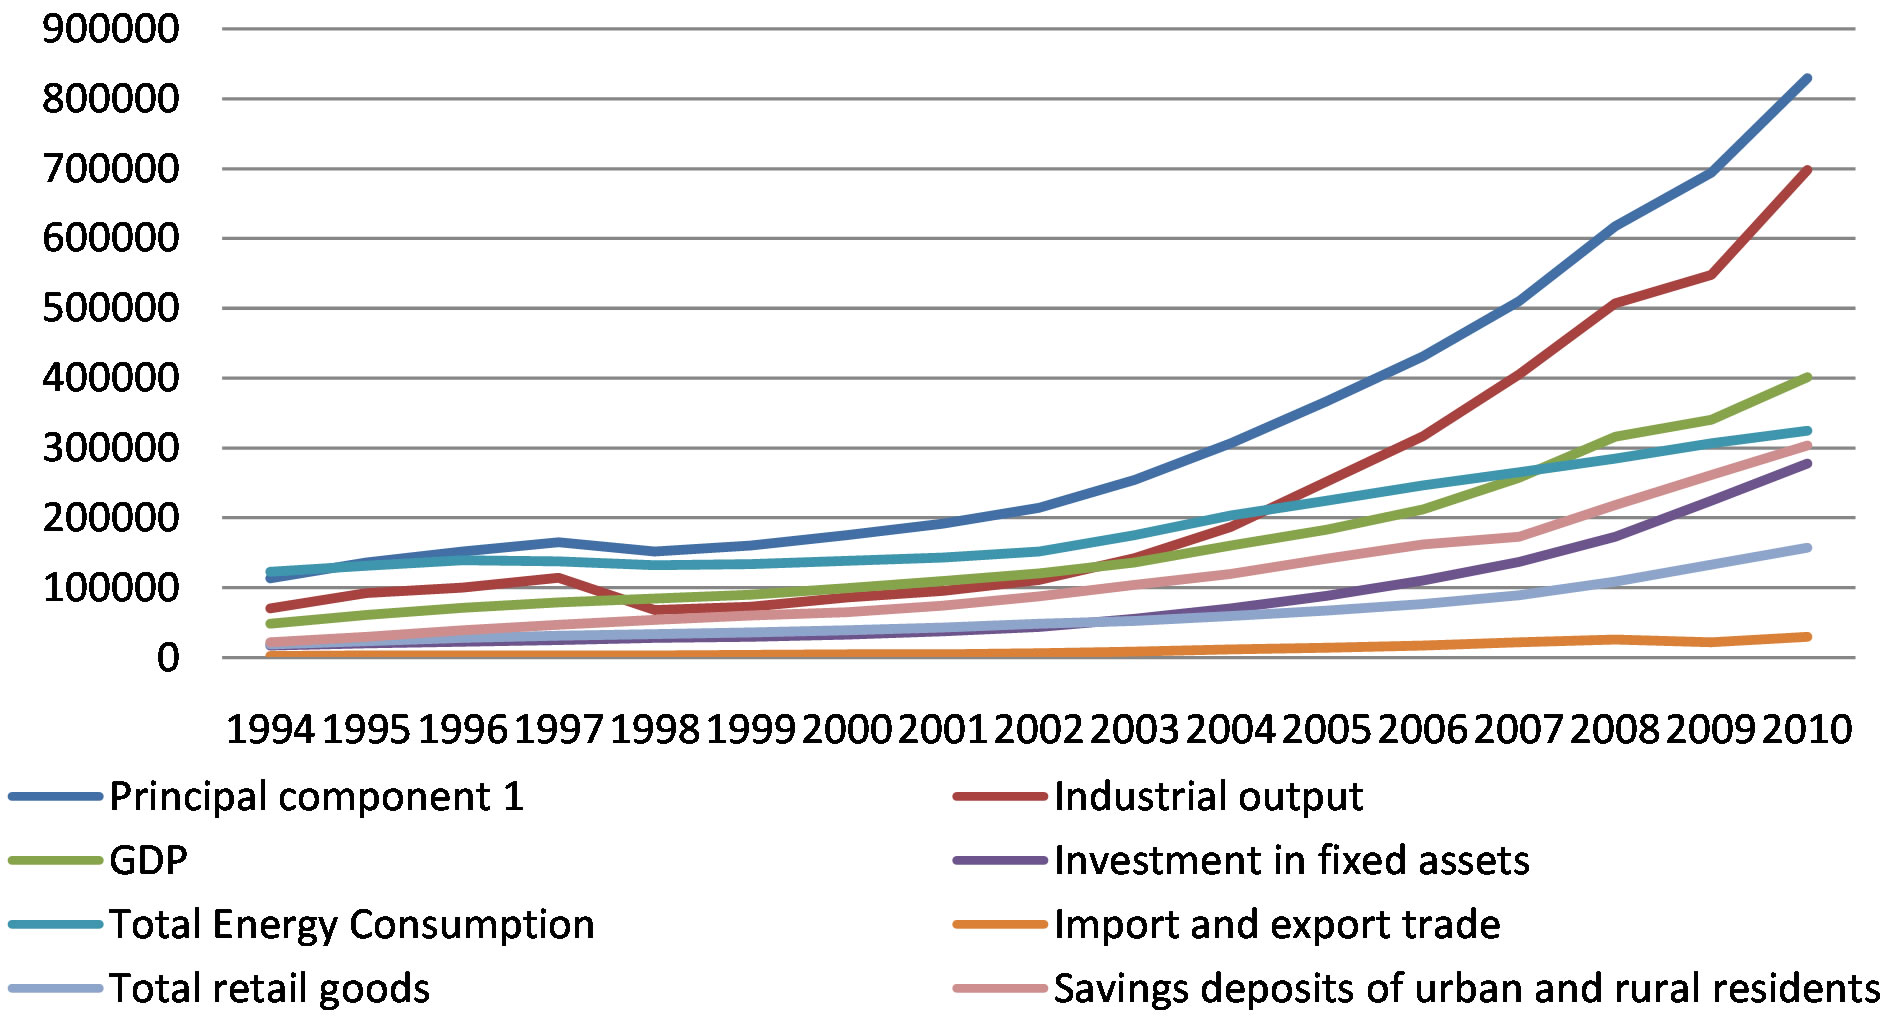
Figure 2. Trends of indicators.
As can be seen from Figure 2, Z1’s trend is consistent with that of total industrial output, so just taking the first component to do the principal component analysis is enough, and the total industrial output shows similar trend with the first component. So we can say that the total tax revenue is highly correlated with the total industrial output. And also the results show that in the 1994’s tax reform, the complex tax system focused on income tax and value-added tax, and the second industry is the main industry to generate tax revenue, in the meantime, total industrial output is the major comprehensive index to reflect the scale of second industry.
Similarly, we move on to study the value-added tax (ZZSt) and corporate income tax (QYSt) and their relationship with components, and Table 7" target="_self"> Table 7 shows the regressions results.
From the results in Table 7, all regressions are feasible. Actually the adjusted R2 of (1) and (3) are higher than that of (2) and (4) respectively. So the combination of component 1 and component 2 is closer to value-added tax than just component 1. Similarly combination of component 1 and component 2 is closer to commercial tax than just component 1.
The same with Z1, Z2 is estimated by using original variables, and it is a comprehensive variable rather than an observable variable. So we apply the same steps to Z1 to figure out which indicator’s trend is closer to Z2. Here Figure 3 shows the trends of different indicators.
From this figure, we can see that during 1994-2006, the trend of component 2 lies close to the line of international trade. But after 2006, the line of component 2 goes down unlike other indicators. So, if we only use component 2 as the explanation variable for value-added tax and corporate income tax, the results are not as better as using both component 1 and 2.
Compared to Figure 2, the trends of component 1 and total industrial output are more alike, but there are big differences between component 1 and other original variables. Similarly, component 2’s change is consistent with that of international trade, and inconsistent with other original variables. So the linear combination of component 1 and component 2 can reflect the trend of original variables which represent the change in economy, so regression (1) and regression (3) are better than regressions (2) and (4).
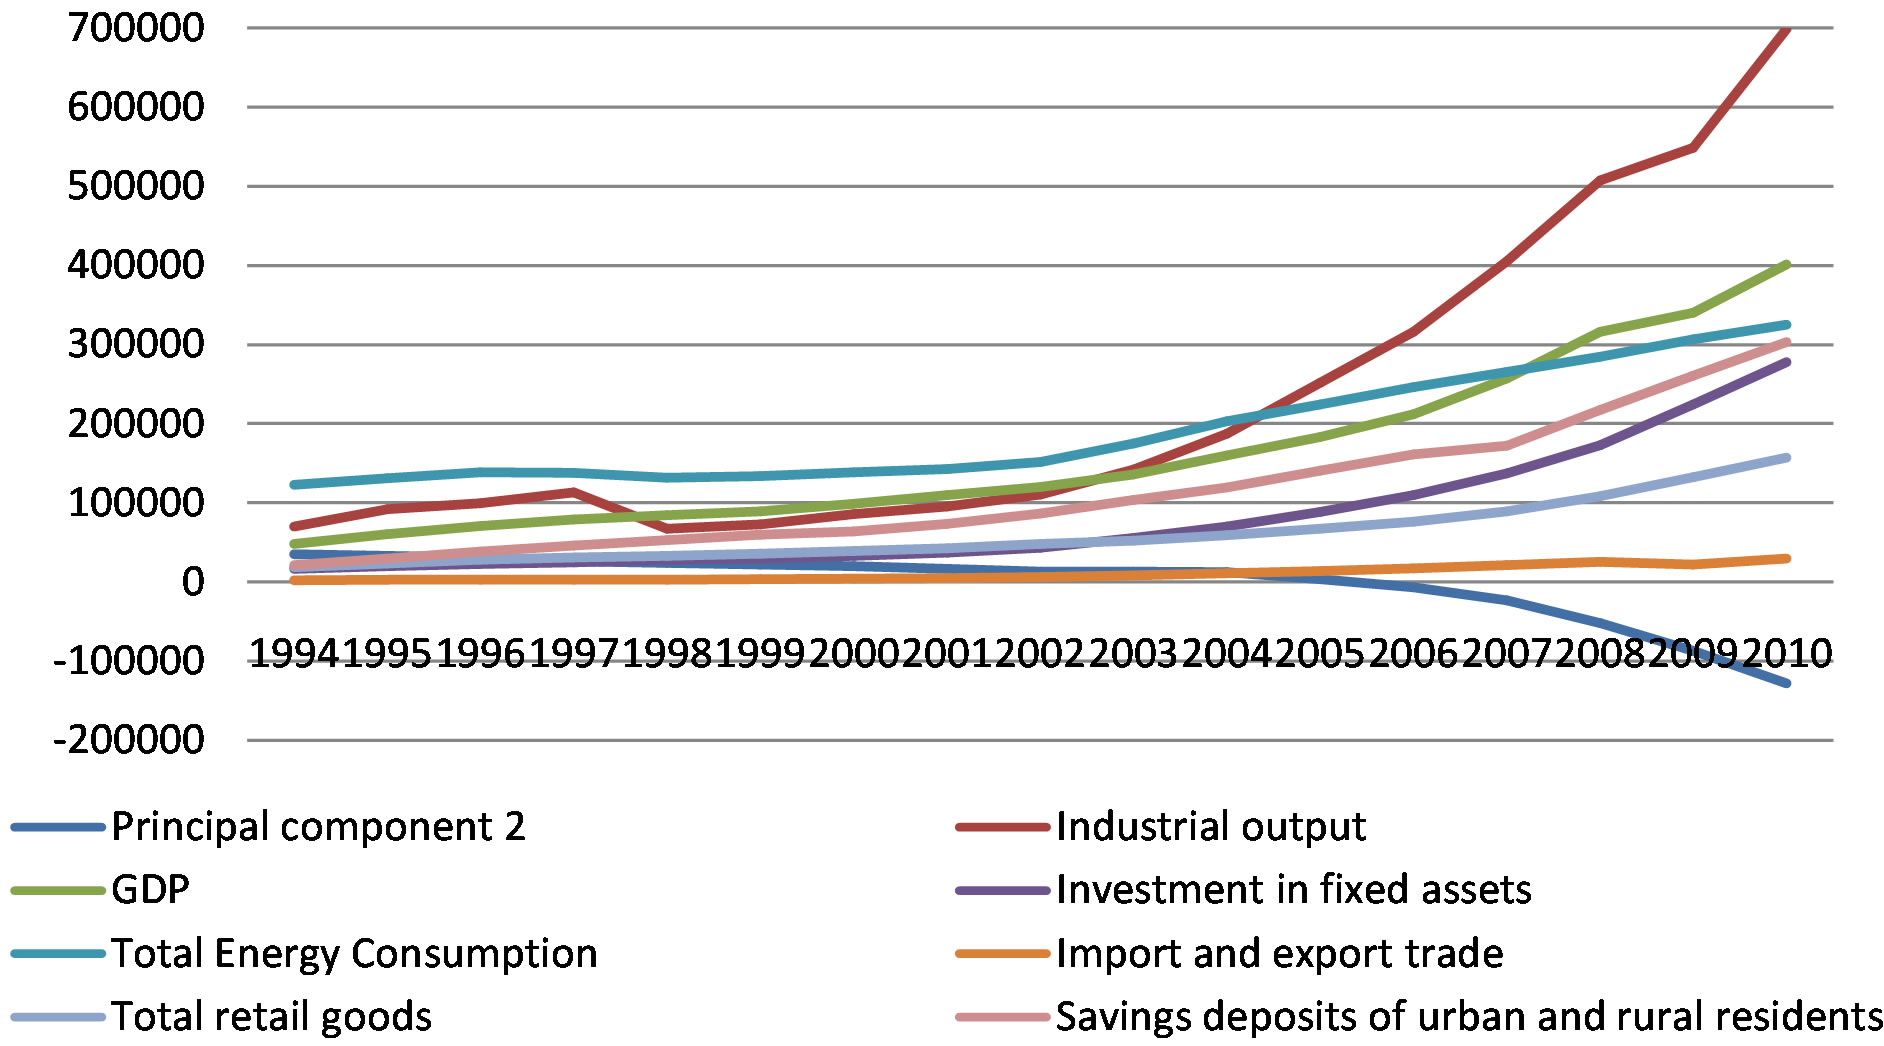
Figure 3. Trends of indicators.
To further identify the original variables’ effects on the total tax revenue, VAT and corporate income tax, we run regressions of total tax revenue, value-added tax and corporate income tax on the original variables rather than regressions on components regarding components are linear combination of original variables. And the results are showed in Table 8.
Look at the table above, in the regression (5), the coefficients on independent variables are similar, but the coefficient on GDP is the greatest, which means GDP has contributed the most to the tax revenue. In the regression (6) and (7), coefficients on variables are not quite similar.
5. Conclusions
This paper studied the effects of economic growth and tax reform on the total tax revenue and change in its
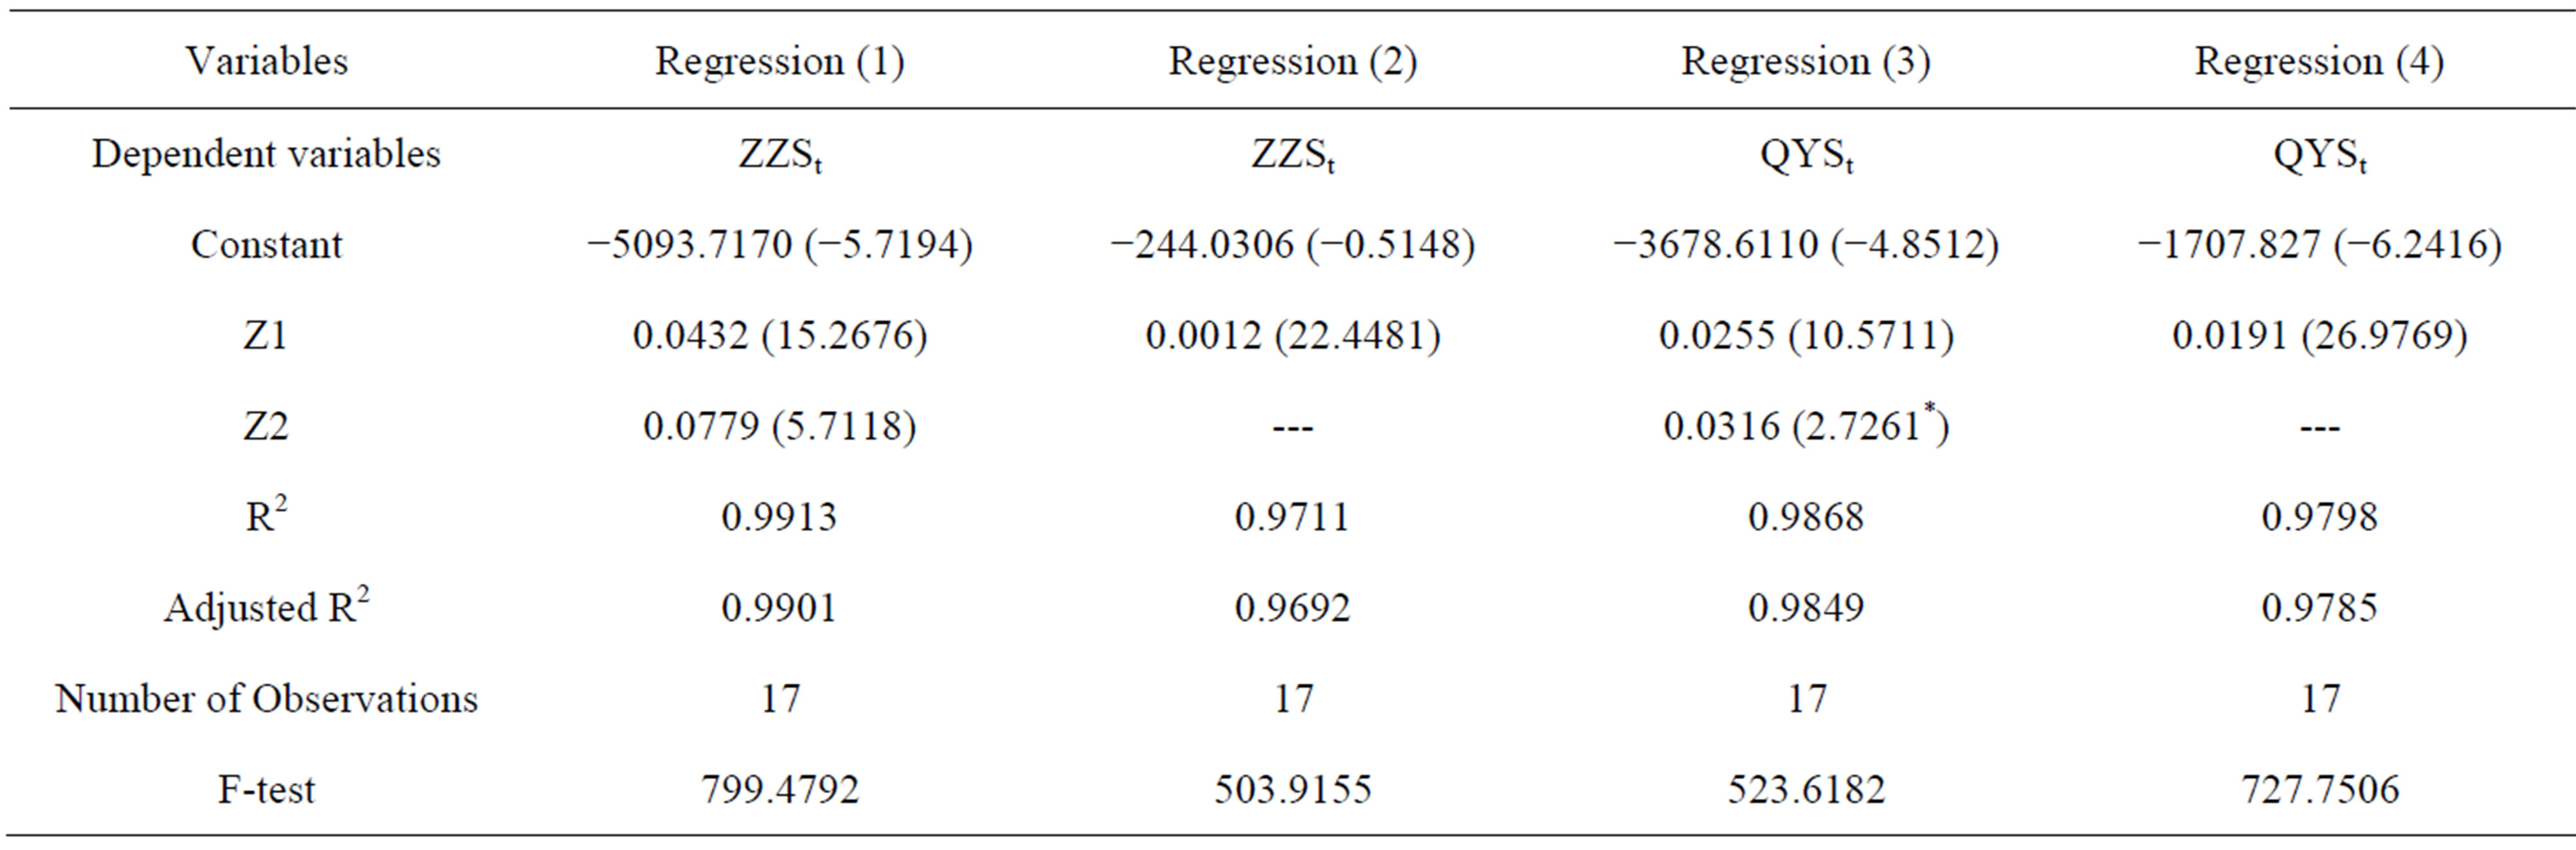
Table 7. Estimation results of regressions.
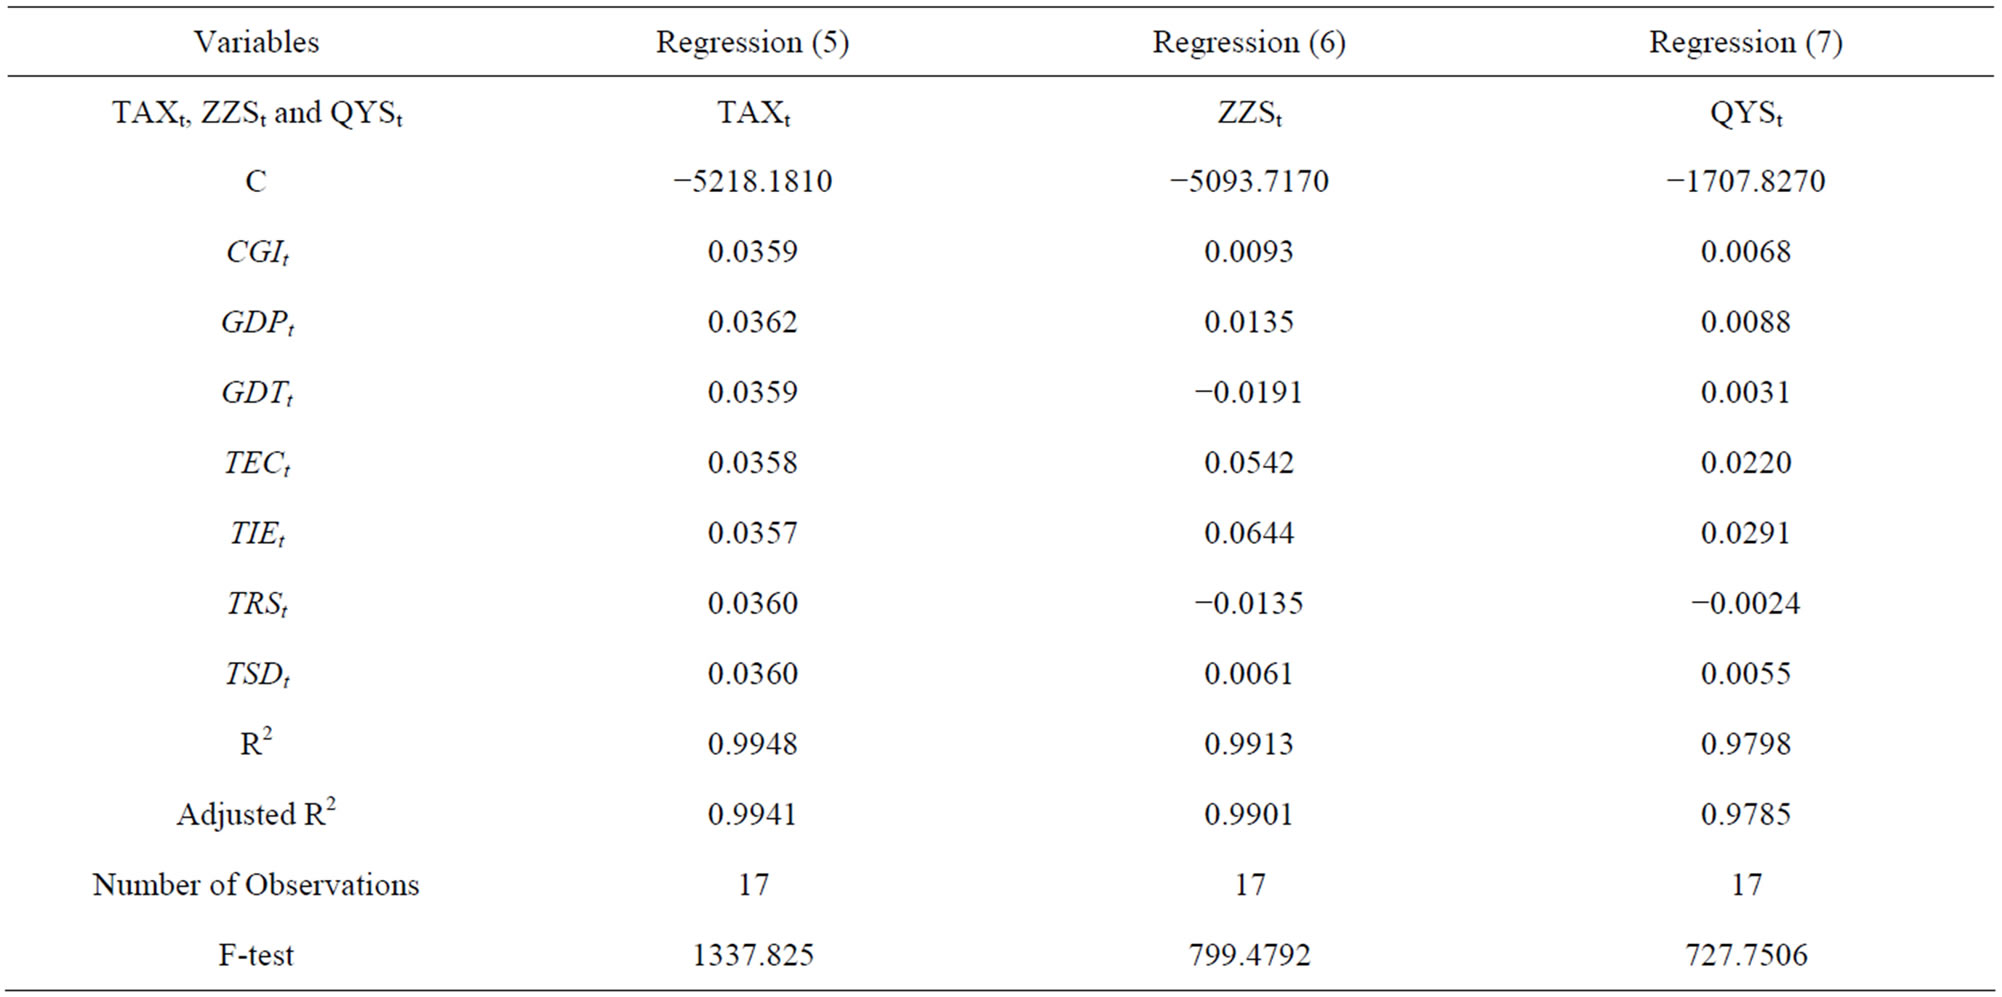
Table 8. Regressions of total tax revenue, value-added tax and corporate income tax on other original variables.
structure, and we summarize the main points as the following:
1) The results of multi-segment regression show that the slope of regression about tax revenue and GDP changed after each tax reform, which means tax reform did change the relationship between tax revenue and GDP, and this conclusion has been verified by the descriptive statistics.
2) In the principal component analysis about tax revenue, the first principal component contributes 98% to the tax revenue, while the total industrial output affects the first principal component mainly. In the principal component analysis about value added tax, using component 1 and component 2 to explain the change in value-added tax is reasonable, and so is the analysis about corporate income tax. Actually, the first component is the main reason for the change in value-added tax and corporate income tax, and the second component adjusts the results.
3) Economic growth has effects on the total amount of tax revenue and structure in the short run. In the long term, the relationship between the growth of total tax revenue and economic growth is stable, and there is no tax extraordinary growth situation. Tax reform’s effects on the tax structure are obvious, but its effects on the total amount of tax revenue decline over time. Tax reform is conducive to optimize the tax system, which can be confirmed by the fact of the growth rate tax revenue. Actually, the process of tax reform is a tax optimizing process, and many factors affect the tax reform, but this paper suggests that the economy and tax system itself will play an impartment role. Tax reform is conducive to promote economic growth, and economic growth is also beneficial to the increase in tax revenue. Therefore, economic growth, tax reform and the growth of revenue are highly related. Research shows that China’s tax reform has improved the growth of economy, but the effects were different during different time periods. The tax reform leads to the obvious change in the components of tax structure in the short term, but its effects go stable over time.
REFERENCES
- China’s Tax Revenue Report Committee, “China’s Tax Revenue Report 2002-2003,” China Public Financial Economics Press, 2003.
- Q. W. Guo and B. Y. Lv, “Negative Effects of Tax Revenue Growth on Economic Growth,” Economics Theory and Economic Management, Vol. 18, No. 8, 2004, pp. 18-23.
- G. J. Fu, “Statistics and Econometrics Analysis of China’s Tax Revenue,” China’s Market Press, 2005.
- X. F. Li, T. M. Gao and Y. F. Liang, “Econometrics Analysis on Tax Revenue and Expenditure Policy’s Dynamic Effects on Output,” Financial Economics, Vol. 26, No. 2, 2005, pp. 32-39.
- G. Jin, “Optimal Tax Revenue and Public Financial Expenditure in Economic Growth,” Economic Research, Vol. 45, No. 11, 2010, pp. 35-47.
- C. P. Chamley, “Optimal Taxation of Capital Income in General Equilibrium with Infinite Live,” Econometrica, Vol. 54, No. 3, 1986, pp. 607-622. http://dx.doi.org/10.2307/1911310
- R. J. Barro, “Government Spending in a Simple Model of Endogeneous Growth,” The Journal of Political Economy, Vol. 98, No. 5, 1990, pp. 103-125. http://dx.doi.org/10.1086/261726
- P. Y. Gao, “The Mystery of Rapid Growth of China’s Tax Revenue,” Economic Research, Vol. 2, 2006.
- X. R. Xie, “China’s Financial Management,” China’s Financial Economic Press, 2011.
- G. W. Scully, “Optimal Taxation, Economic Growth and Income Inequality,” Public Choice, Vol. 115, No. 3/4 2003, pp. 299-312. http://dx.doi.org/10.1023/A:1024223916710
- R. Chetty and E. Saez, “The Effects of the 2003 Dividend Tax Cut on Corporate Behavior: Interpreting the Evidence,” The American Economic Review, Vol. 96, No. 2, 2006, pp.124-129. http://dx.doi.org/10.1257/000282806777211838
- W. F. Blankenau, N. B. Simpson and M. T. Source, “Public Education Expenditures, Taxation, and Growth: Linking Data to Theory,” The American Economic Review, Vol. 97, No. 2, 2007, pp. 393-397. http://dx.doi.org/10.1257/aer.97.2.393
- M. Battaglini and S. Coate, “A Dynamic Theory of Public Spending, Taxation, and Debt,” The American Economic Review, Vol. 98, No. 1, 2008, pp. 201-236. http://dx.doi.org/10.1257/aer.98.1.201