Journal of Environmental Protection
Vol.08 No.02(2017), Article ID:74470,23 pages
10.4236/jep.2017.82014
Growth Characteristics of Fuirena umbellata in a Surface Flow Constructed Wetland and Its Influence in Nutrients and Faecal Bacteria Removal from Domestic Wastewater in Cameroon
Martin Lekeufack1, Théophile Fonkou1*, Etienne Pamo Tedonkeng2
1Laboratory of Applied Botany, Department of Plant Biology, University of Dschang, Dschang, Cameroon
2Laboratory of Animal Feeding and Nutrition, Department of Animal Production, University of Dschang, Dschang, Cameroon

Copyright © 2017 by authors and Scientific Research Publishing Inc.
This work is licensed under the Creative Commons Attribution-NonCommercial International License (CC BY-NC 4.0).
http://creativecommons.org/licenses/by-nc/4.0/


Received: January 17, 2017; Accepted: February 25, 2017; Published: February 28, 2017
ABSTRACT
Various configurations of vegetated bed systems with a variety of macrophytes have been tested experimentally in Cameroon, for the treatment of domestic wastewater. The aim of this work was to assess the growth and biomass production of Fuirena umbellata (Cyperaceae) and its potentials in the removal of faecal bacteria and nutrients from primarily treated domestic effluent. A wetland vegetated with this macrophyte and a non-vegetated wetland (control) were continuously fed with primarily treated domestic wastewater at an estimated loading rate of 205 Litres/day in dry and rainy seasons for two consecutive years. Physicochemical and microbiological parameters of the effluent were monitored at the inflow and outflows of the wetlands alongside with the growth and productivity attributes of the young plants during each season. The density of plants ranged in the wetland from 17 - 185 plants/ m2 and from 11 - 146 plants/m2 respectively during the first and the second years. More biomasses were instead produced in the dry seasons than in the rainy seasons but with no significant differences observed. As for nutrients removal, higher efficiencies were observed in the vegetated wetland (45% - 73%) compared to the non-vegetated control (17% - 66%). Similar trends were observed for the faecal bacteria but with no significant differences between the seasons. However, the vegetated beds were significantly more efficient than the non-vegetated control in the reduction of many physicochemical parameters and faecal bacteria. This varied with the seasons.
Keywords:
Growth Characteristics, Fuirena umbellata, Nutrients, Faecal Bacteria,Removal, Surface Flow Wetland, Local Macrophyte

1. Introduction
Environmental pollution is one of the major constraints in developing countries. This is due to the lack of adequate services for the evacuation and treatment of wastewater, coupled with the rapidly expanding population and increasing industrialisation especially in the cities [1] [2] [3] [4] . The absence of treatment services may be linked to the high cost involved in the maintenance of the treatment installations [5] .
Vegetated bed systems (VBS) are used all over the world as cost effective alternative for wastewater treatment [5] [6] . They are engineered systems constructed to mimic the natural processes in wetlands and to exploit them artificially for wastewater treatment [7] and [8] . The presence of macrophytes provides large surfaces for microbial growth and attachment, uptake nutrients and adds oxygen into the rhizosphere for biodegradation [9] [10] [11] . They produce high biomass which is an added advantage to the water quality improvement and this can be valorised as food, medicine, biofuel, paper, organic fertilizer in compost, and reserved as fodder for animals in the dry season [12] [13] [14] .
In improving the water quality in constructed wetlands, macrophytes degrade pathogens or help in their mitigation through the support that they offer to the naturally occurring micro-organisms in the substrate [5] . However, the processes involved in bacteria reduction/removal mechanisms are numerous. These include natural die-off, predation, ultra violet radiations on the cell wall of bacteria, oxygen leakages from the roots of macrophytes, bactericidal substances secreted by roots as well as the antibiotic properties of some bacteria living in the rhizosphere [15] [16] [17] . However, the plants species used for this ecotechnology are not easily transferable from one geographical region to the other since plants and animals species vary with varying climatic conditions [18] [19] [20] . In Cameroon, many studies have been carried out to test the potentials of local macrophytes (of the family Poaceae) on the ecotechnology of VBS following their natural presence in polluted or unpolluted wetlands. These potentials included biomass production in vegetated bed systems, their ability in faecal sludge dewatering improvement as well as biosolids recovery, their responses to salinity stress, the nutritional potentials as fodder after harvest from treatment beds as well as their potentials in the removal of bio-indicators of faecal contamination from wastewater [14] [17] [21] [22] [23] [24] [25] . But there has been no concern on the ability of Fuirena umbellata on biomass production in constructed wetlands, nutrients removal and in the reduction of bio-indicators of faecal contamination from wastewater, despite its presence and proliferation in natural polluted and non-polluted wetlands.
Therefore, this work focuses on the growth and biomass production of Fuirena umbellata (Cyperaceae) and its potentials in the removal of faecal bacteria and nutrients from domestic wastewater.
2. Material and Methods
2.1. Site of Study
This study was conducted in a Yard-Scale constructed wetlands system (CWs) at the exit of an abandoned conventional treatment plant and constantly receiving domestic liquid wastes from students’ residence in Dschang University campus. Dschang is located between latitudes 5˚25'N and 5˚30'N and between longitudes 10˚00'E and 10˚5'E in the Western Highlands of Cameroon (Figure 1).
The climate in this region is of equatorial type with 4 months of dry season found between mid-November to mid-March, and 8 months of rainy season between mid-March to mid-November. Annual precipitations are estimated to range between 1433 mm and 2137 mm, while annual mean temperature is estimated at 20.8˚C with thermal amplitude of 2˚C. The wastewater used in the study was collected from a small primary treatment plant receiving domestic liquid wastes by simple gravitation from the students’ residence, situated at some 650 m from the treatment station all within the University campus. Part of the primarily treated wastewater was channelled into a 1.3 m3 gutter from where it was distributed to the experimental wetlands using polyvinyl chloride (PVC)
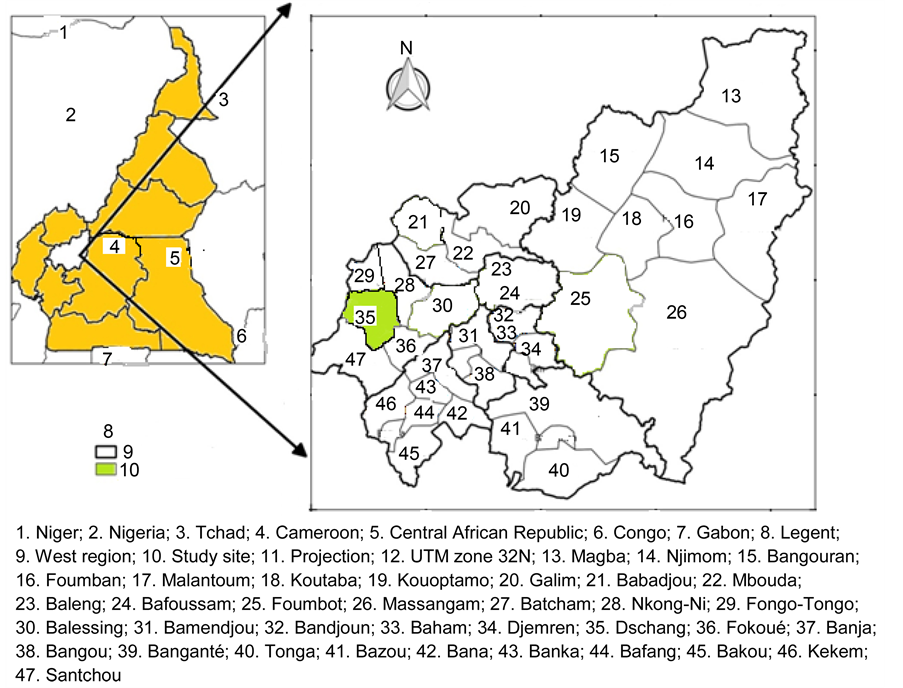
Figure 1. Location of the site of study (modified from “Centre de Recherche sur les Hautes Terres” (CEREHT) of the Department of Geography, University of Dschang).
pipes.
2.2. Design of the Experimental Wetlands
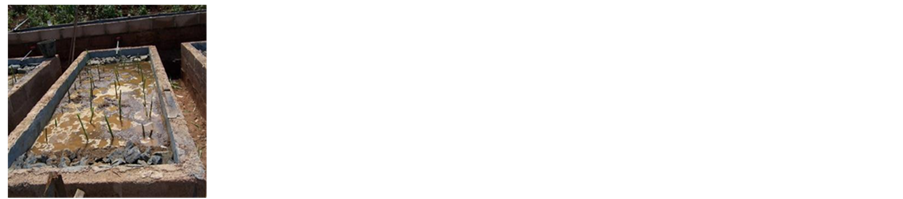
Five wetlands (CW1, CW2, CW3, CW4 and CW5) of 3 × 1 × 0.6 m3 were constructed using cement blocks (Figure 2). The insides of the structures were plastered with concrete, then Cement and LankofugeTM for water tightness. A 1% slope was respected at the bottom of each wetland bed to ease the movement of water from the inflow to the outflow. Gabions of 30 cm thickness made up of stones of 5 - 8 cm diameter were arranged at the inflow and outflow zones of the wetlands, while a drainage layer of about 10 cm was arranged at the bottom for particles sedimentation. The main filter substrate was a 40 cm column of sand having particles size < 2 mm (Figure 3). The outflow structures were made
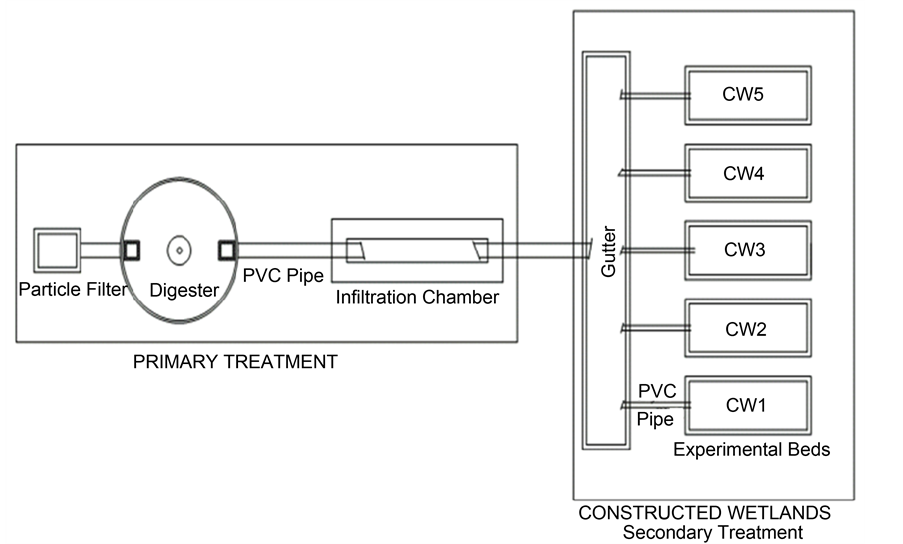
Figure 2. Setup of the experimental wetland system (PVC: Polyvinyl chloride; CW: Constructed wetland).
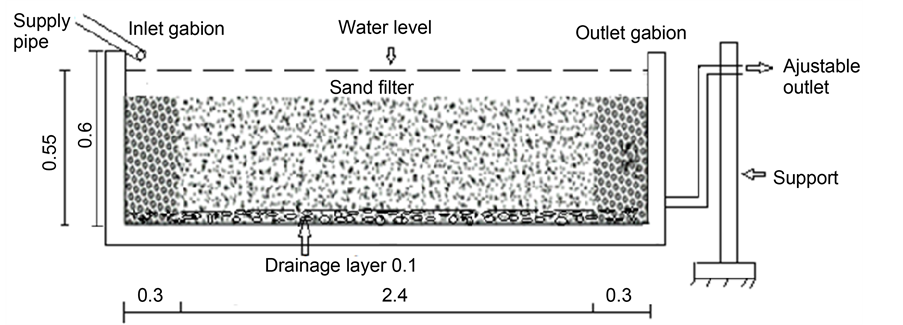
Figure 3. Longitudinal section of the horizontal surface flow wetland.
adjustable to enable the regulation of the water level in the substrate. Results presented in this paper are those of CW2 that was vegetated with Fuirena umbellata and CW3 that was used as the non-vegetated control wetlands. The adjustment of the inflow rate was estimated at 256.29 Litres/day. The bed capacity measured from the porosities of the gabion and the sand filter was estimated at 923 Litres. The hydraulic retention time (HRT) of 3.6 days was then calculated from the equation, as stated by [26] . The constructed wetlands served as a secondary treatment associated to the existing primary treatment in which only the particle filter and the digester were still functioning.
2.3. Setting up of the Experiment
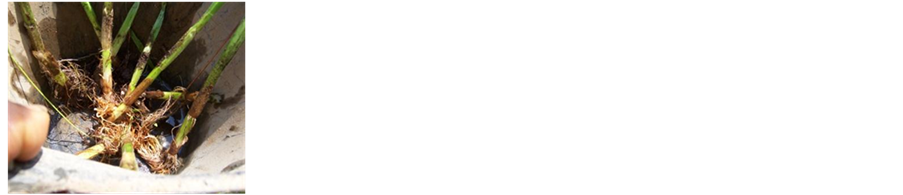
Young shoots of Fuirena umbellata were collected from the natural wetland and washed in fresh water (Figure 4(a)). After weighing, the young shoots were planted in CW2 at a density of 14 shoots/m2 (Figure 4(b)). Primarily treated effluent from a conventional treatment plant was collected in a gutter and allowed to directly flow into the wetlands (CW2 & CW3) at organic loading rates varying from 20.74 to 27.15 g BOD/m2/day in dry season and the rainy season for two consecutive years. The characteristics of the primarily treated effluent are presented in Table 1 and Table 2. After a 2 months domestication period during
 (a) (b) (c)
Figure 4. Aspects of Fuirena umbellata shoots (a), vegetation in the wetland after planting of young shoots (b) and at the start of the performance analysis (c).

Table 1. Physicochemical characteristics of the primarily treated effluent used in the constructed wetland (mean ± Standard error of mean (SEM), n = 26, CND: Electrical conductivity).
Table 2. Average counts (log10 units CFU/100ml) of faecal contaminant indicators (Total coliforms, TC; Faecal coliforms, FC; and Faecal streptococci, FS) in the primarily treated effluent used in the constructed wetland (mean ± Standard error of mean (SEM), n = 24).
which the shoots grew to a standing vegetation considered having good biological activity (Figure 4(c)), wastewater was allowed to flow continuously into the bed at a Hydraulic Loading Rate (HLR) of 85.43 L・m−2・day−1 in a horizontal surface flow (HSF) configuration. At the end of each season of the year, the plants were harvested when 50% were observed to have flowered in the bed and the biomass measured using a scale and an electronic balance.
2.4. Measurement of Growth Characteristics of Macrophytes
The height, number of leaves and density of plants were determined at intervals of two weeks throughout the experimental period. During each season of the year, the plants were harvested and weighed when at least 50% of them were observed to have flowered in the bed. Before harvest, the level of water in the wetland was reduced to the root zone (subsurface) to avoid rotting of the herbaceous stubs. This was reinstalled when the young shoots arose.
2.5. Water Sample Collection and Faecal Bacteria Analyses
Water samples were collected at intervals of two weeks from November 2009 to October 2011 from the inflow and the outflow of the non-vegetated control and that vegetated with F. umbellata. Sterile laboratory glass bottles of 500 ml were used to collect water samples that were immediately transported in a cooler for analyses. In the laboratory, manipulations were carried out in strict conditions of sterility. In aseptic conditions, 1 ml of homogenous raw sample was measured and added into 9 ml of sterile distilled water to have 1:10 dilution. This same operation was repeated from the first dilution until the desired dilution was obtained (1:10, 1:100, 1:1000, 1:10,000, etc.). A pipette was used for each sample and was always rinsed between dilutions to avoid contamination from one dilution to the other. The distilled water was sterilized by autoclaving in sealed sterile glass bottles for 15 minutes at 121˚C. Total coliforms, faecal coliforms and faecal streptococci were detected by membrane filtration following standard methods [27] [28] . AC Cellulose Membranes FiltersTM with pore-size 0.45 μm were used on a WHEATON filtering FunnelTM attached to a CM 1500TM vacuum pump.
Appropriate sample volumes, in three different dilutions (10−2, 10−3 and 10−4) for effluent or (10−3, 10−4 and 10−5) for influent were filtered and incubated for each parameter. This was to ensure having at least a plate with colony counts ranging between 20 to 100 CFU [29] . Samples for faecal coliforms were incubated on DifcoTM m FC prepared Agar in Petri dishes at 44.5˚C for 24 hrs [30] [31] . Thereafter, all characteristically blue and central white hollowed blue colonies were counted as faecal coliforms.
Samples for faecal streptococci and total coliforms were respectively incubated on BBLTM Bile Esculin and Tergitol® 7 Agars at 35˚C for 48 hrs [30] . Thereafter all characteristically black and yellow colonies were respectively counted for faecal streptococci and total coliforms. Each result was expressed as number of Colony Forming Units per 100 ml (CFU/100ml) of sample.
2.6. Measurement of Physicochemical Parameters
The physicochemical parameters including total suspended solids (TSS), Nitrates, Orthophosphates, Chemical Oxygen Demand (COD), and 5-days Biochemical Oxygen Demand (BOD5) were measured according to procedures described by [32] . The percentage reduction of each parameter in the bed was obtained using formulae below:

where: Ci = inflow value; C0 = outflow value.
The treatment efficiency of the planted bed was compared with that of the control bed using the unpaired, one-tailed T-test. The Student’s T-test was performed at 0.05% probability level to compare the means of the parameters measured at the inflow and the outflows of the wetlands. As concerns microbial population density, data were log10 transformed to obtain the geometric means. The means as well as the standard error of mean (SEM) values were obtained from the column statistics of each raw data set using Prism. 4 software at 5% probability level.
3. Results and Discussion
3.1. Changes in Density and Height of Plants in the Bed
Of the thirty-two young shoots of F. umbellata transplanted in CW2, 27 of them survived one month after transplanting, giving about 84.38% survival rate. These young shoots immediately entered into the leafy phase where they grew and multiplied rapidly presenting almost a linear growth relationship in trend. The growth and multiplication produced a population density of about 206 plants/m2 at the end of the dry season of the first year when more than 50% of the plants in the wetland flowered (Figure 5(a)), giving a proliferation rate of about 0.042 plants/day. In the rainy season, the young shoots which arose after the dry season harvest grew rapidly without any inconveniency and covered the entire bed. At the start of parameters measurement, the density of plants in the wetland was 106 plants/m2 and progressed to a density of 185 plants/m2 at the end of the season. This followed a similar trend as in the dry season but the proliferation rate dropped to about 0.0072 plants/day. In the second year when the plants were harvested to mark the end of the first year, the few new shoots which arose, dotted here and there in the wetland slowly colonized the entire wetland. The density
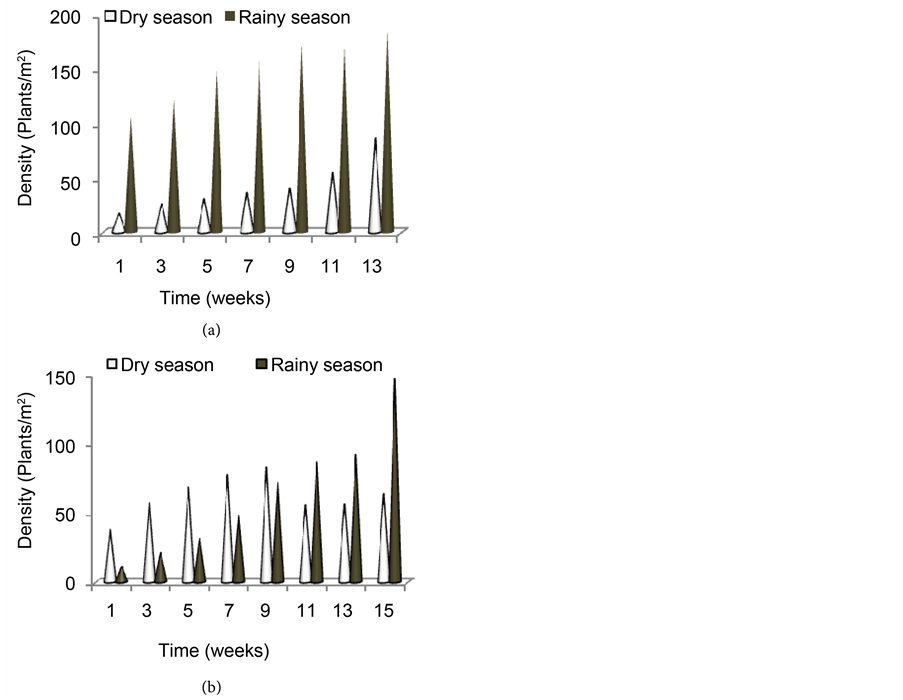
Figure 5. Evolution of plant density in the bed during the dry and the rainy seasons of the first year (a) and the second year (b).
was lower compared to the previous year’s dry season. At the start of parameters measurement just one month after harvest, the wetland had a density of only 38 plants/m2. This density increased to 82 plants/m2 after three months of growth and then dropped again to 63 plants/m2 at the end of the dry season when the plants flowered. In the rainy season, the species had a very slow rate of increase in density but, by the end of the season the density in the wetland was by far more than that at the end of the dry season (146 plants/m2) as shown by Figure 5(b). It is also seen that the rate of increase in density was more in the dry season than in the rainy season except towards the end of the rainy season. But statistically, there was no significant difference between the two seasons (P > 0.05).
Figure 6(a) presents the changes in height of F. umbellata in the wetland during the first year of experiment. The height of this species increased very slowly in the dry season, from 0.21 m at the start of parameters measurement to 0.51 m at the end of the season. In the rainy season, the young shoots which arose after the dry season harvest showed very healthy growth with the increase in height presenting almost a linear relationship. This figure clearly shows that the vegetation grew higher in the rainy season than in the dry season. At the time of harvest which marks the end of the rainy season, the tallest plant was
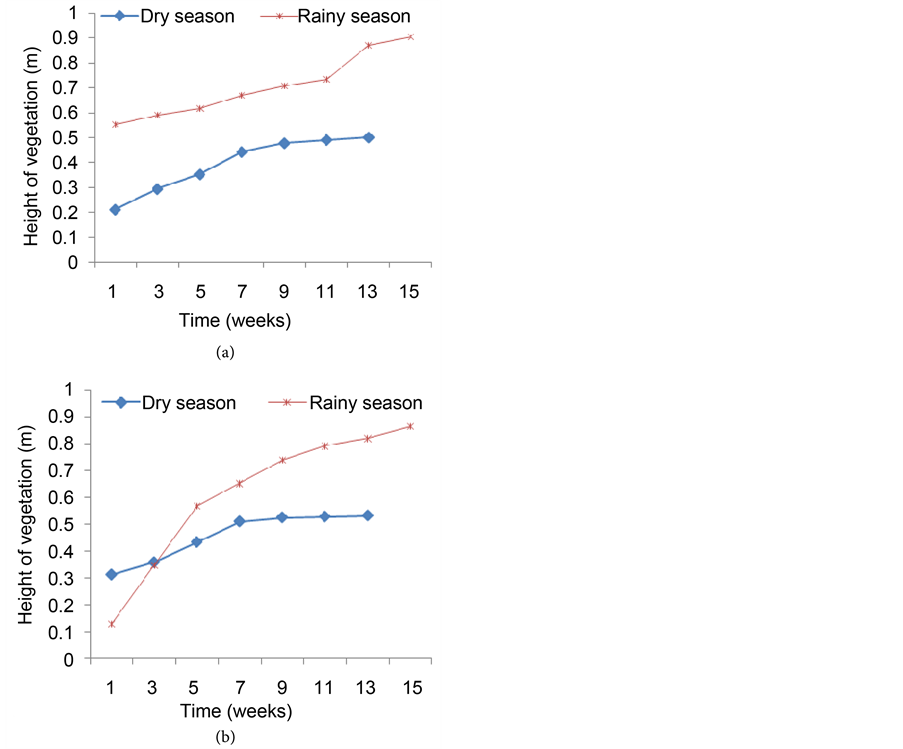
Figure 6. Changes in the height of the vegetation in the bed during the dry and the rainy seasons of the first year (a) and the second year (b).
0.91 m high. In the dry season of the second year after harvesting F. umbellata at the end of the rainy season (first year), very few new shoots arose and grew very slowly. The plants grew almost linearly and after two months of the growth, the growth rate dropped to nearly constant (Figure 6(b)). In the rainy season after the harvest of the dry season, the young shoots which arose grew very rapidly and by the end of the season, the tallest plant was 0.87 m high even though shorter compared with those of the first year’s rainy season.
Plants in the dry seasons flowered earlier than in the rainy seasons and by the end of the dry seasons almost all the plants in the bed had flowered. Moreover, some individuals especially those found near the inflow gabion of the wetland showed stunted growth. These flowered far earlier and at very low heights ranging from 16 - 30 cm only. However, this species in its natural environment rarely attends 0.6 m of height. Generally, all records of plant growth parameters including the number of leaves per plants, leaf length and width and plants density in bed were generally lower during the second year compared to data recorded during the first year in both seasons.
Figure 7 presents the biomass produced at the end of each season throughout the experimentation period. Although plants grew taller and denser in the rainy seasons, it is noticed from this figure that more biomass was produced in the dry seasons than in the rainy seasons. Secondly, the biomass produced during the first year was more than that produced during the second year. However, no significant differences were found between the years and between the seasons (P > 0.05).
These results presented here show that Fuirena umbellata has tolerance potential to the variability and potential toxic effects of the primarily treated domestic wastewater used, since with its dense root system, it grows and multiplies rapidly in an artificial constructed wetland supplied with domestic wastewater [33] [34] . The plants densities and biomass progressively reduced at the end of each season throughout the experimental period but with no significant differences (P > 0.05) observed. This was probably due to the effect of harvest at the end of each previous season [25] . These results however differ from those reported by [35] where, plants density was considerably higher during the next season in response to the harvest of the previous season. The different growth parameters highly dropped during the dry season compared with the corresponding rainy season. This could also be attributed to the aggressive effects of the wastewater in favour of the severe environmental conditions prevailing in the region during the dry season and expressed by the stunting at the inflow of the wetland, in addition with the probable effect of harvest in the previous season. The growth and productivity characteristics of this plant were found to drop from the first year to the second. This could probably be due to the effect of aging as time passes. This difference in biomass between the seasons could be attributed to the high accumulation of water in the tissues constituting only fresh biomass in the rainy season whereas, in the dry season, the environmental conditions are severe with temperature leading to higher transpiration rates so that much of their fresh biomass is due to plant productivity and not accumulated water [13] [28] . This productivity could be related to nutrient availability, especially N and P [36] [37] .
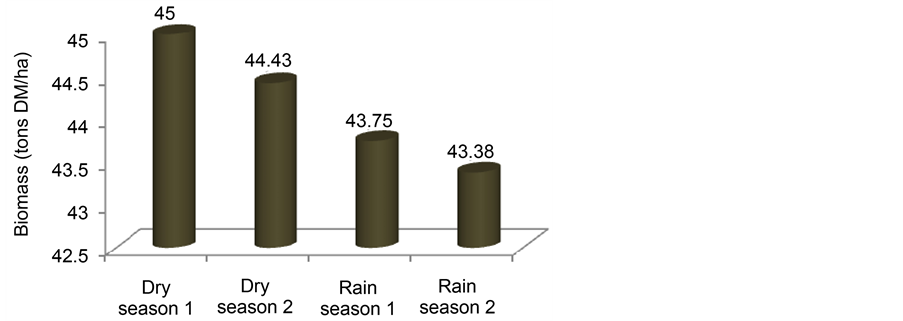
Figure 7. Changes in the dry biomass of Fuirena umbellata at the end of the different seasons during the experimental period.
3.2. Removal of Faecal Bacteria in the Wetlands
Table 3 presents a summary of mean microbial concentrations in the inflow and outflows of the wetlands and the average percent removals during the first year of monitoring. The mean counts of faecal indicators varied generally from 7.5 to 8.2 log units at the inflow, 6.8 to 7.6 and 6.0 to 6.6 log units respectively at the outflows of the control and vegetated wetlands. Compared with the inflow, average reductions of 1.47 and 0.31 log units were respectively observed at the outflows of the vegetated and non vegetated control wetlands during the dry season and 1.03 and 0.45 log units during the rainy season. These correspond to percentage removals ranging from 99% to 79% and from 77% to 11% respectively. From statistical analyses, the counts of faecal bacteria at the outflow of the vegetated wetland were in general significantly less (P < 0.05) from the outflow of the control in both seasons. The most reduced parameter in the vegetated wetland was total coliforms in the dry season while faecal coliforms were the least reduced. In the rainy season, faecal coliforms were the most reduced in the vegetated bed while the least reduced was faecal streptococci. In the control wetland, the most reduced parameters were faecal and total coliforms respectively in the dry and rainy seasons while total coliforms and faecal streptococci were respectively the least reduced in the dry and rainy seasons.
Figure 8 presents the mean reduction of faecal contaminant indicators counts in the wetlands during the first year. Removal efficiencies ranging from 88% to 95% in the vegetated wetland and from 26% to 71% in the control were recorded in the dry season. During the rainy season, 85% to 95% and 24% to 51% removal rates were recorded in the vegetated and control wetlands. Moreover, the vegetated wetlands significantly reduced (P < 0.05) total coliforms and faecal streptococci counts compared with the non-vegetated control in the dry season with average reduction rates of 95% and 98% respectively. No significant differences (P > 0.05) existed between the vegetated and control wetlands as concerns the reduction of faecal coliforms counts (Figure 8(a)). Contrarily in the rainy season, the vegetated wetland significantly reduced all the faecal bacteria counts compared with the non-vegetated control (Figure 8(b)) with reductions of 94%, 85% and 95% respectively for total coliforms, faecal coliforms and faecal streptococci.
Table 3. Mean concentrations (log10 units CFU/100 ml) of faecal contaminants indicators (Total coliforms (T.C), Faecal coliforms (F.C) and Faecal streptococci (F.S)) at the inflow and outflows of the wetlands and the average percent reductions during the first year of experiment.
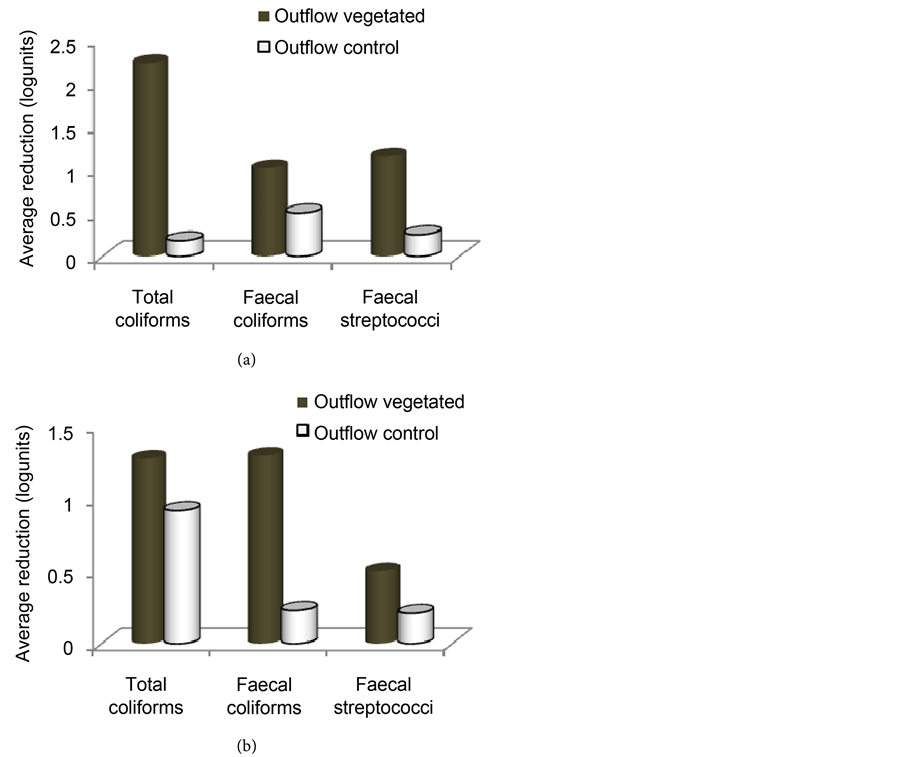
Figure 8. Average reduction of faecal indicators counts in the vegetated and in the control wetlands during the dry season (a) and rainy season (b) of the first year.
During the second year, the removal efficiencies varied from 80% to 89% in the vegetated wetland and from 55% to 63% in the control were recorded in the dry season. The most reduced faecal bacteria indicators were faecal streptococci (89%) followed by faecal coliforms (81%) in the vegetated wetland and faecal coliforms (63%) followed by total coliforms (59%) in the non-vegetated control. However, there were no significant differences (P > 0.05) as concerns the removal of the different parameters within the vegetated wetland during the dry season of the second year. But the vegetated wetland significantly reduced all the three parameters (P < 0.05) compared with the non vegetated control during this dry season of the second year (Figure 9(a)).
In the rainy season, the removal efficiencies varied from 81% to 92% in the vegetated wetland and from 55% to 73% in the non vegetated control. During this season, the removal of parameters in the vegetated wetland presented the same trend as in the dry season. Contrarily in the non vegetated control, the faecal streptococci (73%) were the most reduced parameter followed by faecal coliforms (71%). However, no significant difference (P > 0.05) existed between
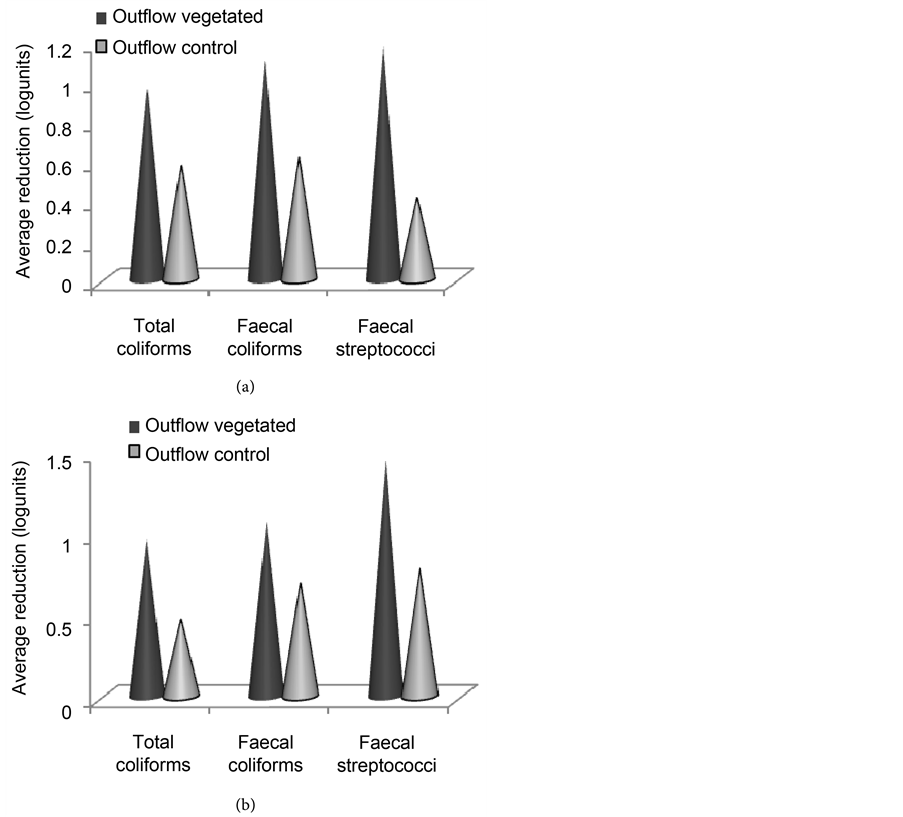
Figure 9. Average reduction of faecal indicators counts in the vegetated and in the control wetlands during the dry season (a) and rainy season (b) of the second year.
the vegetated wetland and the non-vegetated control as concerns the faecal coliforms removal in the rainy season of the second year (Figure 9(b)). Again, there were no significant differences between the performances of the first and the second years (P > 0.05).
The role of the substrate-root matrix is depicted by the variance of faecal indicators counts observed at the outflow of the wetlands during the different seasons. The significant performances of the wetland vegetated (P < 0.05) compared with the control in during the experimental period could be explained by the interaction between the sand/gravel-root matrixes in the vegetated wetland coupled with the difference in substrate’s microbial composition due to the presence of Fuirena umbellata. [38] emitted a similar reasoning when he found that his vegetated systems were more efficient than the non-vegetated control. Some authors also reported that the removal could be due to the antibiotic properties of some bacteria found at the rhizosphere region [15] [16] . These results are however different from those reported by [39] where the non vegetated control bed was in the average more efficient than the vegetated wetland in a subsurface horizontal flow system. Given that this macrophyte highly possesses aerenchyma tissues [40] , the Root Oxygen Load (ROL) into the substrate might had created a suitable habitat for aerobic and facultative micro-organisms in addition to the anaerobic ones around the rhizosphere [9] [10] [11] [41] [42] . This presence of oxygen may stimulate the co-existence of aerobic and anaerobic degradation in the substrate with the production of wastes which may be toxic and fatal to the faecal indicators. Also, the secretion of photosynthetic substances through the roots enriches the rhizosphere zone and may lead to the proliferation of substrate micro-organisms [9] [31] . These could also be more competitive and fatal to faecal bacteria since they are found in their natural milieu.
The reductions of 1.5 and 0.3 log units were observed at the outflow of the vegetated and control wetlands respectively during the first year. These results are similar to those of [30] [43] and [44] observed in polycultured systems. These results are also found within the range of removals reported for constructed wetlands treating domestic wastewater in similar conditions by many authors [45] [46] [47] . However, [48] reported removal efficiencies of faecal coliforms beyond 99% in agricultural constructed wetlands in a cold climate. The reduction of faecal indicators in the wetlands might have also been due to die-off due to attack by lytic phages or bacteria [31] , or predation by nematodes, protozoa or ciliates, thought to be important predators for bacteria removal from wastewater in constructed wetlands [15] [49] [50] . The higher efficiencies of the dry seasons with respect to the rainy seasons could also be attributed to the lytic action of ultra violet radiations on the cell wall of bacteria which may be higher in the dry season than in the rainy season [15] [16] .
In the vegetated wetland, no significant differences were observed in the count of faecal indicators between the different seasons throughout the two years period. This is an indication of the stability of the system throughout the years regardless of the season. These results are however different from those of [43] , who reported significant differences in the quantity of indicator micro-organ- isms in different seasons of their experiment. The higher reductions of faecal indicators observed at the outflow of vegetated wetland compared with the non vegetated control is a suggestion of the influence of the macrophyte in the reduction of faecal indicators and why not the pathogens themselves [5] [17] [25] [51] .
3.3. Reduction Rates of Physicochemical Parameters in the Wetlands
Figure 10 presents the removal efficiencies of the treatment beds during the first year as calculated from the data presented in Table 4. Total Suspended Solids (TSS) was the parameter with highest reduction rate in the vegetated wetland during the dry season (70%) and during the rainy season (93%). It was followed by the nitrates with percentage reduction of 68% during the dry season whereas
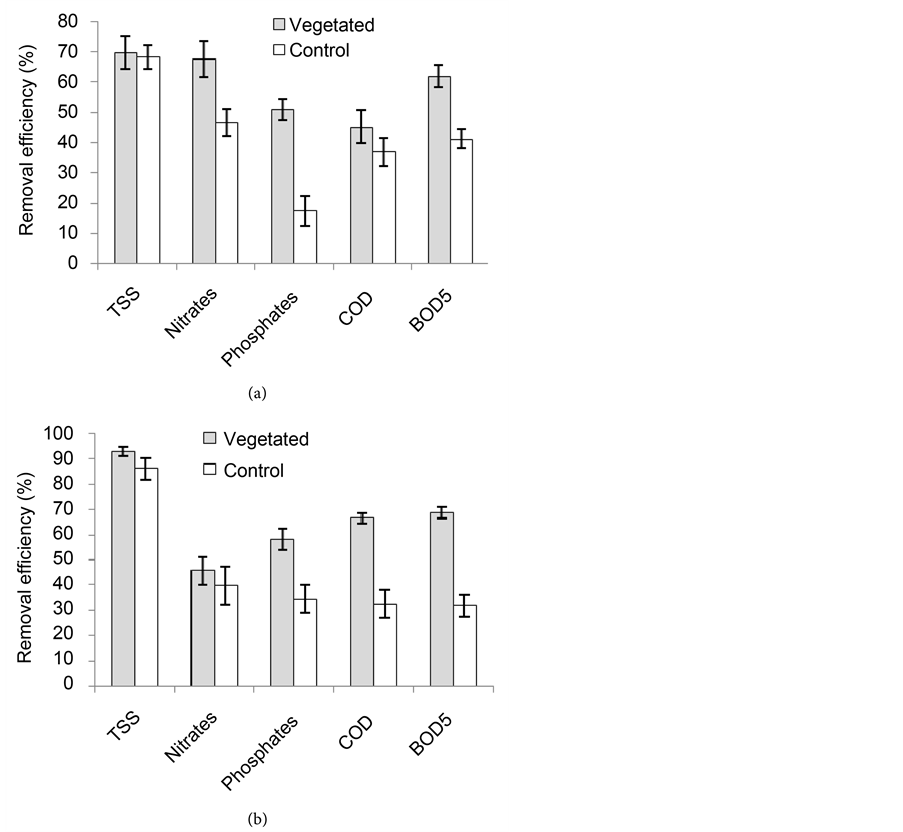
Figure 10. Efficiencies of vegetated and control wetlands in the reduction of physicochemical parameters in the dry season (a) and rainy season (b) during the 1st year (TSS: Total Suspended Solids; COD: Chemical Oxygen Demand; BOD5: 5 days Biochemical Oxygen Demand).
in the rainy season, the BOD5 followed the TSS with a percentage reduction of 69%. However, there were no significant differences (P > 0.05) between the removal efficiencies of the different parameters in the vegetated wetland during the dry season. Also, the no significant differences existed (P > 0.05) between the vegetated and the non vegetated control wetlands as concerns the removal of TSS, nitrates and COD. Nevertheless, the vegetated wetland was significantly more efficient (P < 0.05) than the non vegetated control in the reduction of phosphates and BOD5. During the rainy season, the vegetated wetland again was significantly more efficient (P < 0.05) in the reduction of COD and BOD5. There were no significant differences between the two wetlands (P > 0.05) as concerns the reduction of the other parameters.
During the second year, the nutrients with the highest removal rates (71%) in
Table 4. Average physicochemical characteristics of water at the inflow and outflow of the wetlands during the dry and the rainy seasons of the first year (CND: Electrical conductivity).
the vegetated wetland were phosphates, while nitrates were reduced at 60% in the rainy season. TSS in this bed were respectively reduced at 73% and 88% in the dry season and rainy season (Figure 11). The highest reduction rates in the control wetland were recorded for TSS (77%) and (79%) in the dry and rainy seasons respectively. COD in this wetland had the least reduction (21%) in the dry season while nitrates and COD were the least reduced (27%) in the rainy season. The vegetated wetland was significantly more efficient (P < 0.05) than the non-vegetated control in the reduction of COD and BOD5 in both seasons (Figure 11). The BOD5/COD ratio reduced from the inflow to the out flow of the vegetated wetland in both seasons and wasn’t the case with outflow of the non-vegetated control (Table 5). Apart from the phosphates, the vegetated wetland was generally more efficient in the rainy season than in the dry season; but there were no significant differences between the two seasons (P > 0.05). This trend was contrary in the non vegetated control during this second year, since this wetland was instead more efficient in the dry season except for the TSS and COD as they recorded reductions of 79% and 27% respectively in the rainy season, more than 76% and 21% respectively in the dry season but, with no significant differences between the two seasons.
3.4. Some C
From Table 4 and Table 5, it is seen that the quality of the water in the outflow of the wetlands was still very poor, even though high percentage reductions of several parameters were observed (Figure 10 and Figure 11). The outflow concentrations of the different parameters in these tables were generally less in the vegetated wetland compared with the non vegetated control except those of the conductivity, colour, turbidity and total suspended solids during the dry season of the second year (Table 5). These parameters were instead less at the outflow of the non vegetated control. Generally during the second year, the BOD5/COD ratio decreased at the outflow of the control but not at the outflow of the vegetated
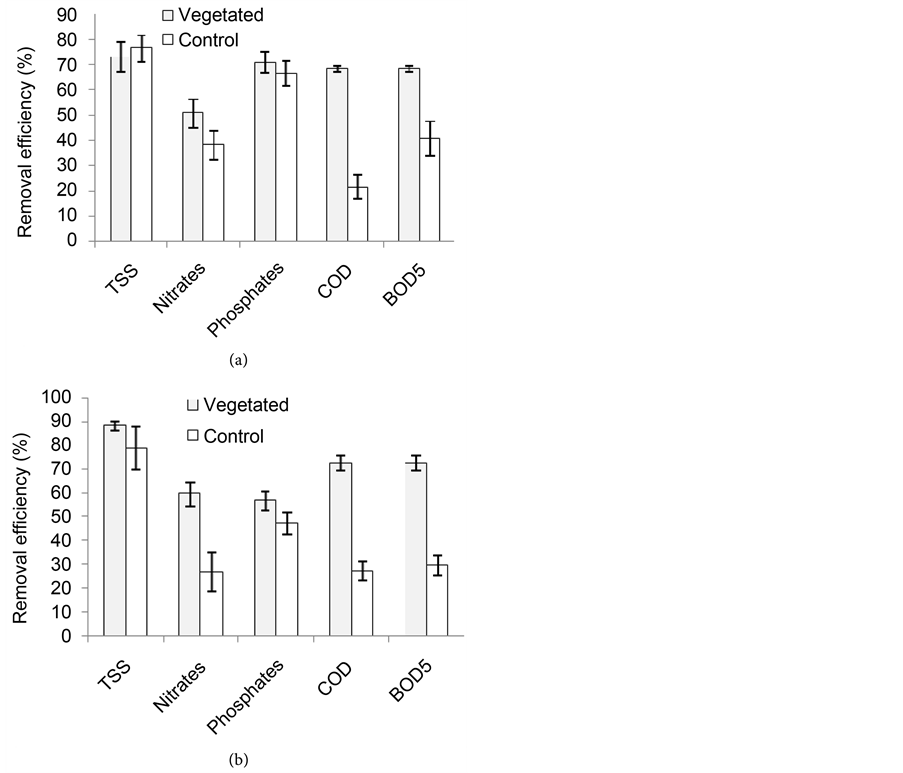
Figure 11. Efficiencies of vegetated and control wetlands in the reduction of physicochemical parameters in the dry season (a) and rainy season (b) during the 2nd year (TSS, Total Suspended Solids; COD: Chemical Oxygen Demand; BOD5: 5 days Biochemical Oxygen Demand).
wetland in both seasons (Table 5).
Concerning this removal of nutrients, the significant reduction of COD and BOD5 in the wetland during the first year in the vegetated wetland, as well as the decrease in the BOD5/COD ratio in the wetland with respect to the inflow is an indication that the degradable organic matter in the wastewater was removed in the wetland [16] [30] . This observation is probably due to the fact that, the macrophyte in a nutrient rich environment actively photosynthesises and releases roots exudates including oxygen which stimulated aerobic microbes for biodegradation; a removal mechanism probably absent in the non vegetated control. There was no decrease in BOD5/COD ratio in the vegetated wetland, but in the non vegetated control during the second year in both seasons. Compared with the first year, this could be due to the fact the microflora and funa were not yet well established in the control wetland during the first year and therefore had less microbial density compared with vegetated wetland where the density were
Table 5. Average physicochemical characteristics of water at the inflow and outflow of the wetlands during the dry and the rainy seasons of the second year (CND: Electrical conductivity).
enhanced by the root exudates [31] [42] [52] and [53] . During the second year, the aging root system and rhizomes of the macrophyte might have begun dying off and rotting to increase nutrients in the system in addition to the degradation of the aerobic flora at the rhizosphere zone, all of which were absent in the non vegetated control.
The removal of nutrients (nitrates and phosphates) in the vegetated wetland was always more than that of the non vegetated control throughout the experimental period. However, significant differences between the two wetlands existed (P < 0.05) only in the removal of phosphates in the dry season of the first year and nitrates in the rainy season of the second year. In constructed wetlands, these parameters are removed by macrophytes, microphytes and other microbial uptake where, the inorganic nutrients are converted to organic biomass and stored as tissues [9] [10] [11] [45] . Some previous authors have reported higher significant removals of phosphorus species than nitrogen species in constructed wetlands [17] [54] [55] . No significant differences were noticed in the removal of the two species in this work. These results are similar to those reported by [25] .
The removal of TSS was highest and non significant in the vegetated wetland compared with the non vegetated control throughout the two years period. This parameter in constructed wetlands is mainly removed through filtration by the substrate, sedimentation and adsorption to the substrate and may be to the vegetation in the wetland [56] and [57] . The filtered and sedimented solids are further degraded by micro-organisms and other invertebrates present in the wastewater. “These results for the TSS are similar to those of [30] in polyculture systems, but contradictory to the results published by [20] and [58] where the removal efficiency was higher in non-vegetated control. The concentration of TSS at the outflows of the wetlands was nevertheless significantly higher (P < 0.05) than that at the inflow. According to the WHO guide lines published by [59] ”, the values discussed in this paper might have not reached those recommended for wastewater release and reuse. This could simply be attributed to the high hydraulic loading rate (HLR) of 85.43 Lm−2・day−1 in an experimental wetland with capacity of 923 L and a hydraulic retention time (HRT) of only 3.6 days. Therefore, if the bed capacity of the wetland is double, probably we will be doubling the HRT at the same HLR and consequently double the performances of the wetland, making the effluent quality at the outflow of the wetland vegetated with Fuirena umbellata acceptable for the environment and reuse.
4. Conclusion
This work had an objective to study the growth and biomass production of Fuirena umbellata (Cyperaceae) and its potentials in the removal of faecal bacteria and nutrients from domestic wastewater. At the end of this study we can say that, the rapid growth and high biomass yield of Fuirena umbellata in wastewater water make it a potential species for use in wastewater treatment in tropical regions. It is found to grow more densely in rainy season but produces more biomass instead in the dry season. The wetland vegetated by Fuirena umbellata was significantly more efficient in the removal of total coliforms and faecal streptococci in the first year, faecal coliforms and faecal streptococci in the second year with no significant differences between the seasons and between the years. Its presence in the wetland also influenced the removal of physicochemical parameters and significantly, the reduction of BOD5 and COD in the wastewater throughout the two years period. This suggests the recommendation of this macrophyte for use in constructed wetland technologies for domestic wastewater treatment in tropical climates. From the quality of the effluent produced and discussed in this paper, the wetland vegetated with Fuirena umbellata could be strongly recommended for use in domestic wastewater reclamation and reuse in developing countries.
Acknowledgements
The authors thank the International Foundation for Science (IFS) for the financial support to Dr. FONKOU Théophile through the grants N˚W/3782-1 and N˚W/3782-2.
Cite this paper
Lekeufack, M., Fonkou, T. and Pamo Tedonkeng, E. (2017) Growth Characteristics of Fuirena umbellata in a Surface Flow Constructed Wetland and Its Influence in Nutrients and Faecal Bacteria Removal from Domestic Wastewater in Cameroon. Journal of Environmental Protection, 8, 171-193. https://doi.org/10.4236/jep.2017.82014
References
- 1. Morel, M.A. (1996) L’utilité Des Végétaux Aquatiques Pour Le Traitement des Eaux Usées Sous Climat Tropical. Thèse de Doctorat, INPL, Ecole Nat. Sup. d’Agr. et des Ind. Al., France, Pages: 168.
- 2. Smeets, P., Rietveld, L., Hijnen, W., Medema, G. and Stenström, T. (2006) Efficacy of Water Treatment Processes. In MICRORISK (Microbiological Risk Assessment: A Scientific Basis for Managing Drinking Water Safety from Source to Tap).
- 3. Okoh, A.I., Odjadjare, E.E., Igbinosa, E.O. and Osode, A.N. (2007) Wastewater Treatment Plant as a Source of Microbial Pathogens in Receiving Watersheds. African Journal of Biotechnology, 25, 2932-2944.
- 4. Anwar, H.N., Farhana, N., Shafqat, H. and Waseem, N. (2010) Socio-Economic Consequences of Reusing Wastewater in Agriculture in Faisalabad. Pakistan Journal of Life and Social Sciences, 8, 102-105.
- 5. Kadlec, R.H. and Knight, R.L. (1996) Treatment Wetlands. Lewis Publishers, Boca Raton, 893 p.
- 6. Mthembu, M.S., Odinga, C.A., Swalaha, F.M. and Bux, F. (2013) Constructed Wetlands: A Future Alternative Wastewater Treatment Technology. Review: African Journal of Biotechnology, 12, 4542-4553.
https://doi.org/10.5897/AJB2013.12978 - 7. Yeh, T.Y., Chou, C.C. and Pan, C.T. (2009) Heavy Metal Removal within Pilot-Scale Constructed Wetlands Receiving River Water Contaminated by Confined Swine Operations. Desalination, 249, 368-373.
https://doi.org/10.1016/j.desal.2008.11.025 - 8. Stefanakis, A.I., Akratos, C.S. and Tsihrintzis, V.A. (2011) Effect of Wastewater Step-Feeding on Removal Efficiency of Pilot-Scale Horizontal Subsurface Flow Constructed Wetlands. Journal of Ecological Engineering, 37, 431-443.
https://doi.org/10.1016/j.ecoleng.2010.11.006 - 9. Kadlec, R.H. (2000) The Inadequacy of the First-Order Treatment Wetland Models. Ecological Engineering, 15, 105-119.
https://doi.org/10.1016/S0925-8574(99)00039-7 - 10. Ayaz, S.C. and Akça, L. (2001) Treatment of Wastewater by Natural Systems. Environment International, 26, 189-195.
https://doi.org/10.1016/S0160-4120(00)00099-4 - 11. Li, L., Li, Y., Biswas, D.K., Nian, Y. and Jiang, G., (2008) Potential of Constructed Wetlands in Treating Eutrophic Water: Evidence from Taihu Lake of China. Bioresource Technology, 99, 1656-1663.
https://doi.org/10.1016/j.biortech.2007.04.001 - 12. Polprasert, C. (2007) Organic Waste Recycling Technology and Management. International Water Association (IWA), London.
- 13. Perbangkhem, T. and Polprasert, C. (2010) Biomass Production of Papyrus (Cyperus papyrus) in Constructed Wetland Treating Low Strength Domestic Wastewater. Bioresource Technology, 101, 833-8835.
https://doi.org/10.1016/j.biortech.2009.08.062 - 14. Pare, M.M.N., Koné, D., Kengne, I.M. and Akoa, A. (2011) Growth and Yield Potential of Echinochloa pyramidalis (Lam.) Hitchc & Chase: A Forage Plant Used in Vertical Flow Constructed Wetlands in Cameroon. African Journal of Environmental Science and Technology, 5, 622-632.
- 15. Green, M.B., Griffin, P., Seabridge, J.K. and Dhobie, D. (1997) Removal of Bacteria in Subsurface Flow Wetlands. Water Science Technology, 35, 109-116.
https://doi.org/10.1016/S0273-1223(97)00059-0 - 16. Song, Z.W., Wu, L., Yang, G., Xu, M. and Wen, S.P. (2008) Indicator Microorganisms and Pathogens Removal Function Performed by Copepods in Constructed Wetlands. Bulletin of Environmental Contamination and Toxicology, 81, 459-463.
https://doi.org/10.1007/s00128-008-9527-1 - 17. Lekeufack, M., Fonkou, T., Pamo, T.E. and Akoa, A. (2012) Removal of Faecal Bacteria and Nutrients from Domestic Wastewater in a Horizontal Surface Flow Wetland Vegetated with Echinochloa pyramidalis. African Journal of Environmental Science and Technology, 6, 337-345.
https://doi.org/10.5897/AJEST12.126 - 18. Ennabili, A., Atar, M. and Radoux, M. (1998) Biomass Production and NPK Retention in Macrophytes from Wetlands in the Tingitan peninsula. Aquatic Botany, 62, 45-56.
https://doi.org/10.1016/S0304-3770(98)00075-8 - 19. Canahap, C., Davenport, J., Ehorn, D., Gray, H., Harris, L., Kelly, M., Meek, J.A., Minisch, K., Teels, B. and Lewiki, C. (2002) Wetlands: A Key Link to Watershed Management. Conservation Technology Information Center (CTIC), West Lafayette.
http://www.ctic.purdue.edu/kyw/brochure/wetland.htm/ - 20. Kengne, I.M., Dodane, P.-H., Akoa, A. and Koné, D. (2009) Vertical-Flow Constructed Wetlands as Sustainable Sanitation Approach for Faecal Sludge Dewatering in Developing Countries. Desalination, 248, 291-297.
https://doi.org/10.1016/j.desal.2008.05.068 - 21. Kengne, I.M., Amougou, A. and Kone, D. (2009) Recovery of Biosolids from Constructed Wetlands Used for Faecal Sludge Dewatering in Tropical Regions. Environmental Science & Technology, 43, 6816-6821.
https://doi.org/10.1021/es803279y - 22. Fonkou, T., Fonteh, M.F., Kanouo, M.D. and Amougou, A. (2010) Performances des filtres plantés d’Echinochloa pyramidalis dans l’épuration des eaux usées de distillerie en Afrique subsaharienne. Tropicultura, 28, 69-76.
- 23. Pare, M.M.N., Koné, D., Kengne, I.M., Dongo, K. and Akoa, A. (2011b) Nutritional Potential of Echinochloa pyramidalis (Lam.) Hitchc. & Chase, a Forage Plant Used in Constructed Wetlands Treatment of Faecal Sludge and Wastewater. African Journal of Agricultural Research, 6, 4397-4408.
- 24. Lekeufack, M., Fonkou, T., Sako, I.B., Pamo, E. and Amougou, A. (2011) Studies on Biomass Yield from Echinochloa pyramidalis, E. Crus-Pavonis and Leersiahexandra in Yard-Scale Surface Flow Wetlands in Cameroon. Universal Journal of Environmental Research and Technology, 1, 476-485.
- 25. Fonkou, T., Lekeufack, M. and Teguimdje, F. (2013) Performances of a Yard-Scale Surface Flow Wetland Vegetated with Echinochloacrus-Pavonis in the Removal of Nutrients and Faecal Bacteria from Domestic Wastewater. Journal of Biology and Life Science, 4, 2157-6076.
https://doi.org/10.5296/jbls.v4i2.3880 - 26. Lorion, R. (2001) Constructed Wetlands: Passive Systems for Wastewater Treatment. Technology Status. Report Prepared for the USEPA Technology Innovation Office under a National Network of Environment Management Studies Fellowship, 24.
- 27. APHA (1998) Standard Methods for the Examination of Water and Wastewater. 20th Edition, Washington DC.
- 28. CEAE (2005) Recherche et dénombrement des coliformes totaux, entérocoques, coliformes fécaux (thermotolérants) et confirmations à l’espèce Escherichia coli: Méthode par filtration sur membrane. Edition 2003-12-05 et Révision 2005-12-15 (2).
- 29. Hench, K.R., Bissonnette, G.K., Sexstonea, A.J., Coleman, J.G., Garbutt, K. and Skousen, J.G. (2003) Fate of Physical, Chemical and Microbial Contaminants in Domestic Wastewater Following Treatment by Small Constructed Wetlands. Water Research, 37, 921-927.
- 30. Karathanasis, A.D., Potter, C.L. and Coyne, M.S. (2003) Vegetation Effect on Faecal Bacteria, BOD and Suspended Solid Removal Treating Domestic Wastewater. Journal of Ecological Engineering, 20, 157-169.
- 31. Karim, M.R., Glenn, E.P. and Gerba, C.P. (2008) The Effect of Wetland Vegetation on the Survival of Escherichia coli, Salsmonellatyphimurium, Bacteriophage MS-2 and Polio Virus. Journal of Water and Health, 6, 167-175.
https://doi.org/10.2166/wh.2008.024 - 32. Hach (2004) The Handbook. DR/2500 Laboratory Spectrophotometer: Procedure Manual. 4th Edition, HACH Be Right.
- 33. Calheiros, C.S.C., Rangel, A.O.S.S. and Castro, P.M.L. (2007) Constructed Wetland Systems Vegetated with Different Plants Applied to the Treatment of Tannery Wastewater. Water Resource, 41, 1790-1798.
https://doi.org/10.1016/j.watres.2007.01.012 - 34. Iamchaturapatr, J., Yi, S.W. and Rhee, J.S. (2007) Nutrient Removals by 21 Aquatic Plants for Vertical Free Surface-Flow (VFS) Constructed Wetland. Ecological Engineering, 29, 287-293.
https://doi.org/10.1016/j.ecoleng.2006.09.010 - 35. Morison, J.I.L., Piedate, M.T.F., Muler, E., Long, S.P., Junk, W.J. and Jones, M.B. (2000) Very High Productivity of the C4 Aquatic Grass Echinochloapolystachya in the Amazon Floodplain Confirmed by Net Ecosystem CO2 Flux Measurements. Oecologia, 125, 400-411.
https://doi.org/10.1007/s004420000464 - 36. Robin, A.M. and Kalff, J. (1988) Submerged Aquatic Macrophyte Biomass in Relation to Sediment Characteristics in Ten Temperate Lakes. Fresh Water Biology, 19, 115-121.
https://doi.org/10.1111/j.1365-2427.1988.tb00333.x - 37. Carr, R., Blumenthal, U. and Mara, D. (2004) Health Guidelines for the Use of Wastewater in Agriculture: Developing Realistic Guidelines. In: Scott, C.A. and Raschid-Sally, L., Eds., Wastewater Use in Irrigated Agriculture. Conforming the Livelihood and Environmental Realities, CABI Publishing, Wallingford, 41-58.
https://doi.org/10.1079/9780851998237.0041 - 38. Kaseva, M.E. (2004) Performance of a Sub-Surface Flow Constructed Wetland in Polishing Pre-Treated Wastewater: A Tropical Case Study. Water Research, 38, 681-687.
https://doi.org/10.1016/j.watres.2003.10.041 - 39. Mburu, N., Thumbi, G.M. and Mayabi, A.O. (2008) Removal of Bacteria Pathogens from Domestic Wastewater in a Tropical Subsurface Horizontal Flow Constructed Wetland. In: Senupta, M. and Dalwani, R., Eds., Proceedings of Taal 2007: The 12th World Lake Conference, International Lake Environment Committee, Kusatsu, 1010-1015.
- 40. Fonkou, T., Gayap, A.F. and Lekeufack, M. (2014) Modifications morphologiques et anatomiques d’Echinochloa pyramidalis et de Fuirena umbellata sur des filtres horizontaux à macrophytes pour l’épuration des usées. Proceedings of 4th Life Science Conference, Dschang, 7-8 August 2014, 206-208.
- 41. Reddy, K.R., Patrick, W.H. and Lindau, C.W. (1989) Nitrification-Denitrification at the Plant Root Sediment Interface in Wetlands. Limnology and Oceanography, 34, 1004-1013.
https://doi.org/10.4319/lo.1989.34.6.1004 - 42. Chen, W.Y., Chen, Z.H., He, Q., Wang, X.Y., Wang, C., Chen, D.F. and Lai, Z.L. (2007) Root Growth of Wetland Plants with Different Root Types. Acta Ecologica Sinica, 27, 450-458.
https://doi.org/10.1016/S1872-2032(07)60017-1 - 43. Molleda, P., Blancoa, I., Ansola, G. and Estanislao, L. (2008) Removal of Wastewater Pathogen Indicators in a Constructed Wetland in Leon, Spain. Ecological Engineering, 33, 252-257.
https://doi.org/10.1016/j.ecoleng.2008.05.001 - 44. Torrens, A., Molle, P., Boutin, C. and Salgot, M. (2009) Removal of Bacterial and Viral Indicators in Vertical Flow Constructed Wetlands and Intermittent Sand Filters. Desalination, 247, 170-179.
https://doi.org/10.1016/j.desal.2008.03.050 - 45. Greenway, M. (2005) The Role of Constructed Wetlands in Secondary Effluent Treatment and Water Reuse in Subtropical and Arid Australia. Ecological Engineering, 25, 501-509.
https://doi.org/10.1016/j.ecoleng.2005.07.008 - 46. Morsy, E.A., Al-Herrawy, A.Z. and Ali, M.A. (2007) Assessment of Cryptosporidium Removal from Domestic Wastewater via Constructed Wetland Systems. Water, Air, & Soil Pollution, 179, 207-215.
https://doi.org/10.1007/s11270-006-9225-8 - 47. Reinoso, R., Torres, L.A. and Bécares, E. (2008) Efficiency of Natural Systems for Removal of Bacteria and Pathogenic Parasites from Wastewater. Science of the Total Environment, 395, 80-86.
https://doi.org/10.1016/j.scitotenv.2008.02.039 - 48. Smith, E., Gordon, R., Madani, A. and Stratton, G. (2005) Pathogen Removal by Agricultural Constructed Wetlands in Cold Climates. Journal of Environmental Informatics, 6, 46-50.
https://doi.org/10.3808/jei.200500054 - 49. Mandi, L., Quazzani, N., Bouhoum, K. and Boussaid, A. (1993) Wastewater Treatment by Stabilization Ponds with and without Macrophytes under Arid Climate. Water Science & Technology, 28, 177-181.
- 50. Decamp, O. and Warren, A. (1998) Bacterivory in Ciliates Isolated from Constructed Wetlands (Reed Beds) Used for Wastewater Treatment. Water Research, 32, 1989-1996.
https://doi.org/10.1016/S0043-1354(97)00461-2 - 51. Werker, A.G., Dougherty, J.M., McHenry, J.L. and Van Loon, W.A. (2002) Treatment Variability for Wetland Wastewater Treatment Design in Cold Climates. Ecological Engineering, 19, 1-11.
https://doi.org/10.1016/S0925-8574(02)00016-2 - 52. Weißner, A., Kuschk, P. and Stottmeister, U. (2002) Oxygen Release by Roots of Typhalatifolia and Juncuseffusus in Laboratory Hydroponic Systems. Acta Biotechnologica, 22, 209-226.
- 53. Gagnon, V., Chazarenc, F., Comeau, Y. and Brisson, J. (2007) Influence of Macrophyte Species and Microbial Density and Activity in Constructed Wetlands. Water Science and Technology, 56, 249-254.
https://doi.org/10.2166/wst.2007.510 - 54. Sooknah, R.D. and Wilkie, A.C. (2004) Nutrient Removal by Floating Aquatic Macrophytes Cultured in Anaerobically Digested Flushed Dairy Manure Wastewater. Ecological Engineering, 22, 27-42.
https://doi.org/10.1016/j.ecoleng.2004.01.004 - 55. Henry-Silva, G.G. and Camargo, A.F.M. (2006) Efficiency of Aquatic Macrophytes to Treat Nile Tilapia Pond Effluents. Science in Agriculture, 63, 433-438.
- 56. Van Oortrom, A.J. and Cooper, R.N. (1990) Meat Processing Effluent Treatment in Surface Flow and Gravel-Bed Constructed Wastewater Wetlands. In: Cooper, P.F. and Finflater, B.C., Eds., Constructed Wetlands in Water Pollution Control, Pergomon Press, Oxford, 321-332.
- 57. Lekeufack, M. (2014) Potentials of Local Macrophytes in the Removal of Nutrients and Bio-indicators of Faecal Contamination from Domestic Wastewater in Vegetated Bed Systems. Thesis Presented and Defended for the Award of PhD/Doctorate in the University of Dschang-Cameroon, Dschang, 188.
- 58. Thomas, P.R., Glover, P. and Kalaroopan, T. (1995) An Evaluation of Pollutant Removal from Secondary Treated Sewage Effluent Using a Constructed Wetland System. Water Science and Technology, 32, 87-93.
- 59. Richard, C. (2005) WHO Guidelines for Safe Wastewater Use-More than Just Numbers. Irrigation and Drain, 54, S103-S111.
https://doi.org/10.1002/ird.190