Journal of Environmental Protection
Vol.06 No.02(2015), Article ID:54209,8 pages
10.4236/jep.2015.62015
Flood Mitigation Parameters of Apiti Wetlands Soil in a Segment of Mamu River Basin, Nigeria
Nkiru A. Ezenwaji1*, Emma E. Ezenwaji2, Anthony C. Okoye3
1Department of Zoology, Nnamdi Azikiwe University, Awka, Nigeria
2Department of Geography and Meteorology, Nnamdi Azikiwe University, Awka, Nigeria
3Department of Environmental Management, Nnamdi Azikiwe University, Awka, Nigeria
Email: *emmaezenwaji@gmail.com
Copyright © 2015 by authors and Scientific Research Publishing Inc.
This work is licensed under the Creative Commons Attribution International License (CC BY).
http://creativecommons.org/licenses/by/4.0/


Received 26 January 2015; accepted 13 February 2015; published 25 February 2015
ABSTRACT
Wetlands are essential components of our global ecosystem. They have important functions which include maintenance of the environment through mitigating the degree of flooding, regulating the local and global climate and lessening the degree of erosion by trapping sediments. The aim of this research is therefore to investigate how relevant wetland parameters mitigate flood in Apiti wetland soil of middle River Mamu basin of Nigeria. For the purpose of the study, the wetland was divided into three; A (the upland region), B (the flood plain), and C (the raffia palm area). The soil flood mitigation parameters examined are bulk weight, moisture content, and saturation water content. These were employed to calculate the volume of flood mitigation within three sub-sites of the wetland. The statistical methods employed were One Way ANOVA and Students t-Test to see whether differences occur in the flood mitigating ability of the soil. Results obtained show that flood mitigation was highest within study site B (flood plain) with 6.4 × 10⁶ m3 volume of flood mitigation and lowest in site A (upland region) with 1.5 × 10⁶ m3. In conclusion we recommended that the study be scaled up to other wetlands in Nigeria.
Keywords:
Component, Apiti, Basin, Flood, Mitigation, Wetland

1. Introduction
The importance of wetlands to food production cannot be overemphasized as they serve as a ready environment for agricultural production and preservation of the ecosystem. However, when they are not properly managed, as a result of their over exploitation which often comes seasonally to ravage them, making this potential to become somewhat a mirage. Floods should however be mitigated so as to enable farmers to derive the good benefits that are usually associated with them. The benefit of flood mitigation by wetland soil is considerable and should not be disregarded in any wetland environment. According to [1] , wetland soil is highly porous and can store water three to nine times its weight. Furthermore, it has been shown that wetland basin that is not already filled to capacity with water can reduce the magnitude of flood peaks [2] -[4] . Wetlands as national reservoir can be likened to man-made reservoirs that can receive volumes of water. This is because just as man-made dams act to hold water back, wetlands control flood water for a later release as a result of their biogeographical features and basin vegetation which enables them to hold back water and then slowly release these flood water to downstream areas.
In Nigeria very large and extensive wetlands exist. For example the entire Niger/Delta from Calabar to Warri, the coastal area from Ondo to Lagos, as well as, the Sokoto-Rima basin, Hadaija Ju’mari basin and the Lake Chad trough are among the largest in the West African sub-region.
In Anambra State, wetlands of considerable size exist in the entire Anambra East and West Local Government Areas as well as Ogbaru. There are spotty locations where they are found such as the northern parts of Awka North Local Government Area in areas such as Ebenebe, Ugbene, Ugbenu, Mgbakwu and Awba Ofemili. It is also located in the large expanse of land found in Ufuma, Awa and Ndiugwuenu areas. Existing work on the potentials of food mitigation have concentrated attention on surface waters [5] -[10] , but flood mitigation benefits both the surface and soil water but little attention has been paid to soil water. This paper, therefore, seeks to examine some of the parameters of wetland soil within Apiti region in Mamu River Basin that help to mitigate flooding. These parameters include soil bulk weight (dry weight) moisture content, saturation water content, vegetation and fauna studies.
2. Material and Methods
2.1. Area of Study
Apiti wetland is situated in Umuawulu, Awka South Local Government Area of Anambra State within the Mamuriver basin. Located between latitudes 6˚08'N and 6˚10'N and longitudes 7˚05'E and 7˚07'E (Figure 1), the area is made of undulating plains found on Awka-Orluuplands east of Awka town. Vegetation is the derived savanna, characterized by the existence of interposing short trees in a grassland environment, and drained by two streams namely, Haba and Ezekwu. Geologically, the entire area is composed of marine shale deposit called Imo shale which was one of the tertiary era sediments deposited at paleocene stage. It has some sandy faces called Ebenebe sandstone and has a maximum thickness of 500 mm which is made up of clayey shale that is always either dark red or bluish in colour. It also contains clay ironstones which manifests in some areas as limestone concretions [11] . Mean annual rainfall of the study is about 1800 mm while relative humidity in the wet season is about 80%, but can go as low as 40% during the dry season especially in the hamattan period.
2.2. Data Collection
The area was divided into three distinct sub-sites according to soil vegetation and hydrological characteristics and used in the collection of data of the already identified parameters of wetlands soil. The sub-sites are A―the upland region, B―the flood plain or seasonally flooded area and C―the raffia palm area. To avoid any influences the seasonal rains might have on soil characteristics, soil samples were collected in April 2009 at the beginning of the rainy season. The three sub-sites were further divided into twelve small locations each measuring 20 m by 20 m (400 m2) to aid in data collection. Five samples of soil bulk weight, moisture content and saturated water content were randomly collected with shovel to a depth of 20 cm from each sub-site totalling 20 samples per site.
1) Vegetation Study
In each site 10 m2 quadrants were carefully marked out (8 quadrants per site) plants in each quadrant were collected and stored for laboratory analysis.
2) Fauna Study
a) Collection of Soil Fauna
Metre calibrated tape measure was used to ascertain the area (0.5 m2) at the point of collection of samples from
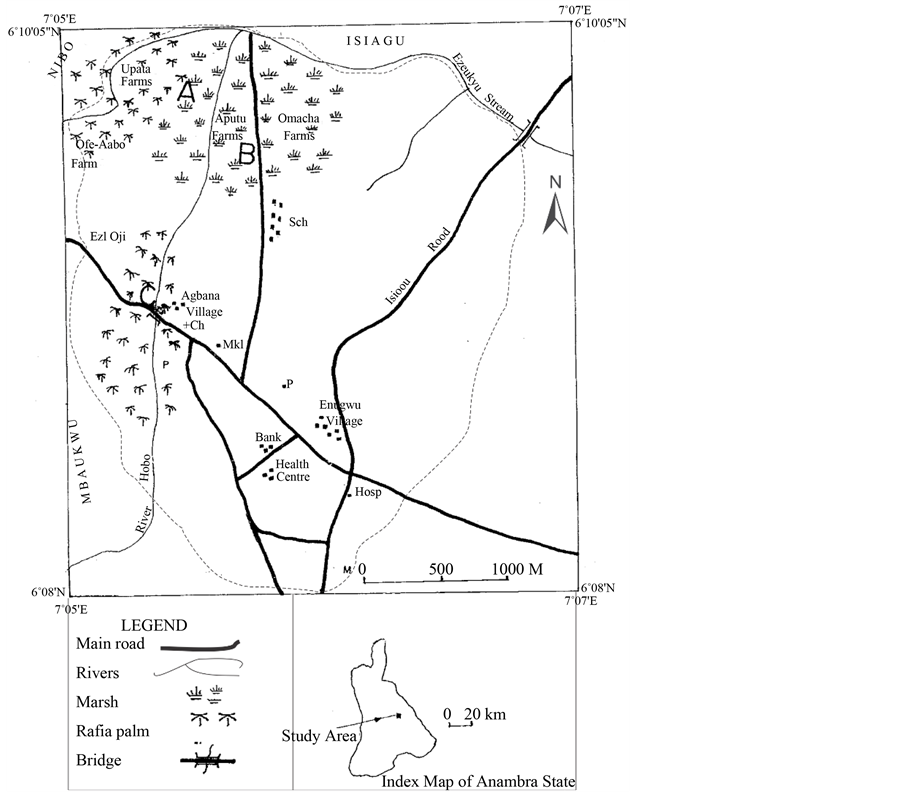
Figure 1. Map showing Apiti wetlands of Mamu River Basin.
each study area (each area represents a quadrant). Fresh set of samples were collected from each of the sub-sites (five per site).
b) Small and Large Mammal Live Trap
Small mammal traps were used to trap small mammals in the three sites. Five traps were placed at strategic parts of each study site and examined daily for three weeks. The trapped mammals were identified.
2.3. Data Analysis
The soil samples were weighed using standard weighting balance to the nearest grams, and 500 grams of each of the soil samples was stored in black polythene bags and labelled. The flood mitigation parameters of the soil were investigated using the soil samples stored in the polythene bags. Bulk weight was determined by drying the 500 grams of the soil sample in an oven for 24 hours and reweighting until a constant weight was recorded to the nearest gram. The soil moisture content was measured using the oven dried soil. Subtracting the bulk weight from the weight of the soil sample before drying gives the moisture content value of the soil sample. Soil moisture content is expressed as a percentage of the sample dry weight i.e.
 (1)
(1)
where MC = Moisture content;
W = weight of water in the soil sample;
D = weight of oven dried soil sample.
Again saturation water content is obtained from weighing and drying procedure on each soil sample using Hilgard soil cup (Soil lab, 2004). The cup was improvised by using a can opened at both ends. Wire gauze was used to cover one end. During the experiment, filter paper was placed on the end with gauze to prevent soil sample from dropping into water. 500 grams of the oven dried soil samples of each site (20 samples per site) were place in a Hilgard soil cup and weighed after which it was placed in bowls containing water. The samples were left for 8 - 14 hours, removed and drained on a rack for a few minutes before reweighing. Again, it is expressed as a percentage with the formulae below
 (2)
(2)
where
SWC = saturation water content;
G = weight gained by absorption;
D = oven dried weight.
On vegetation study, analysis was carried out while Shannon-Weaver index of diversity (Shannon-Weaver, 1963) was used to assess specie diversity in the sites. The formulae used to calculate the frequency, abundance and diversity is stated as
 (3)
(3)
where
F = the frequency;
N = number of occurrence;
T = total number of quadrants.
![]() (4)
(4)
where
A = abundance;
N = number of individuals;
T = total number of quadrant of occurrence.
![]() (5)
(5)
where
D = density;
NI = total number of individuals;
TQ = total number of quadrants sampled.
On the calculation of soil Fauna, fresh set of samples already collected were subjected to dry extraction using improvised Tulgren funnel.
2.4. Calculation of Volume of Flood Mitigation
When wetland soils are subjected to inundation by flood waters, their soils become saturated [12] . The flood controlling quality of the wetland soil can be calculated by subtracting the quantity of water within the wetland soil when they are dried from the quantity of water under saturation [13] -[15] . The flood mitigation parameters (bulk weight, moisture content and saturation water) of the soil samples were used to calculate the weight of water that can be absorbed in each of the study sites.
![]() (6)
(6)
where
W = is the amount of flood mitigation;
W1 = is the amount of saturation water content;
W2 = is the amount of moisture content.
The spatial pattern of soil bulk weight saturation water content and moisture content in different study sites were used to calculate the flood mitigation benefit. The volume of flood mitigation was calculated using the following equation below in accordance with Science-Direct (2009).
![]() (7)
(7)
where
W (m3) is the volume of flood mitigation;
I is the study sites A, B, C;
P1 is the saturation water content at ![]() site A, or B or C;
site A, or B or C;
A1 is the moisture content at ![]() site A or B or C;
site A or B or C;
D1 is the bulk weight at ![]() site;
site;
S1 is the area at ![]() site;
site;
H is the mean soil thickness for study sites (20 cm).
2.5. Statistical Analysis
One Way Analysis of Variance (ANOVA) was used to compare values of characteristics (bulk weight, moisture content and saturation water content) of the soil samples for the three study sites. The techniques was also employed to compare the floral and faunal abundance across the three study sites A, B and C. after this t-Test was also used to compare the sample means. The level of significance for all statistical tests was p > 0.05 while all calculations were carried out with aid of MINITAB version 15 statistical package.
3. Result and Discussion
3.1. Results
Field data of bulk weight, moisture content and saturated water content are presented in appendices A, B and C.
3.2. Bulk Weight
For bulk weight, the highest mean value of 390 ± 23 g B was recorded in sub site B and the lowest of 316.25 ± 18 g A was obtained for sub site A, while the value for C which was 352.5 ± 15 g C was in-between the two. The difference in bulk weight over the study sites were significantly different (p < 0.05) because its p-value is 0.007 which is lower than 0.05 (Table A1).
3.3. Moisture Water Content
For moisture water content, the highest mean value was recorded in sub-site A with 58.62% + 9% A and the lowest in site B with 28.69% ± 8% B. Site C recorded an in-between value of 42.1% + 6% C. The differences in moisture content over the study sites were significantly different p < 0.05. Because the p has a value of 0.0000016 which is lower than 0.05 (Table A2).
3.4. Saturated Water Content
The result of saturated water content for the three sites shows marked differences, the highest value of 80.5% ± 6% B was recorded in sub site B, while the lowest mean of 64.6% C was recorded in C. However A with 73.5 ± 3A was placed in-between. The differences in saturation water content over the study sites were significantly clear as p value of 0.012 was lower than the critical value of 0.05 (Table A3).
3.5. Floral Diversity
Floral diversity in the three sites were examined and the result reflected abundance measures, frequency, abundance and density of the species. The most abundant species in site A is Dryopteris spp. (6.6), the most frequent being Trephosia pedicellatum and Assystasia gangetica (100%) and the specie with highest density is Assystascia gangetica (6.5). The table result further showed that Pennisetum spp. (100%) was the most frequent, dense and abundant species followed by Aspilia Africana. The least frequent, dense and abundance being Luffa cylinderica. In site C, the most abundant dense and frequent specie is Raffahookeri while the least frequent, dense and abundant is Azollapinnata. The differences in the number of individuals and abundance were significantly different p > 0.05. The biodiversity indices of vegetation was highest in site A![]() , followed by C
, followed by C ![]() and lowest in site B
and lowest in site B . Also species richness of the study site show that the highest number of floral species was recorded in A (15), while C had the least number (7).
The result of faunal study revealed that the wetland has a total of 51 Arthropods, 15 Diplopods and 10 Annelids which were collected by dry extraction and 8 mammals were caught. In site B 35 Arthropodes, 14 Diplopods and 20 Annelids were collected by extraction and 23 mammals were caught in site C 19 Arthropodes, 3 Diplopods and 1 Annelid were collected by extraction. No mammal was caught. On species richness, the distributions of the species across the study sites were also studied and the result showed that the highest number was recorded in site A and B with the arthropods having the highest number (5 species).
Flood mitigation volume was calculated and the result shows that site B has the highest volume of 6.4 × 10⁶ m3, followed by site C with 2.4 × 10⁶ m3 and least by site A that has the value of 1.5 × 10⁶ m3.
4. Discussion
This study shows that the effectiveness of the wetlands soil for flood mitigation may vary depending on the size of the area, type and condition of vegetation slope and even the location of the wetland in the flood patch and saturation of wetland soils before flooding [16] . The parameters (bulk weight, moisture content and saturation water content) were used as indicators of how well the Apiti wetland is performing its flood mitigation function. All the parameters exhibited clear spatial variation in the three sites as revealed in the previous section. The high mean value of saturation water content in the area shows that site B has the highest, indicating that the capacity of these soils for flood mitigation is strong [17] . However, sites with lower values could be attributed to the higher water table of those areas, because according to Ming et al. [17] , the higher the water table the less the storage capacity. Vegetations in the 3 sites were compared and the result revealed that species/flora abundance showed a significant increase from one site to the other. This can be attributed to the change in the hydrology of the area whose alteration can affect the abundance of plant community.
Species diversity of flora on sites also varies in the 3 sites. The area with low species diversity could be traced to agricultural activities that remove vegetation during clearing and burning in preparation for planting [18] . Again, in site C, the low species diversity is attributable to the waterlogged state of the site. Furthermore, faunal abundance in the three sites was compared and the result showed that there is an increase in the abundance of soil fauna from site to site. The most abundance soil arthropods are camponetus species. Also the number of earthworms is generally low and could be attributed to the water logging of the sites.
The low number of mammals in the sites especially in site C could probably be because of the tarred road that passes through the heart of the area which can disrupt habitat community forcing them to move to a more sensitive interior environment. Species can be killed on the roads which may result to increased animal mortality. The highest species diversity was recorded in site B and lowest in site C. The diversity recorded in C could be as a result of the water logged nature of the area which can support only fauna that thrive on hydric soil. These wetland flora and fauna also contribute to attenuation of flood water by slowing down the speed of runoff and helping to keep the pore species in soil open thereby aiding infiltration of water into the soil [19] .
In order to analyse how well the measurable parameters help to mitigate floodings, the volume of flood mitigation was calculated and the result shows that volume of flood mitigation is largest in site B and least in A. This implies that moisture content in site B is lowest but with the highest saturation water content. The conclusion is that the volume of flood mitigation per site in Apiti wetland is highest in site B followed by site C and least in site A. Human activities in sites A and C are high and should be decreased so that the flood mitigation benefit of Apiti wetland can be improved.
5. Conclusion
The parameters, bulk weight, moisture content and saturation water content interact to create the hydrology of individual wetland. The hydrology is largely responsible for vegetation of the wetland which in turn affects the value of the wetland to animals and man. The wetland soils of Apiti have strong affinity for water, hence the high value of the flood mitigation volume in the area. The Apiti wetland being in a completely rural area without other means of livelihood except agricultural, surplus of the population piles up on the wetland. The activities at the wetland could be closely monitored to ensure that its flood mitigation value is improved.
6. Recommendations
1) The Government in collaboration with the community should monitor and eliminate all activities that could increase runoff and reduce drainage capacity in Apiti wetlands.
2) Public enlightenment should be undertaken using the findings of this work to teach the inhabitants of the area the various importance of wetland conservation to flood control.
3) There should be establishment guidelines for urban and rural land use to aid the sustenance of wetlands.
4) There should be a regulation by the Federal Ministry of Agriculture on the wise use of wetland resources in Nigeria.
5) Restoration and conservation of wetlands should be incorporated into the flood control strategies.
References
- Ezenwaji, M.N. (2010) Flood mitigation Parameters of Apiti Wetland Soil in Umuawulu, Awka South LGA, Anambra State. Unpublished M.Sc. Thesis, Nnamdi Azikiwe University, Awka.
- Agbarya, G. and Barbie, E.B. (2000) Valuing Groundwater Recharge through Agricultural Production in Hadejia― Nguru Wetlands in Northern Nigeria. Agricultural Economics, 22, 247-259. http://dx.doi.org/10.1111/j.1574-0862.2000.tb00073.x
- Oyebande, L.E., Obot, O. and Bditiya, H.H. (2003) An Inventory of Wetlands in Nigeria. Report Prepared for World Conservation Union IVCN, West African Regional Office Ouagodo Ugou, Burkina Faso.
- Uluocha, N.O. and Okeke, I.C. (2004) Implications of Wetland Degradation for Resource Management: Lesson from Nigeria. Geo Journal, 61, 151-154. http://dx.doi.org/10.1007/s10708-004-2868-3
- Hollis, G.E. and Thompson, J.R. (1993) Water Resources Developments and the Hydrological Impacts. The Hadejia― Nguru Wetlands. IUCN Gland, Cambridge. http://www.epagov/wetlands/pdf/degradation
- Guo, Z.W. and Li, D.W. (1998) The Assessment of Water Regulation of Ecosystem. Journal of Natural Resources, 3, 242-247.
- Wu, B.F., Juang, J.L. and Shen, L.J. (2000) Analysis and Evaluation of Prevention Flood of Wetlands―Tukling East Dongting Lake as an Example. Geographical Research, 19, 190-193.
- Xu, J.M. (2001) Study on Assessment and Sustainable Development of Wetland on Yellow River Delta (Dongying City). Doctoral Dissertation, Chinese Agricultural Academy of Science, Beijing, 15-17.
- Ahmed, D. (2008) Developing the Wetlands of Sokoto―Rima River Basin around Goronyo. Journal of Agriculture, 18, 64-71.
- Ezenwaji, E.E. and Orji, M.U. (2011) Cluster Analysis of the Factors of Wetlands Degradation in Ogbaru Wetland S.W. Anambra State, Nigeria. Proceedings of the 19th Annual Conference/workshop of the Foundation for African Development through International Biotechnology (FADIB), 23-26 November.
- Wilson, R.C. (1975) The Geology of Western Railway, Section 1: Iddo to Okuku. Geological Survey of Nigeria Bulletin, 2, 63.
- Science Direct (2009) Ecological Economics: Flood Mitigation Benefits of Wetland Soil. A Case Study. http://www.aginfernetwork.net/whalecom
- Li, J.J., Zheng, Y.S. and Wang, Y. (1983) Soil Geography. Advanced Education Press, Beijing, 245-247.
- Yao, X.Y. (1996) Quantitative Analysis on Water and Soil Retaining Benefits of Forest for Erosion Control in Jinzai Country of Anhui Province. Water and Soil Conservation of China, 8, 23-28.
- Liu, M.L. (1998) Study on Benefits of Water Source Conservation Soil in Fenghuang Mountain. Management of Forest Resources, 6, 52-54.
- USEPA (2009) Wetland Degradation. http://www.epa.gov/wetlands/pdf/degradation
- Jiang, M., Lu, X.-G., Xu, L.-S., Chu, L.-J. and Tong, S.Z. (2006) Flood Mitigation Benefits of Wetland Soil―A Case Study in Mamoge National Nature Reserve in China. Ecological Economics, 61, 217-223. http://dx.doi.org/10.1016/j.ecolecon.2006.10.019
- USEPA (2001) Threats to Wetlands. http://www.epa.gov/wetlands/pdf/threatspg
- Cohen, R. (1997) Functions of Riparian Areas for Flood Control. River Advocate. River Ways Programme, Massachusetts Department of Fish and Game. www.mass.gov/dwelle/derriverway/.../ripariaan.assesssed 15/05/2009
Appendix

Table A1. Bulk weight of soil samples from sites A, B, and C.
Table A2. Moisture content of the study sites.
Table A3. Saturation water content in %.
NOTES

*Corresponding author.