Journal of Environmental Protection
Vol. 4 No. 4A (2013) , Article ID: 30841 , 13 pages DOI:10.4236/jep.2013.44A006
Relationship of Morpho-Sedimentological Variations to the Fate of Hgand Zn-Polluted Sediments in the Contaminated Site of Porto Marghera, Lagoon of Venice, Italy
![]()
1Dipartimento di Scienze Ambientali Informatica e Statistica, Università Ca’ Foscari Venezia, Venezia, Italy; 2CNR—Consiglio Nazionale delle Ricerche, ISMAR—Istituto di Scienze Marine, Bologna, Italy; 3Coastal Planning & Engineering do Brasil, Santo Antônio de Lisboa, Florianópolis, Brasil; 4CNR—Consiglio Nazionale delle Ricerche, ISMAR—Istituto di Scienze Marine, Venezia, Italy; 5CNR—Consiglio Nazionale delle Ricerche, ISMAR—Istituto di Scienze Marine, Lesina, Italy.
Email: molinaro@unive.it
Copyright © 2013 Emanuela Molinaroli et al. This is an open access article distributed under the Creative Commons Attribution License, which permits unrestricted use, distribution, and reproduction in any medium, provided the original work is properly cited.
Received February 16th, 2013; revised March 17th, 2013; accepted April 19th, 2013
Keywords: Lagoon of Venice; Sediment Pollution; Bathymetry; Erosion-Sedimentation; Grain-Size; Management Plan
ABSTRACT
New data collected from twenty-six sites during 2008 in the contaminated Site of National Interest (SIN) of Porto Marghera within the Lagoon of Venice (Italy), which has been affected by the presence of an industrial zone for the last 80 years, were compared with data from a campaign performed in the same site 30 years before (1976-1978). The SIN was found to be heavily polluted in the earlier study, and several tons of Hg and Zn are still stored in soils and industrial channel sediments, potentially affecting the lagoon part of the SIN. Bathymetric variations, grain-size, Hg and Zn content in sediments were analysed. The severe contamination of the late 1970s (Hg 1.7 µg/g; Zn 754 µg/g) had fallen by the late 2000s (Hg 0.9 µg/g; Zn 225 µg/g). The fall in Hg and Zn contamination over the 30-year period was mainly linked to the patterns of geomorphological change inside the SIN that affected two distinct sub-areas: 1) a stable-depositional (SD) area in the Northern part, which exerted a “dilution” effect on contaminants, with significant deposition (~11%) of coarse-grained sediments (63 - 8 µm), and 2) an area characterised by moderate-to-severe-erosion (MSE) to the South, which saw the loss (~13%) of pollutant-bearing fine-grained sediments (<8 µm). A budget calculation in the MSE sub-area showed a loss of ~2.5 tons for Hg and ~700 tons for Zn over three decades, most of which was exported to other parts of the LV or at the open sea. A similar amount is still stored in the SD area, which will be subject to erosion if hydrodynamic conditions change in the future. This study provides useful support to decision-making systems by helping to select hot-spots for remediation measures.
1. Introduction
Sediments are good environmental indicators of climatic and geological processes occurring in the past. Since the industrial revolution, human-made chemicals have been released into surface waters. Due to their properties, many of these chemicals stick to sediment, which thus acts as a potential sink for many hazardous chemicals. Even where water quality is improving, the legacy of the past may still be present in the form of contaminated sediments hidden at the bottom of lagoons, estuaries and seas and on the floodplains of river basins. These sediments thus retain a record of the emission, dispersion and deposition of pollutants and may become a secondary source of pollution when they are eroded and transported further afield [1,2]. Mediterranean coastal lagoons are affected by a variety of activities including fishing and aquaculture, town-planning (many urban areas develop along lagoon shores), industry and energy production, infrastructure (ports and harbours) and environmental protection measures [3].
The morphological changes affecting the Lagoon of Venice (LV) during its history result from a combination of natural processes and human activities. Its geological, morphological and hydrodynamic evolution due to natural and anthropogenic processes is described in [4-6]. Increased dredging of lagoon channels for navigation purposes has had a significant impact on the lagoon’s morphology and significantly altered water circulation within the lagoon [7]. The most important channels are the Vittorio Emanuele III channel (mean depth 7 m, dredged in 1926) and the Malamocco-Marghera channel (length 20 km, mean width 200 m, mean depth 12 m, dredged in the late 1960s), which allows the entrance to the lagoon of medium-sized container ships, bulk carriers and tankers from the Adriatic Sea (Figure 1). The slopes at the edge of the channel are very steep and must be maintained by a dredging program.
Major development of industrial activities took place in the period 1930-1980, when inputs from the industrial area and the catchment basin increased dramatically. These activities polluted several million m3 of material (soils and sediments) with various levels of contamination. The new regulatory framework established by the Ministry of the Environment in the 1990s [8] imposed strict guidelines regarding the disposal of this material. Subsequently the area was one of 57 indicated by the Italian Ministry of the Environment as contaminated National Interest Sites (SINs). These sites are characterised by very high levels of pollutants in soils, subaqueous sediments, and surface and ground waters, and are slated for environmental clean-up (Italian law 426/1998).
Most published papers have focused on the lagoon sediments, whose sedimentological and chemical characteristics have been investigated by several authors since the 1980s [9-20]. Specifically, Bernardello et al. [19] studied the changing state of heavy metal contamination in 25 sediment sites in the central part of the LV, which includes the SIN, in the period 1987-1998 and Zonta et al. [20] concentrated on the southern part of the SIN (south of the Vittorio Emanuele III channel) (Figure 1). Our study focuses on changes in Hg and Zn concentrations in the lagoon sediments of the SIN (~23 km2) over a 30-year period by comparing new data collected from 26 sites in 2008 to data from a campaign performed in the same sites 30 years before (in the period 1976- 1978). In addition, this study presents new data on sediment texture properties that complement recently published data on changes in bathymetry and morphology in the area in roughly the same period [5,6]. Mercury and
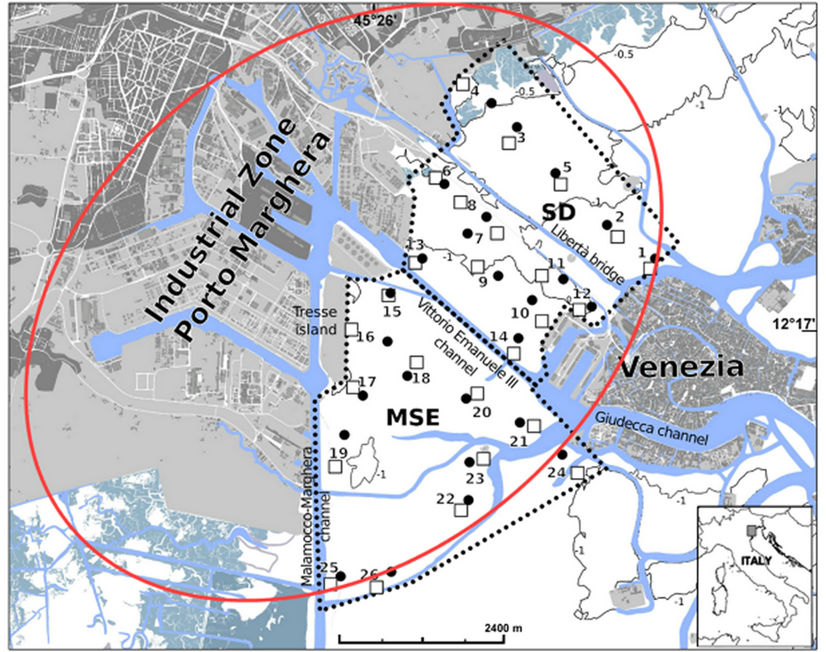
Figure 1. Map of SIN (red line). Location of sediment sampling sites: 1976-8 campaign (□) and 2008 campaign (●). Area delimited by dotted line corresponds to study area. Stable-depositional (SD) area and moderate-to-severe-erosion (MSE) subareas identified in waters of SIN.
Zinc were selected because they are suggested by most authors as the main indicators of past industrial pollution. As long ago as the 1980s Pavoni et al. [21] stated that sediment contamination in the LV was mainly due to a chloro-alkali plant in which “De Nora” mercury cathodes were used and to a metallic zinc production plant using sphalerites as raw material.
The main goals of the present paper are: 1) to show how changes in bathymetry and grain-size affect the spatial distribution and transport mechanisms of Hg and Zn in sediments; 2) to calculate Hg and Zn budgets in the study area over the period, since these sediments have already been and might in the future become a secondary source of pollution for the whole of the central LV, and, 3) to show that the distinct patterns seen in the northern and southern parts of the SIN may require different management strategies. This is a key study, not only for local purposes but also in a broader sense, helping to improve our understanding of how morpho-sedimentological changes affect polluted transitional environments and thus providing knowledge for the future management of similar polluted areas.
2. Review of Data for the Study Area
2.1. Contaminated Site of Porto Marghera
Italian law 426/1998 defined the industrial area of Porto Marghera as a severe environmental hazard site and placed it at the top of the list of contaminated sites of national interest (SIN). The boundary of the SIN was established by the Ministry of the Environment (Decree of February 23rd, 2003) in order to plan soil and sediment clean-up and management. The SIN has a total surface area of 58 km2, of which ~60% is land and ~40% is water (between the City of Venice and the industrial zone, Figure 1). The site includes the land where the industrial plants are located (19 km2) and part of the adjoining land (12 km2), the inner tidal channels (~4 km2) and ~23 km2 of tidal flats (with ~2 km2 of salt-marshes).
We selected mercury and zinc from the studied heavy metals because they are representative of two different periods in the development of the industrial zone of Porto Marghera: Zn extraction from sphalerite was conducted from the 1940s to the 1980s, whilst the chloro-alkali plant, where Hg cathodes were used, came on stream in the 1950s and was still in use until recently.
2.2. Soils inside the SIN
Soils inside the Porto Marghera industrial zone, and in the drainage area immediately around it, have been studied since several un-authorised large-scale dumps, containing mainly dangerous toxic wastes from industries
(particularly chemical plants), were found in the area [22]. A complete survey was conducted in order to prepare a Master Plan for remediation, in which PAHs and metals (As, Cd, Hg and Zn) were found to be the most important contaminants in soil strata up to 5 m depth [23]. Among the various metals responsible for soil pollution, Hg and Zn were observed to exceed the legal limits most frequently. Approximately 7 km2 of the land inside the industrial plant requires remediation (corresponding to ~5 Mm3), the mean soil concentrations being ~6 μg/g for Hg and ~950 μg/g for Zn, with maximum values up to 110 μg/g for Hg and 24,000 μg/g for Zn [23]. The amount of metals stored in the soil was estimated to be in the range of 20 - 60 tons for Hg and 3 - 10,000 tons for Zn (Table 1).
2.3. Industrial Channels
Highly polluted sediments have been found inside the industrial channels and at the edge of the lagoon in the immediate vicinity of the industrial zone by several authors [7,13,18]. All authors highlight the role of industrial channels in the high contaminant levels of lagoon sediments in the vicinity of Porto Marghera, due to the dispersion of contaminated sediments during dredging activities. A thorough review of the contamination of all industrial channels was carried out, and the results showed mean values of 10 μg/g for Hg and ~1000 μg/g for Zn, with downcore values of up to 130 μg/g for Hg and 10,700 μg/g for Zn. The estimated amount of metals stored in the industrial channels was 200 tons for Hg and 10,000 tons for Zn [7,24,25].
2.4. Soils Outside the SIN
Scazzola et al. [26] studied the heavy metal concentrations in soils in the vicinity (2 - 10 km) of the Porto Marghera industrial area and found mean values of ~0.2 μg/g for Hg and ~150 μg/g for Zn. Those figures are not very different from soils sampled far from Porto Marghera (>10 km) [27]. The same authors conducted a survey of top-soils in the Veneto Region and found average values of 0.3 - 0.4 μg/g Hg and 150 - 170 μg/g for Zn.
2.5. Background Values
Giandon et al. [27] found average background values of 0.3 µg /g for Hg and 112 µg/g for Zn in the soil samples of the physiographic units of the Veneto Region belonging to the LV watershed. Scazzola et al. [26] found similar background values for soils in the vicinity of Porto Marghera industrial zone.
Background values for LV sediments have been estimated by various authors [13,28] from concentrations in
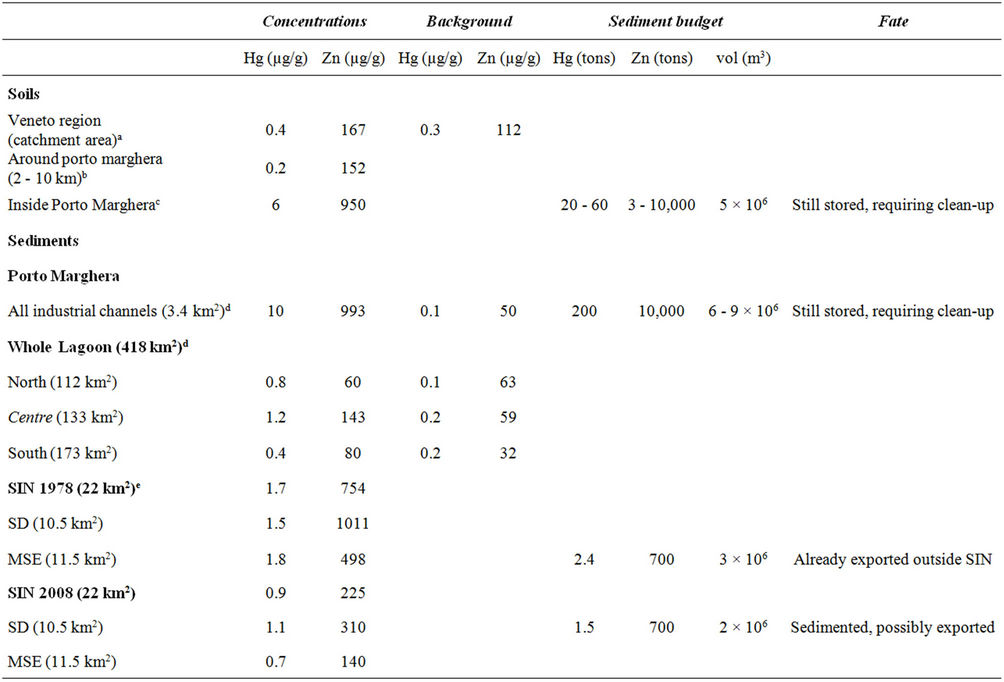
Table 1. Average heavy metal content and background values of soil and sediments in different compartments of the Lagoon of Venice. (a) [27]; (b) [26]; (c) [23]; (d) [7]; (e) present study.
the deepest strata of radio-dated cores (corresponding to pre-industrial values) and from reference values reported in the literature for non-polluted sediments [21, and references therein]. Most authors suggest using different background values for the three sub-areas of the lagoon (north, centre and south). Apitz and co-workers [28] studied the variability of natural background levels on the lagoon scale, suggesting the use of a range of guideline values instead of just one, including 0.2 - 0.3 µg/g for Hg and 40 - 130 µg/g for Zn. Bernardello and co-workers [19] used average background values of 0.2 µg/g for Hg and 70 µg/g for Zn for the central part of the lagoon. For the present study we used 0.2 µg/g for Hg and 59 µg/g for Zn, the mean values calculated for the central lagoon by [7] (Table 1).
3. Materials and Methods
3.1. Sediments Sampling and Analysis
The surficial sediment samples from the lagoonal tidal flats considered in this study derive from a campaign performed in 2008, collecting twenty-six sediment samples from beds at depths of between 0.4 and 2.4 m (Figure 1). The sediment samples, hereafter referred to as “Lag08”, were collected using a piston corer by the Venice branch of the Institute of Marine Sciences (CNR). All samples were collected in the same sites as another campaign performed in 1976-1978, details of which can be found in [5]. The samples from this earlier campaign are hereafter referred to as “Lag70”.
This comparison has a longer time-lag (30 vs. 10 years) and a higher sampling “resolution” (1 sample/km2 vs. 1 sample/5 km2) than the study by [19] in the central part of the LV. Moreover, it extends the study by [20] to the northern part of the SIN.
The sample treatment methods and grain-size analytical procedures used in the two sampling campaigns were essentially identical and are well described in [5]. For the Lag70 dataset, heavy metal concentrations were extracted from the published paper by [11]. For the Lag08 dataset, zinc content was determined by digesting a sample aliquot in hot HNO3, the leachate being analysed by ICP (Perkin Elmer, Optima 5300 DV). For mercury, refluxing digestion with an H2SO4-HNO3 mixture was performed (USEPA, 1994) [29], and the analytical determination was conducted by the cold vapour AAS technique. The precision
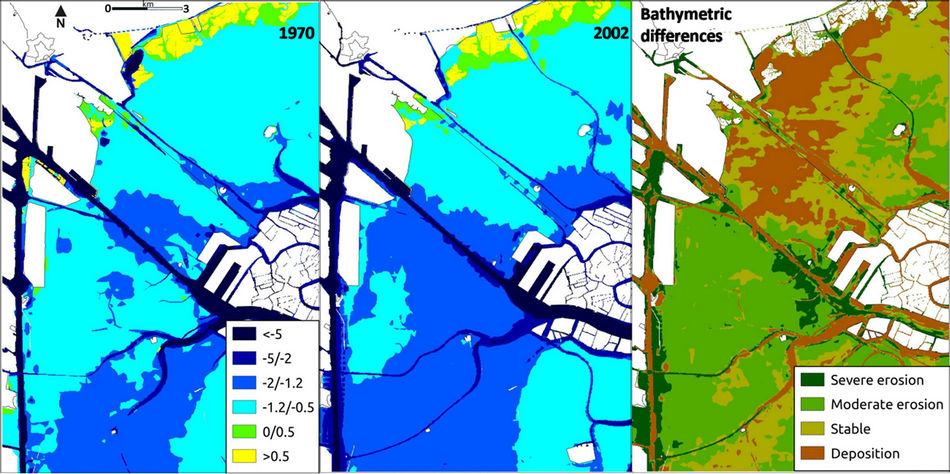
Figure 2. Bathymetric maps of SIN (1970; 2002), with bathymetric data shown in metres (increasing depth shown by progressively darker blue colours). Sedimentation map showing differences between 2002 and 1970. Deposition = differences of >0.1 m, stability = differences of ±0.1 m, moderate erosion = differences of between −0.5 and −0.1 m, severe erosion = differences of <−0.5 m.
of the instrumental analysis was checked with reference to a control chart for each heavy metal. Data quality was monitored using 10% procedure blanks and 10% sample replicates. Recovery of Zn, checked by analysing certified reference material for heavy metals (BCR-277r estuarine sediment, Community Bureau of Reference), was 86% of the certified total concentration. All analytical data refer to the upper 10 cm of sediments.
3.2. Bathymetric Datasets
The bathymetric datasets used for assessing historical changes in the LV are derived from two maps published by the Venice Water Authority Information System (MAV) which are based on survey campaigns conducted in 1970 and 2002. The “1970 dataset” (~179,000 points) was collected in the period 1968-1971. The “2002 data-set” (~166,000 points) was collected from late 1999 to June 2002, further data being collected in spring 2003. Details of the bathymetry, data processing and analysis can be found in [5,6]. The bathymetric values of the 1970 grid were subtracted from the 2002 values, generating a raster map of depth differences with the same resolution as the input maps. The final map [(2002 bathymetry) − (1970 bathymetry) − (subsidence between 1970 and 2000)] enabled a detailed assessment of the morphological changes occurring over the last 30 years. In the present paper a higher resolution was used in order to improve sediment budget calculations for the SIN, which belongs to the “Lido” sub-area, as identified by [5].
The periods of the bathymetric surveys and sampling do not match exactly, but it is reasonable to assume— especially for the southern part—that erosion processes were active in both 1970-1978 and 2000-2008, and were probably much more evident in the 1970s, immediately after the excavation of Malamocco-Marghera channel. Our calculations of the quantity of metals exported from the SIN to the rest of the LV and the sea can therefore be considered a lower limit.
4. Results and Discussion
4.1. Morphological Transformations and Erosion/Sedimentation Patterns
The evolution of the whole LV over the last 30 years is well described in [5,6]. Both studies showed that the main morphological process in the LV in the 1970-2002 period was extensive deepening due to severe erosion (Figure 2 in [5] and Figure 3 in [6]). Both authors identified the “Lido” sub-area as being mainly stable or rising to the north of Venice city, and moderately erosional south of Venice.
Colour-shaded bathymetric maps of the SIN for the two periods were compared and the bathymetric differences in metres were calculated (Figure 2). Subsidence data [30] contributing to bathymetric change were accounted for by subtracting these values from the differences at each location.
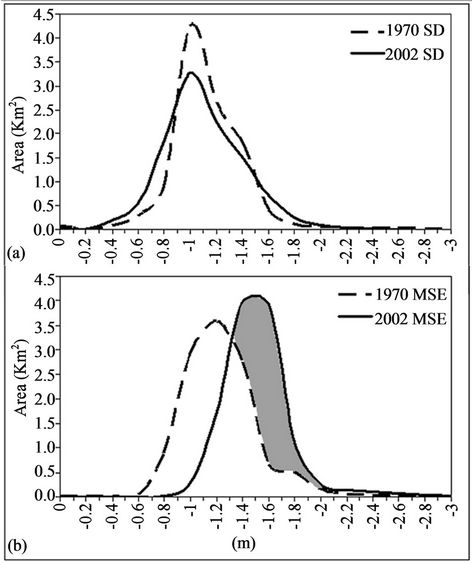
Figure 3. Frequency distributions of specific elevations in 1970 (dotted line) and 2002 (solid line) in SD (a) and MSE (b) sub-areas (see Figure 3). In (b), note shift of mode from −1.1 to −1.60, and increase in areas deeper than −1.4 m.
The SIN clearly shifted towards lower elevations, but only in the area south of the Vittorio Emanuele III channel, where the highest frequency depth in 2002 was around −2 m. The differences in elevation for the two periods are presented in the form of a deposition/erosion map (Figure 2). A decrease in depth between the two time periods indicates sediment deposition (light brown colours). An increase in depth indicates sediment erosion (green and dark green representing moderate and strong erosion respectively). Deposition and stability prevailed in the northern part of the SIN. The sheltered areas on the landward side of the lagoon north of the Vittorio Emanuele III ship channel were the most stable and were characterised by deposition.
4.2. Differences in Tidal Flats in the SD and MSE Sub-Areas
Changes in bathymetry between the 1970s and 2002 provide data for the zonation of the SIN. The SIN should not be considered as a single unit, but as divided into two sub-areas. Changes occurring during the 30-year period are specific to each sub-area and reflect erosion versus deposition and hydrodynamic energy. The navigation channels dredged in this part of the lagoon have deeply modified the hydrography and significantly altered water circulation in the area. Moreover, the south-easterly winds cause significant waves with heights of up to 0.2 m. The area located to the north of the Vittorio Emanuele III channel is mainly stable-depositional (SD) (total surface area ~11 km2); the area south of this is mostly characterised by moderate to severe erosion (MSE) (total surface area ~12 km2).
Focusing on the tidal flats, the specific characteristics of each sub-area were investigated. Figure 3 shows the comparative hypsometries (1970 vs. 2002) for each subarea of the SIN: in the SD sub-area, the morphology is relatively similar for the two periods considered, with beds mainly stable or rising. The frequency curves indicate broad similarity for the most frequent elevations (−1.1 m), associated with an increased frequency of elevations in the ranges –0.8 m to −0.6 m and −1.4 m to −1.0 m. Within the SD sub-area, 4.2 km2 were stable and 4.4 km2 were depositional. Therefore ~80% of the surface area was either shallower in 2002 than in 1970 or the same depth. The amount of material deposited was ~1 Mm3 with an altimetric rise of ~10 cm. Sediment supply to the SD sub-area is the result of the settling of suspended particles in freshwater inputs from the Silone, Dese and Osellino rivers, which are located in the northern part of the LV and account for about 15 × 103 t·y–1, i.e. ~50% of the total riverine inputs to the lagoon [31]. The sediments also originate from the erosion of pre-existing saltmarshes, caused or exacerbated by human activities [32].
The MSE sub-area saw the greatest changes in morphology. Most of the sub-area experienced moderate erosion (−0.5/−0.1 m) .The hypsometries show a clear drop of 0.5 m in the modal depth (from −1.1 to −1.6 m), accompanied by net losses of tidal flats (elevations between −0.8 and −1.2 m). Comparison of the two curves in Figure 3 highlights the greater frequency of depths of below –1.4 m in 2002. The main phenomenon affecting this sub-area is thus progressive deepening, with an increase in the frequency of sub-tidal flats from −1.3 to −2.0 m deep. In total, 10 km2 experienced deepening, of which 9 km2 saw moderate erosion and 1 km2 severe erosion. Therefore ~85% of the surface area was deeper in 2002 than in 1970. The amount of material eroded was ~3 Mm3 with a mean deepening of ~30 cm. The recorded deepening of tidal and sub-tidal flats coincides with further sediment loss due to higher energy levels (currents) resulting from the excavation of the Malamocco-Marghera channel.
4.3. Changes in Sediment Textural Characteristics
In the Lido sub-basin [5] showed that most of the recent sediments had lower mud content than those of the 1970s, but did not discuss the differences between northern and southern parts. For this study we investigated the grainsize composition of the two datasets in the SD and MSE sub-areas and the differences were highlighted. The textural trends are represented on a ternary diagram (modified from [33]) based on the >63 µm, 63 - 8 µm and <8 µm fractions (Figure 4). The 8 µm size boundary marks the transition between the sortable coarser-grained and the aggregated finer-grained sub-populations. The <8 µm fraction is the non-sortable silt fraction, consisting of both single and aggregated or flocculated particles, whereas the 8 - 63 µm fraction is considered to consist of nonaggregated silt particles [34-36]. Fine sediments (<8 µm) play a fundamental role in the study of metal mobility in polluted aquatic sediments due to their capacity to store pollutants [37]. The diagram enhances the environmental sensitivity of textural sediment classification by distinguishing between different hydrodynamic conditions. This is reflected in the location of the data points within the diagram, with energy increasing from <8 µm to 63 - 8 µm. In the SD sub-area the textural gradient shows a shift towards higher 63 - 8 µm content between 1970 and 2002, indicating a general increase in energy in this sub-area.
In the MSE sub-area, most of the sediments show depletion of the finer fraction, and consequently an increase in the coarser fractions (>63 µm, 63 - 8 µm). In both subareas the result is a coarsening of the sedimentary facies due to distinct sedimentary processes.
In order to explore the relationship between variations in sediment texture and erosion/sedimentation patterns, the different erosion/deposition characteristics of the two sub-areas were considered and the grain-size fraction for each of them was analysed. The average differences be-
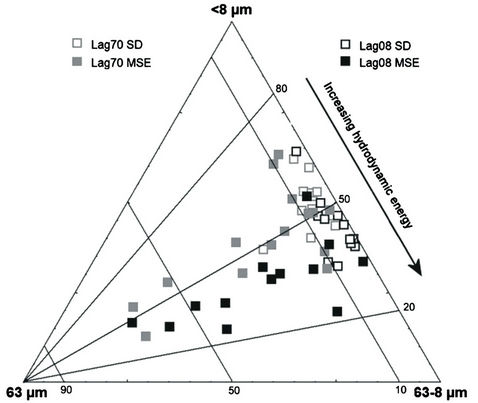
Figure 4. Ternary diagram of surficial sediments based on >63/63 - 8/<8 µm ratios.
tween the Lag70 and Lag08 values of two grain-size intervals (63 - 8 µm and <8 µm) in the SD and MSE subareas were calculated. The SD sub-area was found to have experienced an increase of ~11% (and hence deposition) in the 63 - 8 µm grain-size fraction. The MSE sub-area experienced a reduction of ~13% (and hence erosion) in the <8 µm grain-size fraction. The changes in the textural properties of the sediments in the two sub-areas thus indicate hydrodynamic processes characterised by different energy levels. The spatial distribution of changes in 63 - 8 µm content in the SD sub-area and in <8 µm content in the MSE sub-area is presented in Figure 5.
4.4. Characterisation of Sediments in Term of Heavy Metals
Sediment is an essential, integral and dynamic part of any lagoon basin, as a source of life in a healthy environment. Unfortunately, sediment also acts as a potential sink for many hazardous chemicals, and above a certain level of contamination this will result in negative impacts such as loss of biodiversity. Concentrations of mercury
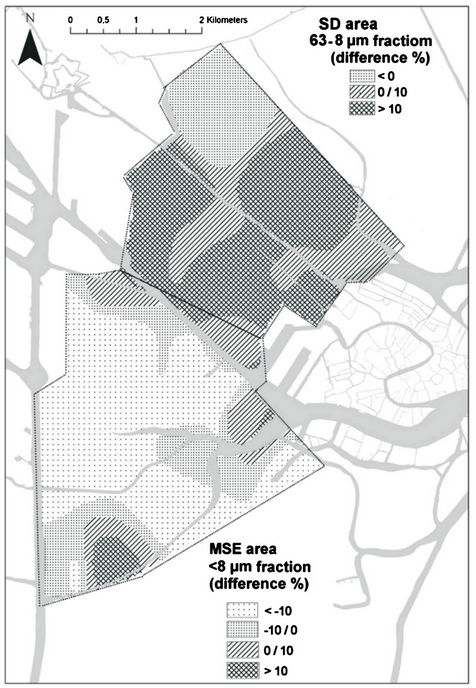
Figure 5. Differences between Lag08 and Lag70 in distribution of 63 - 8 µm fraction (SD sub-area) and <8 µm fraction (MSE sub-area).
and zinc were highest in soils inside the industrial zone and in the industrial channel sediments, with mean values of up to 10 µg/g for Hg and ~1000 µg/g for Zn (Table 1), posing the risk of dispersion of historically contaminated sediments. Hg poses problems with respect to standards for ex situ management of dredged sediments, since it frequently exceeds the limit of 0.5 µg/g for material that can be reused in the lagoon [25]. In addition, Hg is known to exert neurotoxic and genotoxic effects on humans once transformed into the bioaccumulable organometallic form mono-methylmercury [38-40], and its redistribution in the LV due to tidal forcing was recently reviewed [41]. Zn was found to exceed the limit (200 µg/g) less frequently, but it is by far the most abundant anthropogenic metal in the Lagoon of Venice [28,42-44].
The concentrations of Hg and Zn in the SIN sediments are summarized in Table 1. Analysis of the average heavy metal content of the SIN as a whole shows much higher values in Lag70 sediments (Hg: 1.7 µg/g, Zn: 754 µg/g) than Lag08 sediments (Hg: 0.9 µg/g, Zn: 225 µg/g). In Lag70 the Zn content of the SD sub-area (~1000 µg/g) is more than twice the value in the MSE sub-area, whilst Hg values are slightly higher in the MSE sub-area. In both sub-areas, the concentrations of both heavy metals are much lower in Lag08 than in Lag70. Our data are in close agreement with those of the subarea off Porto Marghera described in [19], who found a decrease in Hg values from 1.6 to 1.1 µg/g and in Zn from 430 to 250 µg/g, from 1987 to 1998.
The spatial distribution of Hg and Zn content in the surface sediments in the two years of sampling is shown in Figure 6, together with background levels [7]. The
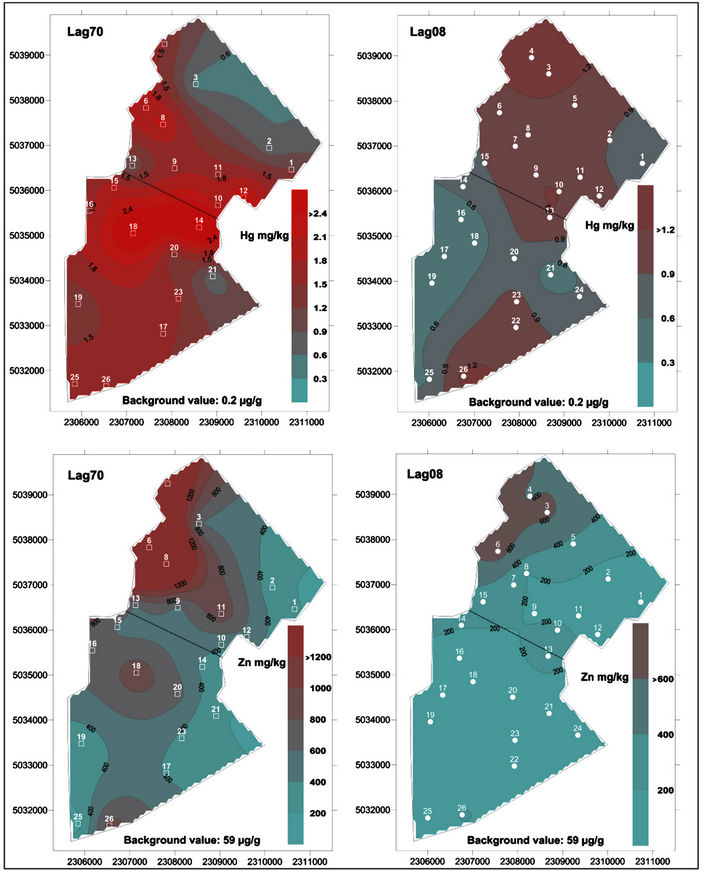
Figure 6. Spatial distribution of Hg and Zn content in surface sediments in Lag70 and Lag08.
levels of the two metals were higher than the reference background in both Lag70 and Lag08 sediments, but there was a clear-cut overall reduction of sediment contamination, with differences of up to 70%, observed for both metals at almost all stations. In the Lag70 dataset, the maximum Hg values were detected at stations 14 and 18, while the maximum Zn values were detected at Stations 6, 8 and 4. In Lag08, high Hg values were found in both the SD and MSE sub-areas (Stations 4 and 26), while the highest Zn values were seen in the SD sub-area, at Stations 6, 3 and 4, in the same area as 30 years before, where there are still signs of inputs from the industrial area.
4.5. Igeo
The geoaccumulation index (Igeo) introduced by [45]
makes it possible to evaluate contamination by compareing the current concentration of a trace element and its preindustrial levels. It is therefore a quantitative measure of metal pollution in aquatic sediments [46]. The index is expressed as follows:
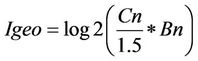
where Cn is the measured concentration of element n in Lag70 and Lag80 sediment samples and Bn is its geochemical background level. A factor of 1.5 was introduced to include possible variation of background values due to lithogenic variations. Igeo class 0 indicates the absence of contamination while Igeo class 6 represents the maximum possible contamination.
Figure 7 shows the geo-accumulation index for the two datasets. At most of the sampling stations in Lag70,
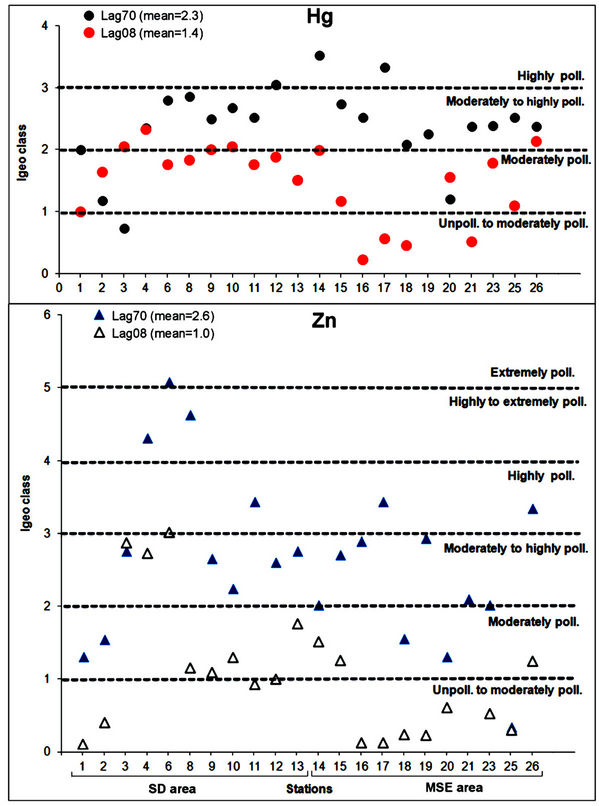
Figure 7. Igeo values for Lag70 and Lag08 at sampling sites in SIN area. Igeo ≤ 0 unpolluted; 0 < Igeo < 1 unpolluted to moderately polluted; 1 < Igeo < 2 moderately polluted; 2 < Igeo < 3 moderately to highly polluted; 3 < Igeo < 4 highly polluted; 4 < Igeo < 5 highly to extremely polluted; 5 < Igeo extremely polluted.
contamination ranges from moderately to extremely polluted for Zn, and from moderately to highly polluted for Hg. The Lag08 sediments are mostly unpolluted to moderately polluted (Igeo values of less than 2), although three stations in the SD sub-area were found to be moderately to highly polluted for Zn. Contamination was lower in the MSE sub-area than the SD sub-area for both metals.
In summary, the Igeo trend showed that in the 1970s the SIN was highly polluted and posed a risk to the health of the environment. For the data from the 2008 campaign both indices showed a decrease in pollution, particularly in the MSE sub-area.
4.6. Morpho-Sedimentological Changes as a Factor in Secondary Pollution
The sedimentological and morphological characterisations of the SIN provide better knowledge of pollutant mobility in the area. The hydrodynamic variations and consequently the morpho-sedimentological modifications of the study area establish the background to the present pollutant situation.
Sediment grain-size is a significant factor influencing the concentration of heavy metals in lagoon sediments, with metal concentrations tending to be significantly enriched in fine-grained sediments [47]. Fine particles adsorb soluble metals from the waters and carry them to the bottom sediments [48,49]. Indeed, the correlation coefficients between the two metals and the textural properties of sediments in Lag08 show that in the SD area Zn is highly positively correlated with the <8 µm fraction (r = 0.81, p < 0.05). For Hg the correlation is positive but weaker (r = 0.76, p < 0.05). Zn is highly negatively correlated with the 63 - 8 µm fraction (r = −0.80, p < 0.05). Hg also shows a negative correlation (r = −0.57, p < 0.05). In Lag08-MSE, Zn is again strongly positively correlated with the <8 µm fraction (r = 0.80, p < 0.05), and Hg even more so (r = 0.91, p < 0.05); no correlation was found between the metals and the 63 - 8 µm fraction.
In summary the SD and MSE sub-areas both show a decrease in the two metals over the last 30 years. The decreased pollution in the northern area (SD) is associated with significant deposition of coarse-grained sediments (63 - 8 µm) (Figure 5), rich in carbonates but with depleted metal concentrations. The decreased pollution in the southern area (MSE) is related to the erosion of fine grained sediments (<8 µm) (Figure 5), the eroded material being deposited either in the channels or transported all over the LV and out to sea through the inlets.
4.7. Budget Calculations
Figure 6 shows that in the period 1978-2008 there was a “natural” clean-up of the southern part of the SIN (MSE) due to an almost complete erosion of the top 30 cm of the polluted sediments of 1978. On the other hand, in the northern part of the SIN (SD), ~10 cm of “new” unpolluted sediments have settled over the “old” ones of 1978.
It was our goal to calculate the amount of Hg and Zn eroded from the MSE, in order to compare it to other sources of Hg and Zn in the LV (i.e. industrial channels, water discharges and atmospheric deposition). We calculated the heavy metal budget in two different ways:
a) for the MSE sub-area, the “lost” metals were calculated with reference to the volume of eroded sediments and the Lag70 heavy metal concentrations. We used the following equation:
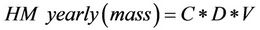
where HM is the mass (g) of heavy metal; C = average heavy metal concentrations·(µg/g) in Lag70; D = bulk dry density = 0.5 (g/cm3); V = bathymetric differences between 1970 and 2002 (m) multiplied by surface area (cm2).
b) for the SD sub-area we calculated the sum of the “new” sediments deposited plus the “old” sediments still in place below them. We used the same equation, with “C” = average heavy metal concentrations (µg/g) in Lag08 for the “new” sediments and C = average heavy metal concentrations (µg/g) in Lag70 for the “old” ones.
The amount of Hg lost from the SIN was calculated to be ~ 2.5 tons (i.e., 80 kg·y–1) and the amount of Zn was ~750 tons (23 tons·y–1). Bettiol at al. [50] reported that the annual Hg contribution from riverine and atmospheric loading to the lagoon as a whole was 24 kg and 15 kg respectively, while for Zn it was 18 tons for riverine and atmospheric sources combined. Therefore the MSE sub-area is a significant source of pollution, comparable to riverine and atmospheric loading. Contamination levels fall along a gradient towards the open lagoon over short distances, but this does not alter the actual quantity of contaminants. Moreover, Bernardello et al. [19] showed a redistribution of contamination around Porto Marghera, and found evidence that fine sediments (<8 µm) eroded from the SIN reach the southern basin of the LV. Berto et al. [51] reported a positive correlation between Hg concentrations in fine sediments and Nassarius reticulatus, and proposed that the fine suspended sediments associated with tidal flushing are a vehicle for pollutant dispersal from the industrial area.
In the northern part of the SIN (SD), which is still stable or subject to deposition, the amount of metals stored in the first 20 cm was found to be ~1.5 tons of Hg and ~800 tons of Zn.
4.8. Conclusions
· The National Interest Site (SIN) within the LV should not be considered as a single area, but rather as divided into two sub-areas: the northern sub-area is stable-depositional (SD) (11 km2) and the southern subarea is characterised by moderate to severe erosion (MSE) (~12 km2). The changes occurring in the 30- year period are specific to each sub-area, due to distinctions in erosion versus deposition and hydrodynamic energy.
· In the SD sub-area 4.2 km2 were stable, while 4.4 km2 experienced an altimetric rise (an increase in the frequency of depths of −0.6 to −0.8 m); the amount of deposited material was ~1 Mm3. Therefore ~80% of the surface area was no deeper in 2002 than in 1970. In the MSE sub-area a total of 10 km2 experienced deepening, of which 1 km2 saw severe erosion and 9 km2 moderate erosion (an increase in the frequency of depths of −1.4 to −1.8); the amount of eroded material was ~3 Mm3. Therefore ~85% of the surface area was deeper in 2002 than in 1970.
· Comparison of sediment textures in Lag08 shows that the SD sub-area experienced deposition of sediments in the 63 - 8 µm fraction (~11% increase), while the MSE sub-area saw erosion of the finer sediments (<8 µm) (~13% decrease). The result is a coarsening of the sedimentary facies in both the SD and MSE subareas, though this is due to contrasting sedimentary processes.
· Based on the geoaccumulation index (Igeo), the range of concentrations and degree of contamination from mercury and zinc in Lag70 constitute moderate to extreme pollution. The Lag08 sediments were classified as being from unpolluted to moderately or highly polluted. With respect to Lag70, the contamination decreased more sharply in the MSE sub-area than the SD for both metals.
· The SD and MSE sub-areas show a fall in contamination for the two metals over the last 30 years. The decreased pollution in the SD sub-area is associated with significant deposition of coarse-grained sediments (63 - 8 µm) (the “dilution” effect), while the decreased pollution in the MSE sub-area is related to the erosion of fine-grained sediments (<8 µm) (the “erosion” effect).
· In the MSE sub-area the yearly budget of heavy metal loss in the 32-year period (1970-2002) was 80 kg·y–1 for Hg and 23 tons·y–1 for Zn. Therefore the MSE was a “hot spot”, an important secondary source of pollution for the rest of the lagoon, the eroded sediments becoming a source of pollution as a result of their being transported and deposited all over LV. In the SD, the top 20 cm of sediment held ~1.5 tons of Hg and ~800 tons of Zn.
· In terms of management, the metals stored in the lagoon sediments of the SIN (i.e. of the SD and MSE areas) are a tiny fraction (less than 1%) of what is held in the soils of Porto Marghera and the industrial channels (see Table 1), but can still receive sediments from these industrial channels that might then be redistributed all around the lagoon.
5. Acknowledgements
We would like to thank Dr. Roberto Zonta for the samples collected in 2008 and Mario Pistolato for his assistance in the grain-size analysis. George Metcalf revised the English text.
REFERENCES
- SedNet 2004, “Contaminated Sediments in European River Basins,” 2004. http://www.sednet.org/download/Sednet_booklet_final.pdf
- X. Lu and E. Matsumoto, “How to Cut a Sediment Core for 210Pb Geochronology: A Supplement,” Environmental Geology, Vol. 49, No. 2, 2005, pp. 251-252. doi:10.1007/s00254-005-0079-y
- R. W. Duck and J. Figueiredo da Silva, “Coastal Lagoons and Their Evolution: A Hydromorphological Perspective,” Estuarine and Coastal Shelf Sciences, Vol. 110, 2012, pp. 2-14. doi:10.1016/j.ecss.2012.03.007
- E. Molinaroli, S. Guerzoni, A. Sarretta, A. Cucco and G. Umgiesser, “Link between Hydrology and Sedimentology in the Lagoon of Venice, Italy,” Journal of Marine Systems, Vol. 68, No. 3-4, 2007, pp. 303-317. doi:10.1016/j.jmarsys.2006.12.003
- E. Molinaroli, S. Guerzoni A. Sarretta, M. Masiol and M. Pistolato, “Thirty-Year Changes (1970-2000) in Bathymetry and Sediment Texture Recorded in the Lagoon of Venice Sub-Basins, Italy,” Marine Geology, Vol. 258, No. 1-4, 2009, pp. 115-125. doi:10.1016/j.margeo.2008.12.001
- A. Sarretta, S. Pillon, E. Molinaroli, S. Guerzoni and G. Fontolan, “Sediment Budget in the Lagoon of Venice, Italy,” Continental Shelf Research, Vol. 30, No. 8, 2010, pp. 934-949. doi:10.1016/j.csr.2009.07.002
- MAV-CVN (Magistrato alle Acque di Venezia-Consorzio Venezia Nuova), “Interventi per il Recupero Ambientale e Morfologico della Laguna di Venezia,” Mappatura dell’ inquinamento dei Fondali Lagunari, Studi ed Indagini, Ministry of Public Work, Final Report, 1999, 1300 p.
- Ministero Ambiente, “Protocollo Recante Criteri di Sicurezza Ambientale per gli Interventi di Escavazione, Trasporto e Reimpiego dei Fanghi Estratti dai Canali di Venezia, 8 Aprile 1993,” Technical Report, Venice, 1993.
- L. Menegazzo Vitturi and E. Molinaroli, “Il Ruolo della Caratteristiche Mineralogiche e Fisiche dei Sedimenti nei Processi di Inquinamento di un’Area Tipo della Laguna Veneta,” Atti Istituto Veneto SS LL AA, Vol. 9, No. 2, 1984, pp. 353-367.
- L. Menegazzo Vitturi, E. Molinaroli, M. Pistolato and G. Rampazzo, “Geochemistry of Recent Sediments in the lagoon of Venice,” Rendiconti della Società Italiana di Mineralogia e Petrologia, Vol. 42, No. 1, 1987, pp. 59- 72.
- R. Donazzolo, A. A. Orio,B. Pavoni and G. Perin, “Heavy Metals in Sediments of the Venice Lagoon,” Oceanologica Acta, Vol. 7, No. 1, 1984, pp. 25-32.
- A. Bertolin, P. Frizzo and G. Rampazzo, “Sulphide Speciation in Surface Sediments of the Lagoon of Venice: A Geochemical and Mineralogical Study,” Marine Geology, Vol. 123, No. 1-2, 1995, pp. 73-86. doi:10.1016/0025-3227(95)80005-V
- M. Frignani, L. G. Bellucci, L. Langone and H. Muntau, “Metal Fluxes to the Sediments of the Northern Venice Lagoon,” Marine Chemistry, Vol. 58, No. 3-4, 1997, pp. 275-292. doi:10.1016/S0304-4203(97)00055-8
- J. K. Cochran, M. Frignani, M. Salamanca, L. G. Bellucci and S. Guerzoni, “Lead-210 as a Tracer of Atmospheric Input of Heavy Metals in the Northern Venice Lagoon,” Marine Chemistry, Vol. 62, No. 1-2, 1998, pp. 15-29. doi:10.1016/S0304-4203(98)00017-6
- A. Sfriso, B. Pavoni and A. Marcomini, “Nutrient Distributions in the Surface Sediment of the Central Lagoon of Venice,” Science of Total Environment, Vol. 172, No. 1, 1995, pp. 21-35. doi:10.1016/0048-9697(95)04714-X
- A. Sfriso, C. Facca, S. Ceoldo, S. Silvestri and P. F. Ghetti, “Role of Macroalgal Biomass and Clam Fishing on Spatial and Temporal Changes in N and P Sedimentary Pools in the Central Part of the Venice Lagoon,” Oceanologica Acta, Vol. 26, No. 1, 2003, pp. 3-13. doi:10.1016/S0399-1784(02)00008-7
- T. Secco, F. Pellizzato, A. Sfriso and B. Pavoni, “The Changing State of Contamination in the Lagoon of Venice. Part 1: Organic Pollutants,” Chemosphere, Vol. 58, No. 3, 2005, pp. 279-290. doi:10.1016/j.chemosphere.2004.06.030
- L. G. Bellucci, M. Frignani, S. Lin and H. Muntau, “Accumulation and Metal Fluxes in the Central Venice Lagoon during the Last Century,” Chemistry and Ecology, Vol. 21, No. 6, 2005, pp. 425-439. doi:10.1080/02757540500438573
- M. Bernardello, T. Secco, F. Pellizato, M. Chinellato, A. Sfriso and B. Pavoni, “The Changing State of Contamination in the Lagoon of Venice. Part 2: Heavy Metals,” Chemosphere, Vol. 64, No. 8, 2006, pp. 1334-1345. doi:10.1016/j.chemosphere.2005.12.033
- R. Zonta, M. Botter, D. Cassin, R. Pini, M. Scattolin, L. Zaggia, “Sediment Chemical Contamination of a Shallow Water Area Close to the Industrial Zone of Porto Marghera (Venice Lagoon, Italy),” Marine Pollution Bulletin, Vol. 55, No. 10-12, 2007, pp. 529-542. doi:10.1016/j.marpolbul.2007.09.024
- B. Pavoni, R. Donazzolo, A. Marcomini, D. Degobbis and A. A. Orio, “Historical Development of the Venice Lagoon Contamination as Recorded in Radiodated Sediment Core,” Marine Pollution Bulletin, Vol. 18, No. 1, 1987, pp. 18-24. doi:10.1016/0025-326X(87)90651-5
- S. Guerzoni and S. Raccanelli, “The Sick Lagoon,” Cafoscarina Press, Venice, 2004.
- Regione del Veneto and Comune di Venezia, “Master Plan per la Bonifica dei siti inquinati di Porto Marghera. Regione del Veneto and Comune di Venezia,” Venezia, 2003, 182 p.
- MAV-CVN (Magistrato alle Acque di Venezia-Consorzio Venezia Nuova), “Programma Generale delle Attività di Approfondimento del Quadro Conoscitivo di Riferimento per gli Interventi Ambientali,” Progetto 2023, 6 Linee, 2000.
- S. E. Apitz, A. Barbanti, A. G. Bernstein, M. Bocci, E. Delaney and L. Montobbio, “The Assessment of Sediment Screening Risk in Venice Lagoon and Other Coastal Areas Using International Sediment Quality Guidelines,” Journal of Soils and Sediments, Vol. 7, No. 5, 2007, pp. 326-341. doi:10.1065/jss2007.08.246
- R. Scazzola, S. Avezzù, R. Biancotto, E. Chiamenti, E. Chiozzotto, M. Gerotto, M. Palonta and S. Roiter, “Assessment of Heavy Metal Background Values in the Soils of Inland Coastal Areas of Venice, Italy,” Annali di Chimica, Vol. 93, No. 4, 2003, pp. 465-470.
- P. Giandon, I. Vinci, S. Obber, M. Di Leginio and I. Rischia, “Development of Environmental Indicators for Italian Soils,” Fresenius Environmental Bulletin, Vol. 19, No. 8B, 2010, pp. 1741-1748.
- S. E. Apitz, S. Degetto and C. Cantaluppi, “The Use of Statistical Methods to Separate Natural Background and Anthropogenic Concentrations of Trace Elements in Radio-Chronologically Selected Surface Sediments of the Venice Lagoon,” Marine Pollution Bulletin, Vol. 58, No. 3, 2009, pp. 402-414. doi:10.1016/j.marpolbul.2008.10.007
- USEPA (Environment Protection Agency of United State of America), “Method 7471A, Mercury in Solid and Semi-Solid Waste (Manual Cold-Vapour Technique),” 1994.
- A. Brambati, L. Carbognin, T. Quaia, P. Teatini and L. Tosi, “The Lagoon of Venice: Geological Setting, Evolution and Land Subsidence,” Episodes, Vol. 26, No. 3, 2003, pp. 264-268.
- R. Zonta, C. Bettiol, F. Collarini, O. E. Fagarazzi, L. Zaggia and A. Zuliani, “DRAIN Project-Fresh Water and Pollutant Transfer from the Drainage Basin to the Venice Lagoon,” Project Report No. 15B, Venice, 2001.
- L. Bonometto, “Morphogenetic Areas: Current State,” In: S. Guerzoni and D. Tagliapietra, Eds., Atlante della Laguna, Marsilio Venezia Italy, Marsiglio, Venice, 2006, pp. 196-197.
- M. Pejrup, “The Triangular Diagram Used for Classification of Estuarine Sediments: A New Approach,” In: P. L. de Boer, A. van Gelder and S. D. Nio, Eds., TideInfluenced Sedimentary Environments and Facies, Reidel, Dordrecht, 1988, pp. 289-300. doi:10.1007/978-94-015-7762-5_21
- T. S. Chang, O. Joerdel, B. W. Flemming and A. Bartholomä, “Importance of Flocs and Aggregates in Muddy Sediment Dynamics and Seasonal Sediment Turnover in a Back-Barrier Tidal Basin of the East Frisian Wadden Sea (Southern North Sea),” Marine Geology, Vol. 235, No. 1-4, 2006, pp. 49-61. doi:10.1016/j.margeo.2006.10.004
- T. S. Chang, B. W. Flemming and A. Bartholomä, “Distinction between Sortable Silts and Aggregated Particles in Muddy Intertidal Sediments of the Southern North Sea,” In: B. W. Flemming and D. Hartmann, Eds., From Particle Size to Sediment Dynamics, Sedimentary Geology, Vol. 202, Elsevier, Amsterdam, 2007, pp. 453-463.
- I. N. McCave, B. Manighetti and S. G. Robinson, “Sortable Silt and Fine Sediment Size/Composition Slicing: Parameters for Palaeocurrent Speed and Palaeoceanography,” Paleoceanography, Vol. 10, No. 3, 1995, pp. 593- 610. doi:10.1029/94PA03039
- J. C. F. Caliani, F. R. Muñoz, E. Galán, “Clay Mineral and Heavy Metal Distributions in the Lower Estuary of Huelva and Adjacent Atlantic Shelf, SW Spain,” Science of the Total Environment, Vol. 198, No. 2, 1997, pp. 181- 200. doi:10.1016/S0048-9697(97)05450-8
- M. E. Crespo-López, A. L. Lima de Sa, A. M. Herculano, R. R. Burbano and J. L. Martins do Nascimento, “Methylmercury Genotoxicity: A Novel Effect in Human Cell Lines of the Central Nervous System,” Environment International, Vol. 33, No. 2, 2007, pp. 141-146. doi:10.1016/j.envint.2006.08.005
- M. E. Crespo-López, G. L. Macêdo, G. P. F. Arrifano, M. N. Pinheiro, J. L. M. do Nascimento and A. M. Herculano, “Genotoxicity of Mercury: Contributing for the Analysis of Amazonian Populations,” Environment International, Vol. 37, No. 1, 2011, pp. 136-141. doi:10.1016/j.envint.2010.08.009
- P. Li, X. Feng and G. Qiu, “Methylmercury Exposure and Health Effects from Rice and Fish Consumption: A Review,” International Journal of Environmental Research of Public Health, Vol. 7, No. 6, 2010, pp. 2666-2691.
- S. Guédron, L. Huguet, D. A. L. Vignati, B. Liu, F. Gimbert, B. J. D. Ferrari, R. Zonta and J. Dominik, “Tidal Cycling of Mercury and Methylmercury between Sediments and Water Column in the Venice Lagoon (Italy),” Marine Chemistry, Vol. 130-131, 2012, pp. 1-11.
- L. G. Bellucci, S. Giuliani, C. Mugnai, M. Frignani, D. Paolucci, S. Albertazzi, and A. C. R. Fernandez, “Anthropogenic Metal Delivery in Sediments of Porto Marghera and Venice Lagoon (Italy),” Soil and Sediment Contamination, Vol. 19, No. 1, 2010, pp. 42-57. doi:10.1080/15320380903390562
- S. Degetto, C. Cantaluppi, A. Cianchi, F. Valdarnini and M. Schintu, “Critical Analysis of Radiochemical Methodologies for the Assessment of Sediment Pollution and Dynamics in the Lagoon of Venice (Italy),” Environment International, Vol. 31, No. 7, 2005, pp. 1023-1030. doi:10.1016/j.envint.2005.05.012
- L. G. Bellucci, M. Frignani D. Paolucci and M. Ravanelli, “Distribution of Heavy Metals in Sediments of the Venice Lagoon: The Role of the Industrial Area,” Science of the Total Environment, Vol. 295, No. 1-3, 2002, pp. 35-49. doi:10.1016/S0048-9697(02)00040-2
- G. Muller, “Schwermetalle in den Sedimenten des Rheins: Veranderungen Seit 1971,” Umschau, Vol. 79, No. 1, 1979, pp. 778-783.
- J. Ridgway and G. Shimmield, “Estuaries as Repositories of Historical Contamination and Their Impact on Shelf Seas,” Estuarine Coastal Shelf Sciences, Vol. 55, No. 6, 2002, pp. 903-928. doi:10.1006/ecss.2002.1035
- G. M. S. Abrahim, R. J. Parker and S. L. Nichol, “Distribution and Assessment of Sediment Toxicity in Tamaki Estuary, Auckland, New Zealand,” Environmental Geology, Vol. 52, No. 7, 2007, pp. 1315-1323.
- L. Lijklema, A. A. Koelmans and R. Portielje, “Water Quality Impacts of Sediment Pollution and the Role of Early Diagenesis,” Water Science and Technology, Vol. 28, No. 8-9, 1993, pp. 1-12.
- W. Maher, G. E. Batley and I. Lawrence, “Assessing the Health of Sediment Ecosystems: Use of Chemical Measurements,” Freshwater Biology, Vol. 41, No. 2, 1999, pp. 361-372. doi:10.1046/j.1365-2427.1999.00436.x
- C. Bettiol, F. Collavini, S. Guerzoni, E. Molinaroli, P. Rossini, L. Zaggia and R. Zonta, “Atmospheric and Riverine Inputs of Metals, Nutrients and Persistent Organic Pollutants into the Lagoon of Venice,” Hydrobiologia, Vol. 550, No. 1, 2005, pp. 151-165. doi:10.1007/s10750-005-4372-2
- D. Berto, M. Giani, S. Covelli, R. Boscolo, M. Cornello, S. Macchia and M. Massironi, “Mercury in Sediments and Nassarius reticulatus (Gastropoda Proso-Branchia) in the Southern Venice Lagoon,” Science of the Total Environment, Vol. 368, No. 1, 2006, pp. 298-305. doi:10.1016/j.scitotenv.2005.09.081