Smart Grid and Renewable Energy
Vol.4 No.4(2013), Article ID:34031,12 pages DOI:10.4236/sgre.2013.44043
Comparative Study of the Moroccan Power Grid Reliability in Presence of Photovoltaic and Wind Generation
![]()
1Laboratoire de Génie Electrique et Maintenance (LGEM), Ecole Supérieure de Technologie (ESTO), Université Mohammed, Oujda, Maroc; 2Service de Physique Générale, Faculté Polytechnique, Université de Mons, Mons, Belgique.
Email: oukili2@gmail.com, zouggar@est.univ-oujda.ac.ma
Copyright © 2013 Mohamed Oukili et al. This is an open access article distributed under the Creative Commons Attribution License, which permits unrestricted use, distribution, and reproduction in any medium, provided the original work is properly cited.
Received April 3rd, 2013; revised May 3rd, 213; accepted May 10th, 2013
Keywords: Reliability; renewable energy; photovoltaic energy; wind energy; solar radiation
ABSTRACT
The photovoltaic sector in Morocco is a serious option for the future. The integration of this type of energy into the grid has a considerable effect on the adequacy of the grid. The objective of this work is to assess the reliability of the Moroccan power grid at the hierarchical level I (HLI: load coverage under the assumption of infinite node) using a non-sequential Monte Carlo simulation in which photovoltaic generation is introduced. In order to lead such a study, a model was used in order to calculate the hourly solar radiation and to determine the time evolution of the electrical power produced by photovoltaic power plants. Finally, we also compared the impact of both PV and wind generations in terms of adequacy of the Moroccan electrical supply.
1. Introduction
Morocco has an acceleration of economic and social development that has led to a significant increase of energy demand. In order to meet its growing energy needs, Morocco has defined a new strategy to secure energy supply and to optimize access, while rationalizing use and protecting the environment. To reach these goals, four major steps are planned by the Moroccan Energy Strategy: diversification of energy supply, development of domestic energy resources, especially renewables, exploiting the potential of energy efficiency in key sectors of the economy and, finally, the integration of renewable energies in the electricity markets. Renewable energy is thus a major component of the new energy strategy of the kingdom. Indeed, Morocco has great potential in renewable energy whose exploitation will cover a substantial part of its growing needs and help to protect the environment by replacing fossil fuels. In 2020, the expected installed capacity in renewable energy will represent 42% of the installed base. Among those 42%, 14% will particularly come from photovoltaic generation. This kind of fluctuating energy has a major effect on the operation and power quality of the electrical system due to its dependence towards the day/night alternation (no electrical generation during nights) and due to the highly fluctuating behavior of such a kind of generation (highly sensitive to passing clouds, ···).
This paper is organized as follows. Firstly, a model is used to estimate the hourly solar irradiance. This estimation is based jointly on the geographical coordinates of the site of Ouarzazate and the use of JAVA SOLARCALC MODEL. Thanks to the estimation of the solar radiation, the photovoltaic electric power can be calculated via the temperature of the cell. Subsequently, in order to quantify the impact of the previously calculated photovoltaic generation on the system ability to cover the load, a nonsequential Monte Carlo simulation is presented and developed on MATLAB. Then, thanks to the implemented tool, it is possible to closely analyze, from the load coverage point of view, the impact of an increased penetration of photovoltaic generation in the Moroccan power grid. Finally, we make a comparative study with the impact of a massive introduction of wind generation on the electrical system reliability.
2. Determination of the Photovoltaic Electrical Power
2.1. Estimation of the Solar Radiation
The calculation of the PV power is based on the knowledge of the solar radiation. In order to estimate the latter, there are number of methods including the approach Kurt and Spokas [1]. They estimate the solar radiation on the basis of a previous method set by Campbell and Norman [1]. Practically, the total solar irradiance can be separated into two basic components: the direct solar radiation (GBh) and the spread solar radiation (GDh). The addition of these two contributions in the total incident solar radiation (GB) is represented by:
 (1)
(1)
The local intensity of a solar ray beam is determined by the angle between the direction of the sunlight ray and the surface of the earth. The position of the sun is given by the angle between the location of the sun and the normal to the surface, referred to as the zenith angle (Ψ).
 (2)
(2)
where ϕ is the latitude of the considered area (Radians), t is the time (Standard time), tsn is the solar midday time and δsd is the declination solar angle defined as follows:
 (3)
(3)
where J is the calendar day with J = 1 for 1 January and J = 365 for 31 December (Or 366 in the bissextile years).
In order to calculate the direct solar light, the following equation is used [1]:
 (4)
(4)
GPh is the solar radiation received on a surface that is perpendicular to the incoming rays. The model chosen for GPh is deducted from Liu and Jordan (1960) [2], where radiation beam (G Ph) is given by:
 (5)
(5)
GOh is the solar constant (1360 W/m2), τ is the atmospheric transmittance, and m is the optical mass air. The latter is given by the following relationship [1]:
 (6)
(6)
Pa is the atmospheric pressure on the site and ψ the zenith angle. The average barometric pressure was estimated from the following relationship [1]:
 (7)
(7)
a is the elevation of the site (in meters).
However, only a portion of the solar radiation beam directly reaches the soil surface. The other part is reflected or absorbed by atmospheric gases, clouds, and dust particles. Some of these radiations are then re-dispersed towards the earth and are designated as the scattered radiation (GDh). Campbell and Norman [2] established an empirical relationship on basis of the Liu and Jordan work [3] to calculate spread radiation. This relationship is given by:
 (8)
(8)
Figure 1 shows the evolution of hourly solar radiation in W/m2 estimated for the site of Ouarzazate, by applying the model described above.
2.2. Determination of the Temperature of the Photovoltaic Cell
The cell temperature is calculated using most frequently the concept of NOCT (Normal Operating Cell Temperature) (Nolay, 1987) [4] given by the producers of photovoltaic modules and defined by the following equation:
 (9)
(9)
The NOCT is defined under the following conditions: wind speed v = 1 m/s, ambient temperature T = 20˚C and solar irradiance GB = 800 W/m2 (ASTM, 1998, Myers et al., 2002) [5]. Ta is the air temperature (˚C).
In order to determine the evolution of the hourly air temperature Ta, it is modeled by a uniform distribution between the minimum (Tmin) and maximum (Tmax) measured temperatures for each month given in Table 1. Figures 2 and 3 respectively represent the time evolution of the air temperature and the temperature of the cells for the site of Ouarzazate.
2.3. Calculation of the Generated PV Electrical Power
It is obvious that the operation and performance of the PV generator is based on the extraction of the maximum power output of the PV system. The models describing the behavior of PV modules maximum output power is more practical to evaluate the PV system. In this section, we present two approaches frequently used by many research and compare them to determine the best adopted to extract the maximum PV power.
2.3.1. First Approaches
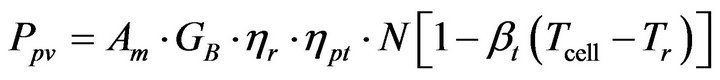
In this approach, the estimate of the photovoltaic power generated is performed using the global solar radiation, the ambient temperature and the manufacturer’s data for the PV modules as model input, the power output of the PV array, Ppv, can be calculated using the following
 (a)
(a)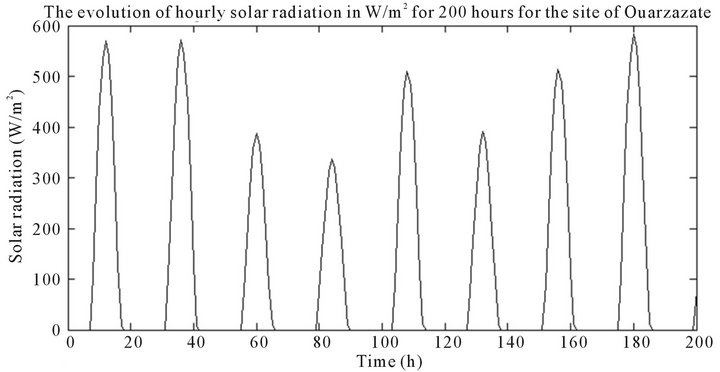 (b)
(b)
Figure 1. the evolution of hourly solar radiation in W/m2 for the site of Ouarzazate. (a) For 8760 hours; (b) For 200 hours.
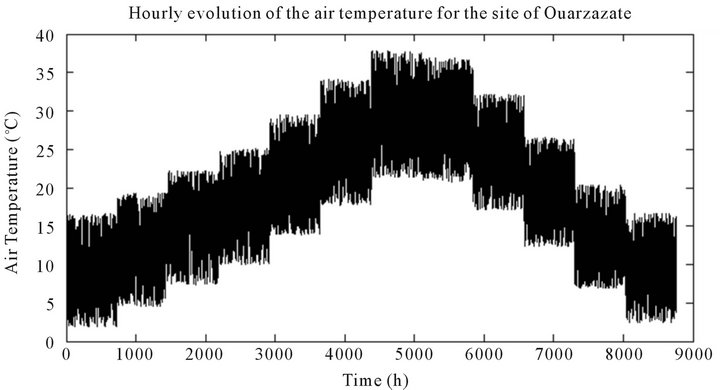
Figure 2. Hourly evolution of the air temperature for the site of Ouarzazate.
equations (Markvard, 2000) [6,7]:
 (10)
(10)
With ηg the instantaneous PV generator efficiency, N is the number of solar modules, Am is is the area of a single module used in a system (m2) and GB is the global solar radiation.
ηg is given by the following relationship:

Figure 3. hourly evolution of the temperature of the cells for the site of Ouarzazate.
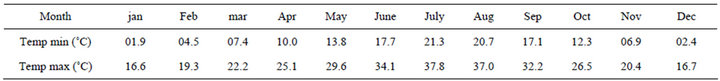
Table 1. Monthly minimum (Tmin) and maximum (Tmax) temperatures for the site of Ouarzazate.
 (11)
(11)
where ηr is the PV generator reference efficiency, ηpt is the efficiency of power tracking equipment which is equal to 1 if a perfect maximum power point tracker is used, βt is the temperature coefficient of efficiency, ranging from 0.004 to 0.006 per ˚C for silicon cells and Tr is the PV cell reference temperature. The cell temperature Tcell is given by equation (9).
Therefore the maximal photovoltaic power produced by the PV module is given by the following equation (12):
 (12)
(12)
2.3.2. Second Approach
In this case, the electrical power produced by photovoltaic modules is determined by using the equations of voltage and current at maximum power point (Vmp and Imp) by use of the following equation:
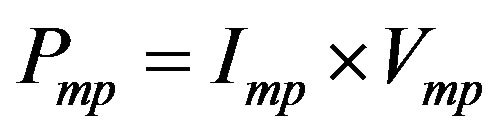 (13)
(13)
This model calculates the reference current and voltage and uses equation (13). It was developed by Borowy and Slameh (1994, 1996) [8,9]. For the current, the following equation is used:
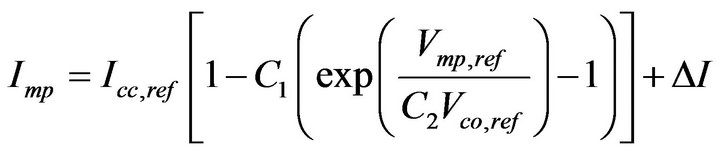 (14)
(14)
With Icc,ref the short circuit current rating of the module, Vmp,ref the rated voltage at nominal power and Vco,ref the rated voltage in open circuit operation. The constants C1 and C2 are respectively calculated by the following equations:
 (15)
(15)
 (16)
(16)
With Imp, ref, the rated current at nominal power.
ΔI is the current variation. It is given by the following equation:
 (17)
(17)
with GB, the solar radiation, α0 the coefficient of temperature of the current of the module. The temperature variation ∆T is calculated by the following equation:
 (18)
(18)
With, GB,ref = 1000 W/m2 and Tcell,ref = 25˚C, respectively, the solar irradiance and cell temperature in normal conditions.
The voltage at maximum power is calculated by the following equation:
 (19)
(19)
where Vmp,ref is the nominal voltage at nominal power. β0 is the temperature coefficient of the voltage of the module.
2.3.3. Comparative Study of the Two Approaches
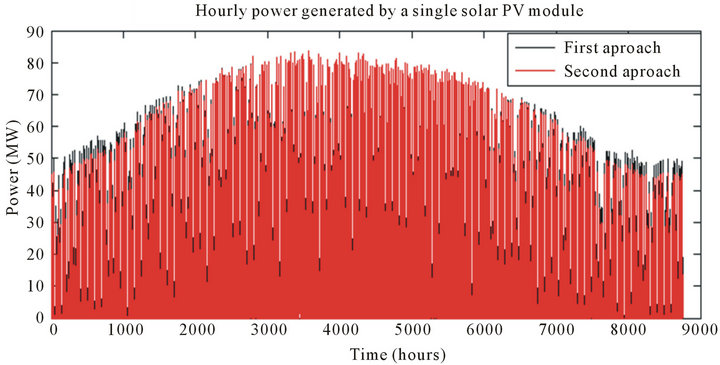
The aim of this section is to compare the maximum hourly power produced by the PV module using the two approaches to choose the best model adopted in our reliability study. In this context, using equations (12)-(14) and (19), the power produced by a single photovoltaic module is given in Figure 4 using the two approaches; figures 4(a) and (b) represent respectively the hourly evolution of the maximum power produced by a single module for typical year and for the first 200 hours of the year.
The photovoltaic module used in our study is BP585F. The properties of this module are given in the table 2.

Table 2. Properties of the module BP585F.
 (a)
(a)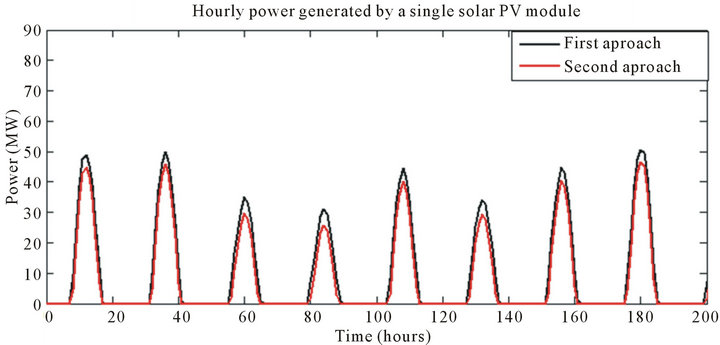 (b)
(b)
Figure 4. hourly power generated by a single solar PV module. (a) For 8760 hours; (b) For 200 hours.
The evolution of the total PV power produced by a photovoltaic park whose installed capacity reaches 250 MW is given in Figure 5.
According to Figures 4 and 5, we see clearly that the maximum hourly power generated by the PV generators using the first approach is always higher than that obtained by the second approach; these results are consistent with those obtained in reference [10]. Also from Table 3, we see that the annual energy produced using the first approach is superior to that obtained by the second approach.
Therefore, the first approach is adopted to extract the maximum PV power.
3. Non-Sequential Monte Carlo Simulation
In order to estimate the reliability indices [11] relative to the Moroccan electrical grid, a non-sequential Monte Carlo simulation has been implemented. This simulation models the “life of the grid” as a set of events that change the system state. Note that each generated system state is considered on an hourly basis in our simulation. Moreoverdepending on the studied hierarchical level, the events recognized by the algorithm are load changes, possible failures or maintenance of production units (hierarchical level HL1) but also any overloads or unavailability of lines (weather, falling branches, ···) in the case of the hierarchical level HL2 (HL2: Generation + Transmission). Note that, in this paper, the reliability evaluation will be limited to the hierarchical level HL-I.
Within the context of our study, each classical generation unit (thermal, gas turbine, ···) can be characterized by two distinct states: fully available and unavailable. During the Monte Carlo simulation, a uniformly distributed (in the interval [0, 1]) number μ is then sampled for each generation unit in order to determine its operational state by use of the following procedure [12]:

Table 3. Annual energy simulated using both approaches.
 (a)
(a)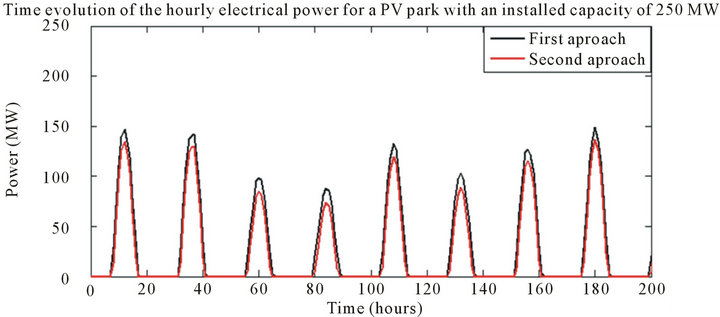 (b)
(b)
Figure 5. time evolution of the hourly electrical power for a PV park with an installed capacity of 250 MW. (a) Pour 8760 heures; (b) Pour 200 heures.
• If μ ≤ FOR (Forced Outage Rate: rate of unplanned downtime associated with a conventional generation unit), the unit is assumed to be unavailable.
• If μ > FOR, the generation unit is fully available.
• Therefore, for each system state, the total generated power is equal to the addition of the contributions of each conventional unit (taking into account the availability status of the latter) which are then added to hourly wind power and/or photovoltaic generation.
4. Reliability Indices: Well-Being Analysis of the Electrical System
The electrical system reliability indices are calculated by comparing, during each generated state, the global generated electrical power with the load consumption. The indices considered in our study are called indices of “wellbeing” of the electrical system. These indices were introduced in 1999 by Roy Billinton [13-15] and expressed in terms of healthy, marginal and risky states by use of the following definitions:
• Healthy state: The global available power, even if the biggest generation unit is stopped, can cover the required load within adequate operating conditions of the electrical grid.
• Marginal state: The global available power is greater than the corresponding hourly load and permits to cover the latter within adequate operating conditions. However, if the biggest generation unit is stopped, the available power becomes lower than the needed load.
• Risky state: The available global power is directly below the needed consumption and does consequently not permit to adequately cover the latter.
During the electrical system “well-being” analysis, reliability indices are defined as follows:
Healthy state probability = 
Marginal state probability = 
Risky state probability = 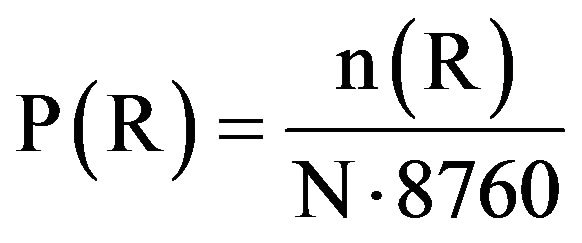
 where n(H), n(M) and n(R) are respectively the number of healthy, marginal and risky states simulated during the Monte Carlo algorithm and N is the total number of simulated years.
5. The Moroccan Generating Facilities and Evolution of the Load
5.1. The Moroccan Generating Facilities
In this study, we consider the conventional generation park that was in use in Morocco at the end of 2008. The total installed capacity reached 5178 MW (without consideration of the electrical power from wind) divided in 1265 MW of hydraulic type, 2786.2 MW of thermal, 662.8 MW of gas turbine type and 464 MW STEP type [16]. Table 4 shows the different plants that were composing the production park while table 5 establishes the FOR associated with each type of conventional generation [12].

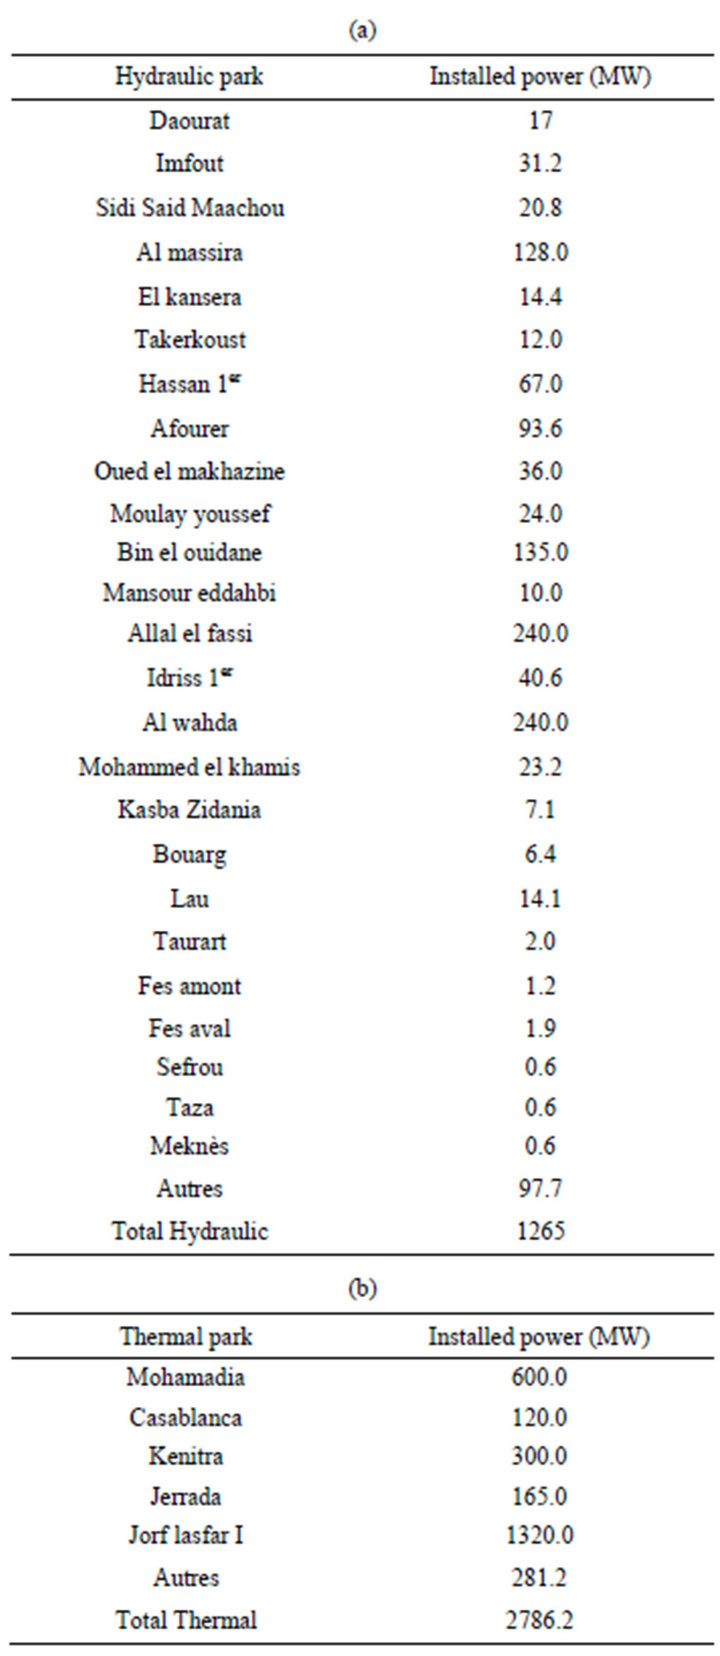
Table 4. The classical generating units considered in the Monte Carlo simulation. (a) hydraulic park; (b) thermal park; (c) Gas turbine park; (d) STEP park.
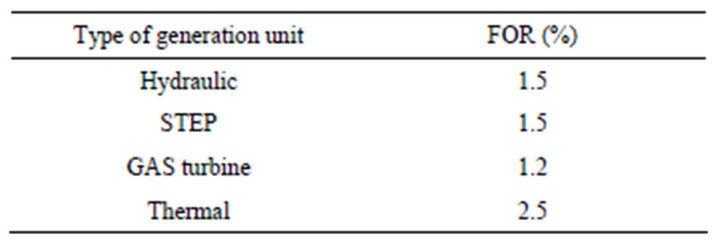
Table 5. FOR parameter for each type of conventional generation [10].
5.2. Load Evolution
Figure 6 illustrates the time evolution of the simulated power consumption. It was modeled via a uniformly distributed random variable (linear approximation of the monotonic load) taken between the annual peak load and the base consumption [17]. Table 6 shows the peak load and base consumption in Morocco in 2009.
6. Impact of the Photovoltaic Generation on the of Electrical System Reliability
The first part of this study aims to get the effect of photovoltaic generation on the reliability of the Moroccan power grid. In order to conduct such an evaluation, we launched a non-sequential Monte Carlo simulation (with integration of photovoltaic generation using the first approach) to the classical generation park depicted in Table 3. The simulation results are provided in Table 7.
Firstly, we note from the results of Table 7 that, when adding photovoltaic generation (4%) in the electrical system (with consumption unchanged), the probability of finding the system in a risky state decreases (P(R) = 0.0071 without photovoltaic generation and P(R) = 0.0064 with photovoltaic generation), demonstrating the interest of adding solar power as an energy source complementary to the conventional generation already installed (Figure 7).
Secondly, we also see from the results of Table 7 that, when massively replacing conventional generation by photovoltaic generation (the same installed capacity of 5428 MW is maintained; we have simply replaced 20 % of the conventional generation by photovoltaic generation), the risk of not covering the load increases from P(R) = 0.0071 (without PV) to P(R) = 0.0348 (with 20% of conventional generation replaced by PV). This observation is easily explained by the fact that the overall generation of the system becomes more fluctuating and
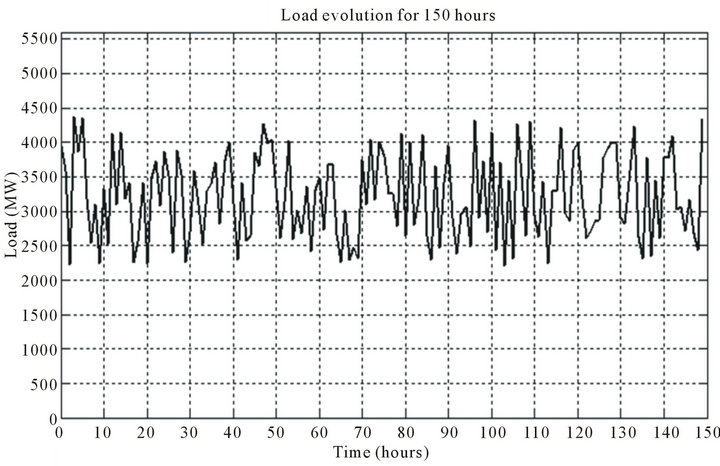
Figure 6. Time evolution of the simulated load for 150 hours.
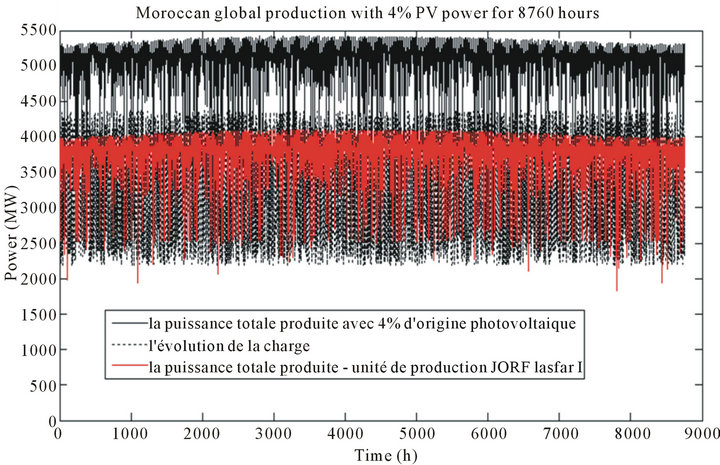
Figure 7. Simulated yearly evolution of electricity generation in Morocco with the addition of 4% of photovoltaic generation.

Table 6. Parameters of the Moroccan load for 2009.
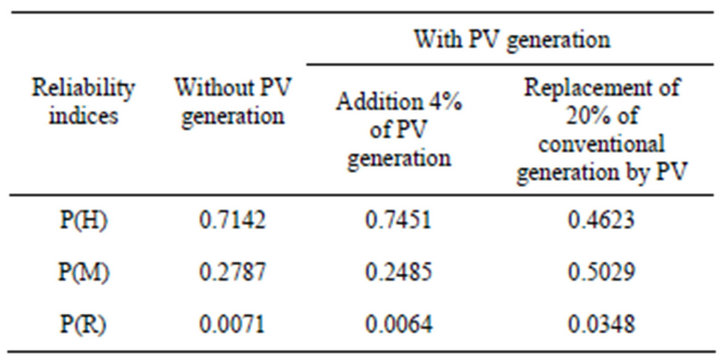
Table 7. Results of the Monte Carlo simulation implemented with and without photovoltaic energy for the electric load of 2009.
logically increases the number of simulated risky states as clearly shown in Figure 8.
The second part of our study is to compare the reliability of Moroccan power grid in the presence of photovoltaic generation with the one of the same network in the presence of wind generation (Figure 9) [18]. In order to realize such a comparison, we kept the same added capacity (250.4 MW) of renewable generation and we just replaced the power from wind by the original PV. Table 8 shows the effect of the introduction of these two types of energy on the ability of the system to cover the load.
Based on the results of Table 8, we can firstly note that the risk of not covering the load in the case of introducing PV is greater than the one encountered in the case of the introduction of wind generation (P(R) = 0.0064 with PV

Table 8. Results of the implemented Monte Carlo simulation in the presence of photovoltaic and wind generation for the electrical load of 2009.
introduction, P(R) = 0.0061 with introduction of wind generation). This remark can be explained by an absence of sunlight during nights (involving no photovoltaic generation during the night). In presence of PV generation, this result can thus lead to the increase of risky states during this period of time even if it is normally an off-peak period (Figures 10 and 11).
Secondly, in terms of energy, we see from Table 8 that, for the same installed capacity, the annual electrical energy produced by wind farms is greater (almost twice) than the one produced by the photovoltaic parks (991.25 GWh/year with the addition of 4% wind generation against 506.87 GWh/year with the addition of 4% photovoltaic generation). In that way, Figure 12 shows the simulated evolutions of wind and PV generations. It can clearly be observed that the hourly PV power is quasi always lower than the wind generation, involving thus a

Figure 8. Simulated yearly evolution of electricity generation in Morocco with 20% replacement of conventional generation by photovoltaic generation.

Figure 9. Simulated yearly evolution of electricity generation in Morocco with 4% addition of wind power.
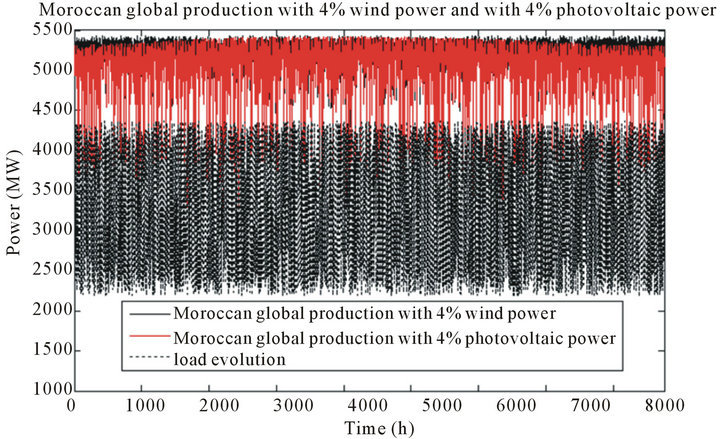
Figure 10. Simulated yearly evolution of electricity generation in Morocco with: - Black (continuous): 4% addition of wind energy; - Red: 4% addition of PV.
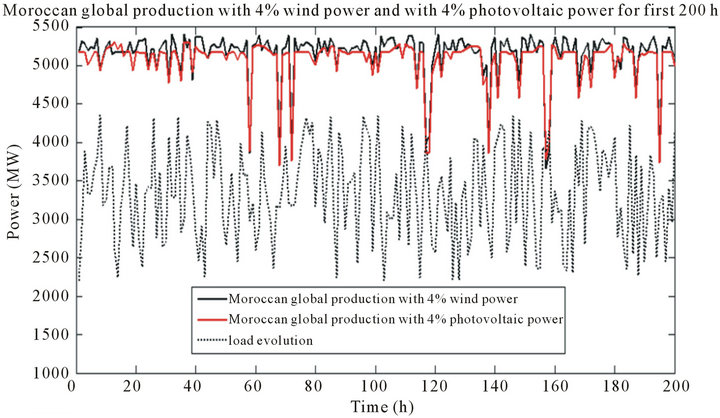
Figure 11. Simulated evolution of the electricity generation in Morocco for the first 200 hours of the year: - Black: 4% addition of wind energy; - Red: 4% addition of PV.

Figure 12. Simulated wind and photovoltaic power for 200 hours.
lower annual energy coming from PV when the integration is made over one year.
7. Conclusion
In this paper, we demonstrate the impact of photovoltaic generation on the reliability of the Moroccan power grid using a non-sequential Monte Carlo simulation and we compared it with the impact of wind power. The first simulation results show that adding photovoltaic generation (without changing the conventional park or consumption specifications) reduces the risk of not covering the load. However, if PV is used to replace conventional generation, we also observed that the risk of load non-recovery tended to increase, demonstrating that PV generation cannot alone replace conventional generation in Morocco. Instead, it should rather be viewed as a booster to enhance the power system in Morocco. Finally, we have deduced that, for the same installed capacity, the probability of not covering the load when introducing PV is higher than the one calculated in the case of introducing wind generation. We also showed that, for the same installed capacity, the annual generated wind energy is greater than the one simulated in the case of photovoltaic generation. From all these results, we conclude that wind and solar power are thus renewable energy sources to be used in order to save fossil fuel and increase the total energy generation in Morocco (thermal, hydro, ···). Moreover, we also show that, to safely meet the future requirements in electricity consumption, the solution has to come from an energetic mix based on the use of conventional and renewable energy resources.
REFERENCES
- K. Spokas, F. Forcella, “Estimating Hourly Incoming Solar Radiation from Limited Meteorological Data,” Weed Science, Vol. 54, No. 1, 2006, pp. 182-189. doi:10.1614/WS-05-098R.1
- G. S. Campbell and J. M. Norman, “Introduction to Environmental Biophysics,” 2nd Edition, Springer-Verlag, New York, 1998, pp. 167-183. doi:10.1007/978-1-4612-1626-1_11
- B. Y. Liu and R. C. Jordan, “The Interrelationship and Characteristic Distribution of Direct, Diffuse, and Total Solar Radiation,” Solar Energy, Vol. 4, No. 1, 1960, pp. 1-19. doi:10.1016/0038-092X(60)90062-1
- P. Nolay, “Developpement d’une Methode Generale d’analyse des Systemes Photovoltaiques,” M.S. Thesis, Ecole des Mines, Sophia-Antipolis, 1987.
- D. R. Myers, K. Emery and C. Gueymard, “Revising and Validating Spectral Irradiance Reference Standards for Photovoltaic Performance,” Journal of Solar Energy Engineering, 126, 2004, pp. 567-574.
- S. Diaf, D. Diaf, M. Belhamel, M. Haddadi and A. Louche, “A Methodology for Optimal Sizing of Autonomous Hybrid PV/Wind System,” Energy Policy, Vol. 35, No. 11, 2007, pp. 5708-5718. doi:10.1016/j.enpol.2007.06.020
- T. Markvard, “Solar Electricity,” 2nd Edition, Willey, Hoboken, 2000.
- B. S. Borowy and Z. M. Salameh, “Optimum Photovoltaic Array Size for a Hybrid Wind/PV System,” IEEE Transactions on Energy Conversion, Vol. 9, No. 3, 1994, pp. 482-488. doi:10.1109/60.326466
- B. S. Borowy and Z. M. Salameh, “Methodology for Optimally Sizing the Combination of a Battery Bank and PV Array in a Wind/PV Hybrid System,” IEEE Transactions on Energy Conversion, Vol. 11, No. 2, 1996, pp. 367-375. doi:10.1109/60.507648
- M. Belhadj, T. Benouaz, A. Cheknane and S. M. A Bekkouche, “Estimation de la Puissance Maximale Produite par un Générateur Photovoltaïque,” Revue des Energies Renouvelables, Vol. 13, No. 2, 2010, pp. 257-266.
- J. Batut, “Fiabilité du Réseau Electrique,” Année Persée, Cahier/Groupe Réseaux, Vol. 3, No. 9, 1987, pp. 33-42.
- F. Vallée, J. Lobry and O. Deblecker, “Impact of the Wind Geographical Correlation Level for Reliability Studies,” IEEE Transactions on Power Systems, Vol. 22, No. 4, 2007, pp. 2232-2239.
- R. Billinton and R. Karki, “Application of Monte Carlo Simulation to Generating System Well-being Analysis,” IEEE Transactions on Power Systems, Vol. 14, No. 3, 1999, pp. 1172-1177. doi:10.1109/59.780954
- R. Billinton and A. Sankarakrishnan, “Adequacy Assessment of Composite Power Systems with HVDC Links Using Monte Carlo Simulation,” IEEE Transactions on Power Systems, Vol. 9, No. 3, 1994, pp. 1626-1633. doi:10.1109/59.336095
- A. Abdulwhab and R. Billinton “Generating System Wellbeing Index Evaluation,” Electrical Power and Energy Systems, Vol. 26, No. 3, 2004, pp. 221-229. doi:10.1016/j.ijepes.2003.10.013
- Documentation ONE. www.one.org.ma
- B. Raison, M. Crappe and J. Trécat, “Effets de la Production Décentralisée dans les Réseaux Electriques,” Projet Connaissances des Emissions de CO2, Sous Projet 5, Faculté Polytechnique de Mons, 2001.
- M. Oukili, S. Zouggar, F. Vallée, M. Seddik and T. Ouchbel “Impact of Wind Power Integration and Load Evolution on the Moroccan Electrical Grid Reliability,” IJEET, Vol. 6, No. 1, 2010, pp. 25-31.