Smart Grid and Renewable Energy
Vol. 4 No. 3 (2013) , Article ID: 33410 , 10 pages DOI:10.4236/sgre.2013.43035
DHW Design Flow Rates and Consumption Profiles in Educational, Office Buildings and Shopping Centres
![]()
1Department of Environmental Engineering, Tallinn University of Technology, Tallinn, Estonia; 2EL Consult Lt.
Email: teet.koiv@ttu.ee
Copyright © 2013 Teet-Andrus Koiv et al. This is an open access article distributed under the Creative Commons Attribution License, which permits unrestricted use, distribution, and reproduction in any medium, provided the original work is properly cited.
Received January 21st, 2013; revised February 23rd, 2013; accepted March 3rd, 2013
Keywords: DHW; DHW Design Flow Rate; Schools, Kindergartens; Office Buildings; Shopping Centres; Consumption Profiles
ABSTRACT
The paper gives a thorough survey of the studies of different authors in the field of domestic hot water (DHW) consumption and consumption profiles. It presents an overview of the research done into DHW by the Tallinn University of Technology. Working out on the basis of investigations has been new empirical formulas for determining design flow rates for schools, kindergartens, office buildings and shopping centres. DHW consumption profiles of typical buildings are presented. Comparisons are given on the determination of DHW design flow rates by the standard EVS 835, the EN 806-3 and the recommended formulas. The latter makes it possible to considerably decrease the design flow rates which in turn enables to deminish the load of the equipment, to improve the quality of control and to decrease the diameters of the pipes of the district heating network and the losses of heat in them.
1. Introduction
In Eastern European countries, instantaneous DHW heat exchangers are widely used for water heating. In these systems, the correct designing of DHW equipment for DHW heating is very important. It is important for the temperature of DHW as well because of the cost of energy. It should be noted that in the case of DHW heating with instantaneous water heaters the risk of Legionella disease is much lower than with tank water heaters.
Extensive research into domestic hot water (DHW) consumption was done in the former Soviet Union in the 60s and the 70s of the past century and even earlier. The results of the research have been presented by Hludov [1] and Brodski [2]. DHW consumption and the consumption profiles in the 60s and the 70s of the past century are presented in articles Borodkin et al. [3], Brodski [4], Kõiv [5]. The articles showed that the DHW consumption was close to the standard figures given in the designing code.
Later DHW consumption and the consumption profiles have been treated of in many countries.
In Asia mention can be made of a year-round study of DHW consumption in Hong-Kong’s quality hotels, and investigations of DHW consumption and the load consumed for heating water by Deng et al. [6]. An article by Cheng deals with studies of DHW consumption in Taiwan’s residential buildings and with energy saving possibilities in water heating [7].
An interesting study of the impact of socio-demographic factors and efficient devices on water consumption has been done by Willis et al. in Australia [8,9].
An article by Carrington, Warrington and Yak treats of DHW consumption in New Zealand’s households [10].
In Africa investigations of DHW consumption have been carried out in the Republic of South Africa, in Senegal and in Egypt. In Johannesburg a year-round study of DHW consumption was carried out in which the researchers Meyer and Tshimanhinda have displayed the hourly consumptions [11]. Problems of DHW consumption are also dealt with in Rankin’s and Roussau’s article [12], in South Africa. In the articles, Meyer gives a survey of DHW consumption in South Africa also [13,14]. Calmeyer and Delport have dealt with the subject of DHW consumption, including variations in consumption, in a students’ hostel of Pretoria University [15].
In Senegal the influence of DHW parameters on the energy consumption in public buildings and plants are presented by Ndoye and Sarr [16].
In Egypt problems of heating DHW and saving energy have been investigated by Hegazy et al. [17].
In Brazil an investigation has been carried out by Prado and Gonçalves that deals with energy consumption for heating water in residential buildings [18].
In Hungary, Nemethi and Szantho have studied DHW consumption and the consumption profiles in more than 60 residential buildings [19,20].
In Poland heat consumption for DHW heating and consumption irregularity in hospitals have been investigated by Bujak and with decentralized DHW system in apartment buildings by Cholewa and Siuta-Olcha [21, 22].
Hot water temperature, power consumption and the Legionella issue have been studied by Bøhm and Danig in Denmark [23].
Estimated heat energy requirements for domestic hot water production in a 2-stage district heating substation have been analyzed by Yliniemi et al. in Sweden [24].
One of the few doctoral theses has been written by Savičkas in Lithuania [25]. The thesis comprises the DHW systems of apartment and public buildings, their functioning, the DHW consumption, variations in the consumption and the DHW temperature.
The year 1998 saw a thorough investigation of DHW consumption in English residential buildings [26]. Its main aim was to gather data on DHW consumption in residential buildings and of the habits of their inhabitants. Investigated in the years 1991-1995 were more than 10,000 residential buildings. A restudy comprising 2600 residential buildings was carried out in 1998.
The aim of the study was to find out how DHW consumption varies from household to household and if there are any concrete types of households the DHW consumption of which is bigger than the average one. The study showed that the average DHW consumption by washing machines was 4 l/per person per day, by showers and hip baths 35 l/per person per day, and an additional 10 l/per person per day for hygiene and dishwashing in a sink. All in all DHW consumption was 49 l/per person per day. Concerning the different types of households the results of the study showed that in households with younger inhabitants more DHW is used than in those with elderly inhabitants (Figure 1).
The largest numbers of investigations in the field of DHW consumption have been made in the US. In 1995 ASHRAE issued new instructions for designing DHW systems in apartment buildings [27], its aim being the prevention of over dimensioning the systems. In reality the current DHW heating devices proved to be 30% - 200% over dimensioned practically all over America, because very big reserve coefficients were used. The
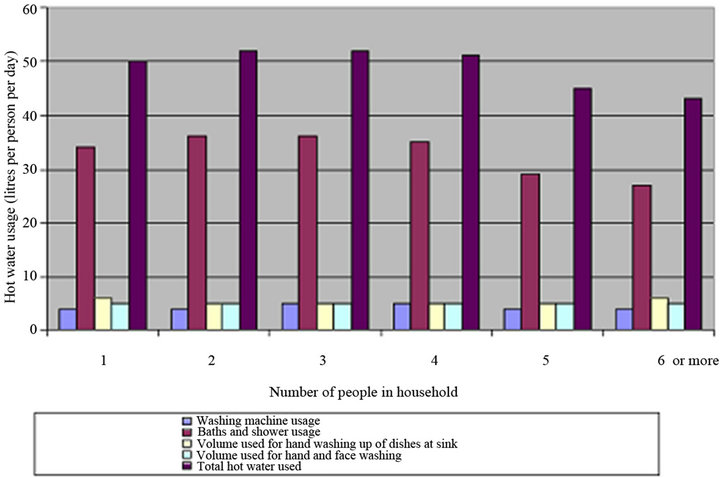
Figure 1. Average DHW consumption depending on the number of inhabitants in the households.
research of Fairey and Parker [28] gives a survey of the DHW systems used in United States. The investigation shows that depending on the consumption rate and the peculiarities of the DHW heating devices in single-family residences the consumption of energy necessary for heating water decreases 10% - 35% if the water is heated by DHW instantaneous heat exchangers and not by tank heat exchangers. Vine, Diamond and Szydlowski investtigated DHW consumption in four low-income apartment buildings [29]. A study by Hendron and Burch [30] gives a survey of DHW consumption and the consumption profiles in households.
A number of investigations in the field of DHW have been carried out in Canada. An article by Aquilar, White and Ryan [31] points out that the share of DHW heating makes up 22% of the energy consumption in Canadian households.
Several countries have drawn a lot of attention to the possible development of the pathogenic microorganism Legionella in DHW systems [32-35]. The problem may turn out to be especially sharp in case the respective microorganisms exist in the initial water and the temperature of the water, for example, in the water heating devices remains on a relatively low level 25˚C - 45˚C.
In Estonia, in Tallinn University of Technology (TUT) investigations concerning DHW consumption and the consumption variability have been made by Koiv, Toode and Lahe [36-41].
An extensive DHW consumption investigation was carried out in Estonian apartment buildings in the years 1999 - 2011 (in 98 apartment buildings).
The extent of hot water consumption in different apartment buildings in the years 1999-2004 is presented in Figure 2. As the results show, the average hot water consumption—60 liters per day per person in 1999—has decreased up to 44 liters per day per person in 2004.
It can be seen that an increase in the percentage of water meters in apartments is accompanied by a considerable fall in water consumption. A decrease in water consumption has likewise been influenced by a rise in the price of both water and heat in recent years. A certain
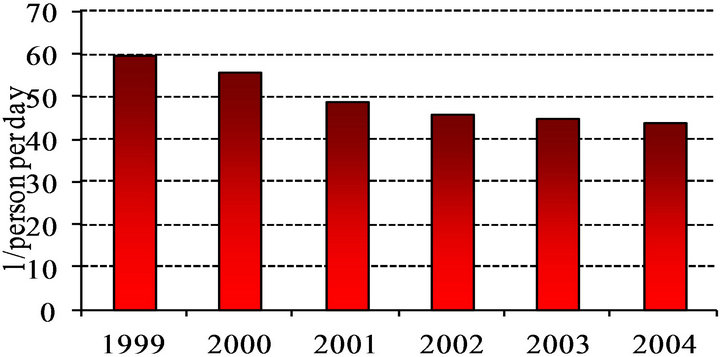
Figure 2. Dynamics of average hot water consumption in the buildings analyzed.
role in the decrease of water consumption has been played by renovation of DHW systems. Of prime importance in it have been the renovation of DHW circulation and also the use of water, water saving equipment (lever mixers, showers).
In the diagram presented in Figure 3 of special interest is the comparison of weekly average DHW consumption within 30 years. The results are presented in l/m2 per day.
Comparing the average DHW consumption per 1 m2 of heated area today and in the 70s, we can see that it has decreased 3.3 times. This fact also accounts for the relatively insignificant increase in variation in analogous residential buildings investigated.
Figure 4 shows DHW consumption l/m2 per day in years 2005-2010 in Estonia.
The DHW maximum consumption was investigated in 23 residential buildings of 18-, 30-, 35-, 40-, 60-, 80-, 90-, 120-, 165-apartment. For DHW maximum consumption measuring impulse water meters with data loggers were used. Maximum DHW flow rates (maximum values for the groups) in the apartment buildings investigated are presented in Table 1.
Below is presented a formula for determining the heating load of DHW instantaneous heat exchangers if the temperature difference of hot and cold water is 50˚C.
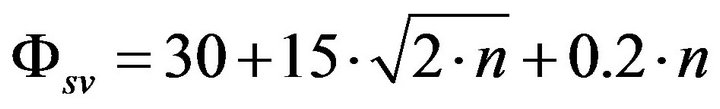 (1)
(1)

Figure 3. Average DHW consumption per weekdays and per week in the years 1974-2004.
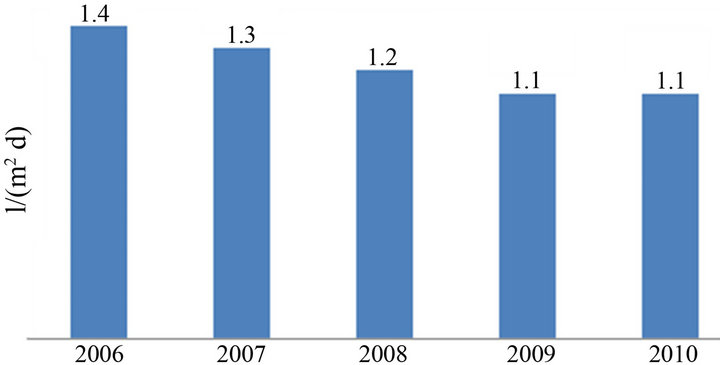
Figure 4. DHW consumption l/m2 per day in years 2005- 2010 in Estonia.

Table 1. Maximum DHW flow rates (maximum values for the groups) in the apartment buildings investigated.
where n is the number of apartments.
Figure 5 presents the loads of DHW instantaneous heat exchangers determined for apartment buildings by the proposed Formula (1), by the Estonian standard [42] EVS(D1) and by EN standard [43] against the background of the maximum values of the results of measuring.
Figure 5 shows that in larger apartment buildings the heating loads of the heat exchangers differ up to two times comparison of EVS standard and up to 2.7 times comparison of EN standard.
The analysis shows that in the conditions of the changed DHW consumption today the calculation methods valid untill now are not suitable and cause considerable overdimensioning of the equipment and the pipes and disorders in the functioning of the DHW control units.
2. Method
Investigation of the DHW maximum consumption has been carried out in 20 educational buildings, in 16 kindergartens and in 16 office buildings in Tallinn.
For studying the DHW maximum consumption impulse water meters were used. For recording the data they were connected with data loggers. Data processing was made by software PDL-Win. The DHW consumption in the building with a precision of 1 l was recorded during a week.
The hourly variability in DHW consumption is indicated with the ratio of the given hourly consumption to average hourly consumption of a week kh, which is calculated by the correlation:
 (2)
(2)
where  is the given hourly consumption;

Figure 5. DHW design heating load depending on the number of apartments by the EVS (D1) standard, the EN standard and the proposed formula together with the points calculated on the basis of the results of measuring.
 is the average hourly DHW consumption of the week.
For example, DHW consumption and variability of consumption are studied in Greece and Japan [44,45].
3. DHW Maximum Consumption and Recommendations for Determining the Design Flow Rates for Schools, Kindergartens, Office Buildings and Shopping Centres
In Estonia, it was customary to determine DHW design flow rates for schools, kindergartens and office buildings proceeding from the sum of the standard flow rates (EVS method). It must be pointed out, however, that in a number of types of buildings (e.g. schools and office buildings) the use of a large number of DHW devices (first of all mixers) is very small, practically nonexistent. Such a situation leads to a considerable overdimensioning of DHW heating devices and to unsatisfactory control of DHW temperature.
3.1. Schools
The design flow rates recorded in schools and those determined by the standard EVS 825:2003 [42], European standard EN 806-3 [43] and design flow rates calculation by Formula (3) are presented in Table 2.
A new empirical formula is recommended for determining the design flow rates (3) on the basis of which the water heating devices are selected for schools and highschools without swimming pools
 (3)
(3)
where q is design flow rate l/s; N1 is the number of showers, N2 is the number of students, N3 is number of water outlet devises.
In Table 2 it can be seen that the design flow rates determined by calculation Formula (3) are approximately up
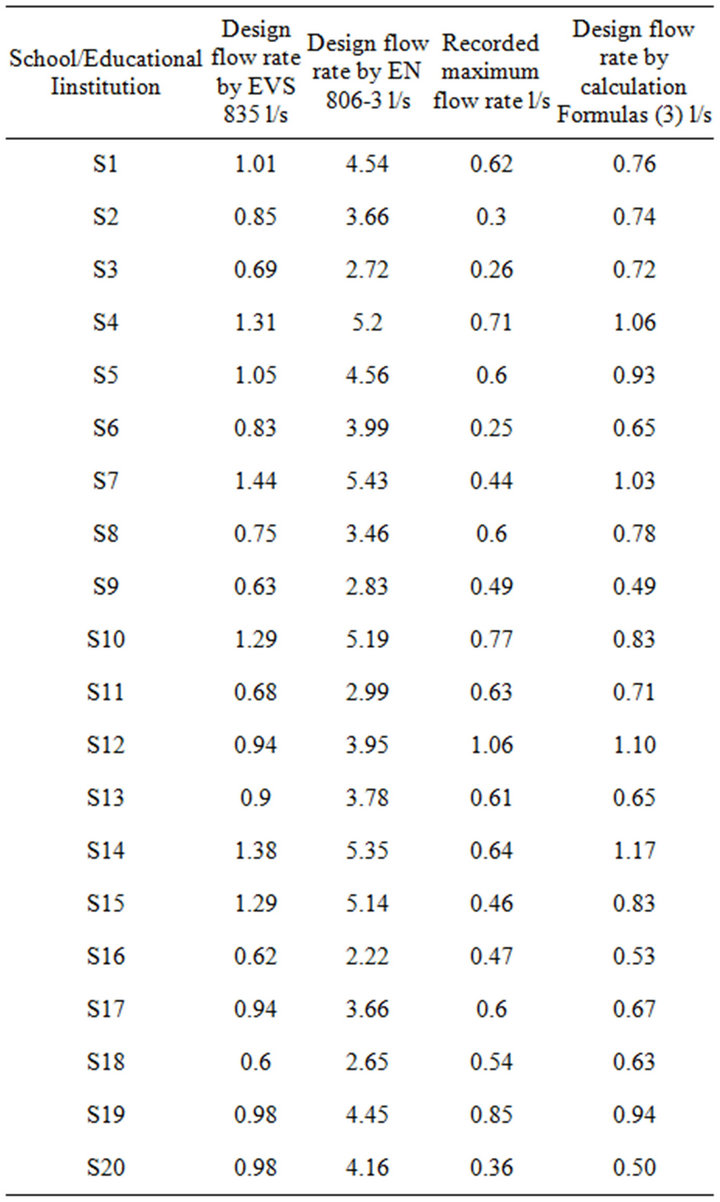
Table 2. Comparison of the design flow rates determined by the results of recording with those determined by EVS 835: 2003, EN 806-3 and recorded values in school buildings.
to 2 times smaller than those calculated by the EVS standard and about 5 times smaller than those determined by the EN standard.
The big difference in DHW actual consumption and the same by standards due to the fact that standards are based on decades ago the situation. Thus, according to standards obtained the probability consumption does not meet the current situation.
Figure 6 shows the comparison of design flow rates determined for schools by the empiric formula, the standard EVS 835 and recorded values. It can be seen that in about 50% of schools the design flow rates determined by the empiric Formula (3) the flow rates are considerably smaller, in about 30% of the schools they are somewhat smaller and in 20% of the schools they are equal or somewhat bigger comparing with standard EVS 835.
At a same time the association with the actual design flow rates is better as the calculation depended on the
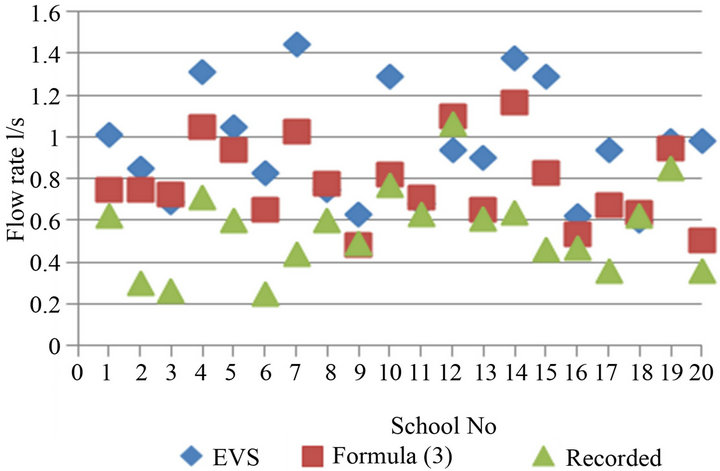
Figure 6. Comparison of the design flow rates determined for schools by the empiric Formula (3), the standard EVS 835 and recorded values.
number of water outlet devices only slightly, the majority of which are used marginally.
Variation graph of DHW consumption is presented in Figure 7. As can be seen in ordinary school there is no DHW consumption at weekend. Maximum consumption on weekdays takes place at lunchtime.
3.2. Kindergartens
The design flow rates recorded in kindergartens and those determined by the standard EVS 825:2003, and design flow rates calculated by Formula (4) are presented in Table 3.
In Table 3, we can see that the design flow rates determined by EVS 835: 2003 are bigger than the actual ones, which fact results in over dimensioning the DHW instantaneous heat exchangers and the control devices.
As the design flow rates determined by the EVS standard are up to 1.8 times bigger than the measured ones in kindergartens, a new empirical formula is presented for determining them in selecting water heating devices (4)
 (4)
(4)
where q—design flow rate l/s; N1 is the number of showers, N2 is the number of children, N3 is number of water outlet devises.
Table 3 shows that the design flow rates determined by Formula (4) are up to 1.7 times smaller than the ones determined by the EVS standard.
Variability graph of DHW consumption in kindergarten is presented in Figure 8. Maximum consumption in kindergartens can take place in the morning, at lunch time as well as in the afternoon. On most days the top maximum consumption occurs at lunchtime.
3.3. Office Buildings
Table 4 presents the design flow rates recorded in office buildings and those determined by EVS 835: 2003,
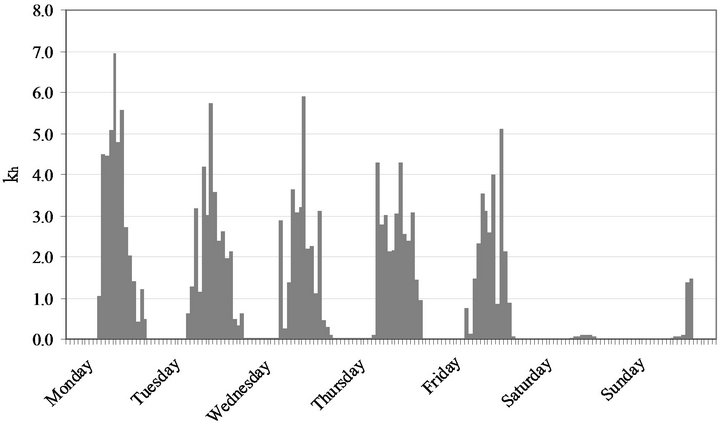
Figure 7. Weekly variability graph of DHW consumption in the educational building.
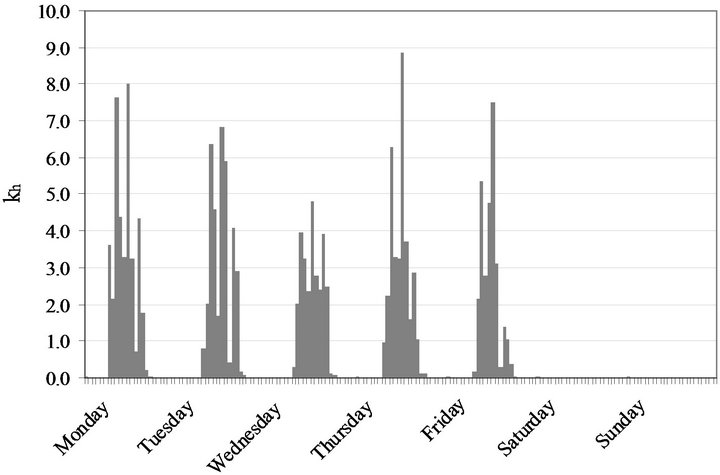
Figure 8. Weekly variability graph of DHW consumption in kindergarten.
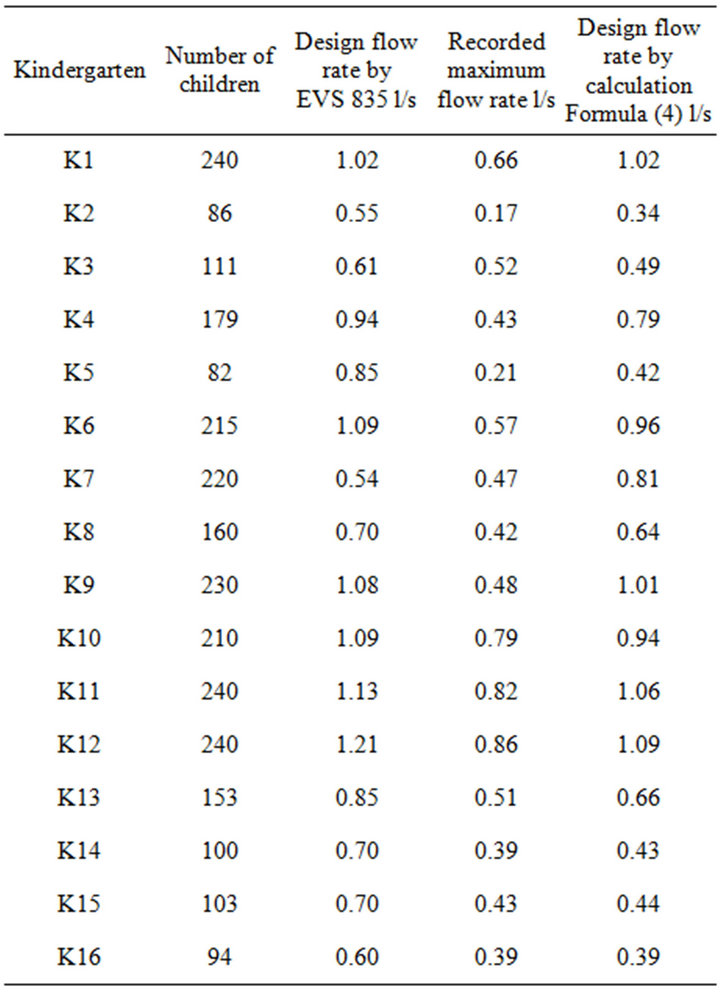
Table 3. Comparison of the design flow rates determined by the results of recording with those determined by EVS 835: 2003 and Formula (4).
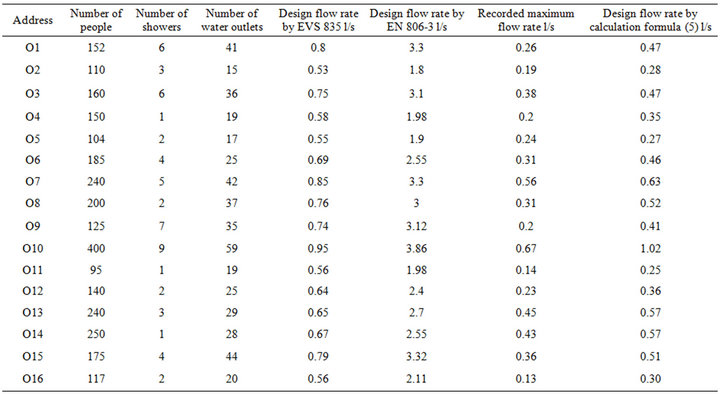
Table 4. Comparison of the design flow rates determined by the results of recording with those determined by EVS 835:2003 and EN 806-3 in office buildings.
EN 806-3 and building parameters. A comparison of these standards values with the results of recording is given in Table 4.
A new empirical Formula (5) for determining the design flow rates in dimensioning the water heating devices was recommended
 (5)
(5)
where q—design flow rate l/s; N1—number of showers; N2—number of people; N3—number of water outlet devises.
Table 4 shows that the use of EVS 835: 2003 leads to a most considerable over dimensioning of the DHW instantaneous heat exchangers and the control devices. In Table 4, it can be seen that the design flow rates of office buildings determined by the Euro standard are not suitable for Estonia, because the results obtained are more than 10 times bigger than the measured consumption in office buildings. The reason is that the probability consumption does not meet the current situation.
Table 4 shows that the design flow rates in office buildings determined by the standard EVS 835 are about 4 and even more times bigger than the maximum flow rates measured. The results obtained by determining the flow rates by the Euro standard are even up to 15 times bigger than the maximum flow rates measured. For that reason a new empiric formula has been worked out for determining the design flow rates for office and public buildings (5).
Table 4 shows that the design flow rates determined by Formula (5) are up to 2 times smaller than those determined by the standard EVS and up to 8 times smaller than the design flow rates determined by the Euro standard.
Figure 9 presents a comparison of the design flow rates determined for office buildings by the empiric Formula (5), the standard EVS 835 and recorded values. We can see that design flow rates determined by the Formula
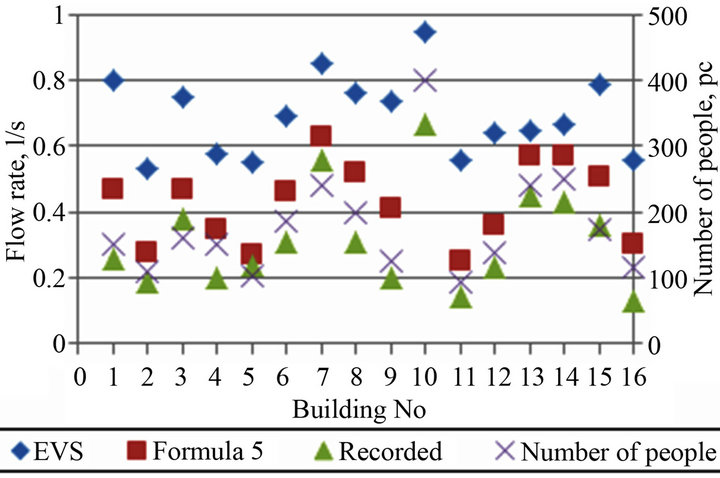
Figure 9. Comparison of the design flow rates determined for office buildings by the empiric formula (5), the standard EVS 835 and recorded values.
(5) are more close to recorded values.
The weekly variability graph of DHW consumption in the office building is presented in Figure 10. The graph given in Figure 10 is typical of smaller office buildings that have no sauna. Characteristic of such office buildings is the DHW consumption only on workdays with the top consumption only at lunchtime.
3.4. Shopping Centers
Table 5 gives a comparison of the recorded maximum flow rates, design flow rates determined by the standard EVS 835 and the Formula (6) and the values that affect the water consumption.
Table 5 shows that the DHW design flow rates determined for trade centers by the standard EVS 835 are at least 3 times bigger than the actual maximum consumption. Such a situation made it necessary to work out a new calculation formula for determining the DHW design flow rates for trade centers.
One of the reasons for the great difference between the actual DHW maximum consumption and the design flow rates determined by the standard EVS is the fact that the preparation of semi-fabricated food on the spot has been finished.
Below we present a recommendable calculation Formula (6)
 (6)
(6)
Where q is design flow rate l/s; N1 is number of showers; N2 is number of visitors; N3 is number of water outlets.
4. Conclusions
With drastically decreased DHW consumption rising a need for new calculation formulas for determining the DHW design flow rates for instantaneous heat exchangers, the new calculation methodology of dimensioning

Figure 10. Weekly variability graph of DHW consumption in office building.
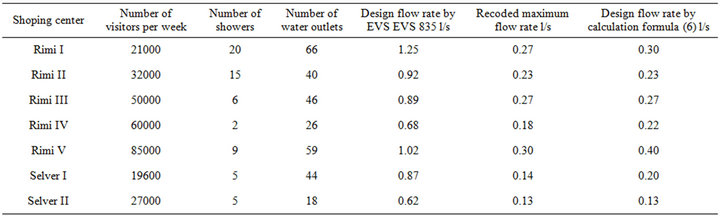
Table 5. Comparison of the recorded maximum flow rates, design flow rates determined by the standard EVS 835 and the formula (6).
instantaneous heat exchangers for DHW systems is of particular importance. In the papers of several investigators, it has also been pointed out that for heating DHW it would be suitable to use instantaneous heat exchangers instead of tank type water heaters. This would at the same time decrease the risk of Legionella disease.
The DHW design flow rates determined for office buildings and shopping centers by the recommended empiric formulas are about two times lower than those determined by the still used method EVS 835.
5. Acknowledgements
Publication of this article was supported by the ESF measure 1.2.4, Development of cooperation and innovation of universities, the sub-measure “Doctoral Schools” that finances the project “Construction and Environmental Engineering PhD School”—project code 1.2.0401.09-0080.
REFERENCES
- A. V. Hludov, “Supply of Domestic Hot Water,” Edition of Construction, Moscow, 1957.
- E. Г. Бродский, Горячее водоснабжение при теплo- фикaции. Л., 1961. (Supply of domestic hot water with district heating)
- J. D. Borodkin and N. G. Dvoretskov, “Modes of Hot Water Supply of Residential Buildings and Their Effect on the Regulation Heat Supply,” Proceedings of Heat Supply of Cities, Vol. 95, Scientific Papers of AKH, Moscow, 1973, pp. 49-52.
- J. G. Brodski, “Investigation of Modes of Hot Water Systems in Open District Heating Network,” Proceedings of Heat Supply of Cities, Vol. 38, Scientific Papers of AKH, Moscow, 1965, pp. 65-79.
- T.-A. Koiv, “Experimental Study of Modes of Hot Water Consumption by the Residents of Tallinn,” Scientific Papers of TPI, Vol. 420, Tallinn, 1977, pp. 35-42.
- S. Deng, “Energy and Water Uses and Their Performance Explanatory Indicators in Hotels in Hong Kong,” Energy and Buildings, Vol. 35, No. 8, 2003, pp. 775-784. doi:10.1016/S0378-7788(02)00238-4
- C.-L. Cheng, “Study of the Inter-Relationship between Water Use and Energy Conservation for a Building,” Energy and Buildings, Vol. 34, No. 3, 2002, pp. 261-266. doi:10.1016/S0378-7788(01)00097-4
- R. M. Willis, R. A. Stewart, K. Panuwatwanich, S. Jones and A. Kyriakides, “Alarming Visual Display Monitors Affecting Shower End Use Water and Energy Conservation in Australian Residential Households,” Resources, Conservation and Recycling, Vol. 54, No. 12, 2010, pp. 1117-1127. doi:10.1016/j.resconrec.2010.03.004
- R. M. Willis, R. A. Stewart, D. P. Giurco, M. R. Talebpour and A. Mousavinejad, “End Use Water Consumption in Households: Impact of Socio-Demographic Factors and Efficient Devices,” Journal of Cleaner Production, 2011, in Press. doi:10.1016/j.jclepro.2011.08.006
- C. G. Carrington, D. M. Warrington and Y. C. Yak, “Structure of Domestic Hot Water Consumption,” Energy Research, Vol. 9, No. 1, 2007, pp. 65-75.
- J. P. Meyer and M. Tshimankinda, “Domestic Hot Water Consumption in South African Houses for Developed and Developing Communities,” Energy Research, Vol. 21, No. 7, 1997, pp. 667-673. doi:10.1002/(SICI)1099-114X(19970610)21:7<667::AID-ER286>3.0.CO;2-2
- R. Rankin and P. G. Rousseau, “Sanitary Hot Water Consumption Patterns in Commercial and Industrial Sectors in South Africa: Impact on Heating System Design,” Energy Conversion Management, Vol. 47, No. 6, 2006, pp. 687-701. doi:10.1016/j.enconman.2005.06.002
- J. P. Meyer, “Domestic Hot Water Consumption of the Developed and Developing Communities in South Africa,” ASHRAE Transactions, Vol. 105, 1999.
- J. P. Meyer, “A Review of Domestic Hot Water Consumption in South Africa,” R & D Journal, Vol. 16, 2000, pp. 55-61.
- J. E. Calmeyer and G. J. Delport, “The Modelling and Control of Hot Water Consumption in Residential Hostells,” Africon IEEE, Vol. 2, 1999, pp. 825-830.
- B. Ndoye and M. Sarr, “Influence of Domestic Hot Water Parameters on the Energy Consumption of Large Buildings in Senegal,” Energy Conversion and Management, Vol. 44, No. 16, 2003, pp. 2635-2649. doi:10.1016/S0196-8904(03)00023-2
- A. A. Hegazy, “Effect of Inlet Design on the Performance of Storage-Type Domestic Electrical Energy,” Water Heaters,” Vol. 84, No. 12, 2007, pp. 1338-1355.
- R. T. A Prado and O. M. Gonçalves, “Water Heating through Electric Shower and Energy Demand,” Energy and Buildings, Vol. 29, No. 1, 1998, pp. 77-82. doi:10.1016/S0378-7788(98)00034-6
- B. Nemethi and Z. Szantho, “The Role of Pipe-Diameters in Operating the Non-balanced Domestic Hot Water Circulation Systems,” WSEAS Transactions on Heat and Mass Transfer, Vol. 1, No. 6, 2006, pp. 660-665.
- B. Nemethi and Z. Szantho, “Measurement Study on Demand of Domestic Hot Water in Residential Buildings”, 2nd IASME/WSEAS International Conference on Energy and Environment, Portoroz, 15-17 May 2007.
- J. Bujak, “Heat Consumption for Preparing Domestic Hot Water in Hospitals,” Energy and Buildings, Vol. 42, No. 7, 2010, pp. 1047-1055.
- T. Cholewa and A. Siuta-Olcha, “Experimental Investigations of a Decentralized System for Heating and Hot Water Generation in a Residential Building,” Energy and Buildings, Vol. 42, No. 2, 2010, pp. 183-188. doi:10.1016/j.enbuild.2009.08.013
- B. Bøhm and P. O. Danig, “Monitoring the Energy Consumption in a District Heated Apartment Building in Copenhagen, with Specific Interest in the Thermodynamic Performance,” Energy and Buildings, Vol. 36, No. 3, 2004, pp. 229-236. doi:10.1016/j.enbuild.2003.11.006
- K. Yliniemi, J. Delsing and J. van Deventer, “Experimental Verification of a Method for Estimating Energy for Domestic Hot Water Production in a 2-Stage District Heating Substation,” Energy and Buildings, Vol. 41, No. 2, 2009, pp. 169-174. doi:10.1016/j.enbuild.2008.08.008
- R. Savickas, “Efficiency of Hot Water Supply Systems in Buildings,” Ph.D. Thesis, Vilnius University of Technology, Vilnius, 2006.
- “Estimates of Hot Water Consumption from the 1998 EFUS, Implications for the Modeling of Fuel Poverty in England,” 2005. http://www.docstoc.com/docs/68232849/Estimates-of-hot-water-consumption-from-the-1998-EFUS 2
- F. S. Goldner, “Try These on for Size: New Guidelines for Multifamily Water Heating,” Home Energy Magazine, 1996.
- P. Fairey and D. S. Parker, “A Review of Hot Water Draw Profiles Used in Performance Analysis of Residential Domestic Hot Water Systems,” Research Report, University of Central Florida, Florida, 2004.
- E. Vine, R. Diamond and R. Szydlowski, “Domestic Hot Water Consumption in Four Low-Income Apartment Buildings,” Lawrence Berkeley Laboratory, Berkeley. doi:10.1016/0360-5442(87)90005-3
- R. Hendron and J. Burch, “Development of Standardized Domestic Hot Water Event Schedules for Residential Buildings.” http://www.osti.gov/bridge
- C. Aguilar, D. J. White and D. L. Ryan, “Domestic Water Heating and Water Heater Energy Consumption in Canada,” CBEEDAC 2005-RP-02.
- M. Alary and J. R. Joly, “Risk Factors for Contamination of Domestic Hot Water Systems by Legionella,” Environmental Microbiology, Vol. 57, No. 8, 1991, pp. 2360- 2367.
- H. Y. Buse, M. E. Schoen and N. J. Ashbolt, “Legionella in Engineered Systems and Use of Quantitative Microbial Risk Assessment to Predict Exposure,” Water Research, Vol. 46, No. 4, 2012, pp. 921-933. doi:10.1016/j.watres.2011.12.022
- L. F. Cabeza, “Legionella in Combisystems Tanks,” 2005. http://www.iea-shc.org/publications/downloads/task32-Legionella_in_Combisystems_Tanks.pdf
- D. Ocipova, Z. Vranayova and O. Sikula, “Experimental Analysis of a Hot Water Tank from the View Point of Microbiological Risk,” 10th Rehva World Congress on Sustainable Energy Use in Buildings, 2010.
- T.-A. Koiv and A. Toode, “Calculation of Load of the DHW Heat Exchanger in Residential Buildings,” Proceedings of the Estonian Academy Engneering, Vol. 6, No. 4, 2000, pp. 278-283.
- T.-A. Koiv and A. Toode, “Trends in Domestic Hot Water consumption in Estonia Apartement Buildings,” Proceedings of the Estonian Academy Engneering, Vol. 12, No 1, 2006, pp.72-80.
- A. Toode and T. -A. Koiv, “Domestic Hot Water Consumption Investigation in Apartment Buildings,” Proceedings of the Estonian Academy of Sciences: Engineering, Vol. 11, No. 3, 2005, pp. 207-214.
- A. Toode, “DHW Consumption, Consumption Profiles and Their Influence on Dimensioning of a District Heating Network,” Ph.D. Thesis, Tallinn University of Technology, Tallinn, 2008.
- T. -A. Koiv and A. Toode, “Energy Consumption Trends in Estonian Apartment Buildings,” Proceedings of the 1th Scientific-Technical Conference “Heating and ventilation in agriculture and industry” in Tlen, Poland, 7-9 September 2006, pp. 39-46.
- M. Lahe, “Investigation of DHW Consumption in Trade, Residential and Public Buildings,” Master’s thesis, Tallinn University of Technology, Tallinn, 2010.
- EVS 835, “Kinnistu veevärgi projekteerimine,” Eesti standard, Tallinn, 2003. (Designing Water Supply Systems for Buildings. Estonian Standard).
- EN 806-3, “Specifications for Installations inside Buildings Conveying Water for Human Consumption—Pipe sizing,” European Standard, Brussels, 2006.
- K. T. Papakostas, N. E. Papageorgiou and B. A. Sotiropoulos, “Residential Hot Water Use Patterns in Greece,” Process Equipment Design (PED) Laboratory, Energy Section, Department of Mechanical Engineering, Aristotle University of Thessaloniki, Thessaloniki, 1995. doi:10.1016/0038-092X(95)00014-I
- H. Aki, Y. Taniguchi, I. Tamura, A. Kegasa, H. Hayakawa, Y. Ishikawa, S. Yamamoto and I. Sugimoto, “Fuel Cells and Energy Networks of Electricity, Heat, and Hydrogen: A Demonstration in Hydrogen-Fueled Apartments,” International Journal of Hydrogen Energy, Vol. 37, No. 2, 2012, pp. 1204-1213. doi:10.1016/j.ijhydene.2011.10.021
- T.-A. Koiv, A. Toode and A. Hani, “The Influence of Domestic Hot Water Maximum Consumption on the District Heating Network Dimensioning,” Wseas Transactions on Environment and Development, Vol. 5, No. 1, 2009, pp. 104-108.