Smart Grid and Renewable Energy
Vol. 3 No. 4 (2012) , Article ID: 24422 , 14 pages DOI:10.4236/sgre.2012.34040
Advancement in Wide Area Monitoring Protection and Control Using PMU’s Model in MATLAB/SIMULINK
![]()
1Electrical Engineering Department, COMSATS Institute of Information & Technology, Abbottabad, Pakistan; 2Electrical Engineering Department, NWFP University of Engineering & Technology, Peshawar, Pakistan; 3Electrical Engineering Department, Gandhara Institute of Science & Technology, Peshawar, Pakistan; 4IT Department, Hazara University, Havelian, Abbottabad.
Email: mohammad-a@live.com
Received June 29th, 2012; revised August 1st, 2012; accepted August 8th, 2012
Keywords: Wide Area Monitoring Protection and Control (WAMPAC); Phasor Measurement uNit (PMU); Wide Area Monitoring (WAM); Global Positioning System (GPS); Wide Area Controller (WAC); Local Area Controller (LAC); Phase Angle Monitoring (PAM); Automatic Generation Control (AGC); Circuit Breaker (CB); Current Transformers (CTs); Potential Transformers (PTs)
ABSTRACT
A big step forward to improve power system monitoring and performance, continued load growth without a corresponding increase in transmission resources has resulted in reduced operational margins for many power systems worldwide and has led to operation of power systems closer to their stability limits and to power exchange in new patterns. These issues, as well as the on-going worldwide trend towards deregulation of the entire industry on the one hand and the increased need for accurate and better network monitoring on the other hand, force power utilities exposed to this pressure to demand new solutions for wide area monitoring, protection and control. Wide-area monitoring, protection, and control require communicating the specific-node information to a remote station but all information should be time synchronized so that to neutralize the time difference between information. It gives a complete simultaneous snap shot of the power system. The conventional system is not able to satisfy the time-synchronized requirement of power system. Phasor Measurement Unit (PMU) is enabler of time-synchronized measurement, it communicate the synchronized local information to remote station.
1. Introduction
The electrical power system is not a simple thing it’s a complex man-made system so it has many problems where as on the other end, it should reliable and supply electrical energy continuously without any interruption. There should be no blackout and outage [1]. The blackouts and especially infrequent outages is a combination of series of interrelated events. These series of events are hard to account even with modern powerful systems and can no longer be contained to the small portion of the system. Sometimes these small events or disturbances can be amplified to a system wide effect. Therefore for this purpose many techniques have been developed to survive the power system during disturbances and to continue its operation [2]. One recent developed technique which is used is WAMPAC with time synchronized measurement. It is a technique which transports the local information of selected areas to the remote location to work against the promulgation of vast disturbances. Presently, [3] the main technology used in it is PMUs and is the most precise and advanced technology. It gives information about the current and voltage Phasor, frequency and rate of change of frequency, this all information is synchronized with a high accuracy to a common reference time provided by GPS [4]. Its operation is based on mathematical measurement algorithms [5]. in an environment where the protected area is large, it would be very hard to design a protective or emergency control scheme based on fixed parameter settings As technology advances, the time frame of synchronized information has been steadily reduced from minutes, to seconds, milliseconds, and now microseconds. If only PMU measurements are used, there are also no complications from the use of both polar and rectangular values in the state estimation process, as would be done when including PMU measurements in traditional state estimators [6]. For example, one of the proposed applications of PMUs is their use on control for monitoring, alarm, and control operations [7].
This technology has been made possible by advancements in computer and processing technologies and availability of GPS signals. We are rapidly approaching an era where all metering devices will be time synchronized with high precision and accurate time tags as part of any measurement. To achieve the potential benefits, advancements in time synchronization must be matched by advancements in other areas. One example is data communications, where communication channels have become faster and more reliable in streaming PMU data from remote sites to a central facility. Improvements in instrument transformers (such as optical transducers) are important for the quality of the signals supplied to the PMU. A third area is in developing applications, i.e., software that operates on the data provided by the PMUs. Although academia, vendors, utilities, and consultants have developed a large number of methods and algorithms and performed system analysis and studies to apply the technology, like any other advanced tool, PMUs are good only in the hands of trained users. The technology exists today to bring the PMU information into the control centers located at remote area and present it to the operators in a graphical format. In this paper we discuss this advanced technology (PMUs) with the help of MATLAB simulation. We design this PMU model in MATLAB SIMULINK and then we installed this model in the start and end of transmission line in our sample simulation of a small power system in SIMULINK. This all is for testing of its testing valuation. Such application is made for the protection, monitoring and control of wide power system. And this paper also discusses our related research work to this subject.
In Figure 1 there is a transmission line, PMUs are installed on both ends of transmission line, these PMUs get data from CT and PT and then find the real time Phasor of current, voltage, frequency and rate of change of frequency, These Phasor are synchronized with respect to time provided by GPS, then transfer this data to the local PDCs, this data is then transferred to super PDC and then super PDC gives that data to data server.

Figure 1. Block diagram of WAMPAC.
2. Phasor Measurement Unit
[8] One of the most important measurement devices in Power systems is PMU. The PMU is capable of measuring the synchronized voltage and current phasor in a power systems. [9] The commercialization of the GPS with accuracy of timing pulses in the order of 1 microsecond made possible the commercial production of phasor measurement units. [10] PMU is considered to be one of the most important measuring devices in the future of power systems. The distinction comes from its unique ability to provide synchronized phasor measurements of voltages and currents from widely dispersed locations in an electric power grid. Simulations and field experiences suggest that PMUs can revolutionize the ways that power systems are monitored and controlled.
In this paper we introduce the PMU’s simulation in MATLAB and we integrated PMU in a simple power system. We derived the mathematical model and did simulation in MATLAB/SIMULINK.
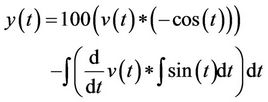
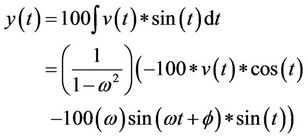
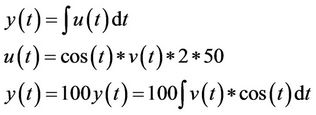
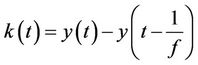
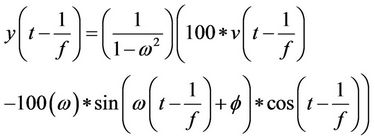
PMU Mathematical Model
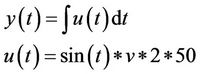
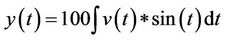
Following mathematical model is used to calculate the magnitude and phase angle of currents and voltages.
These equations are represented below:
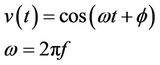
 (1)
(1)
Now for real part:

Now
 (2)
(2)
 (3)
(3)
Put Equations (2) and (3) in Equation (1)
For imaginary part:
 (4)
(4)

 (5)
(5)
 (6)
(6)
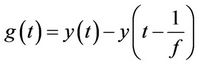
Put Equations (5) and (6) in Equation (4) so

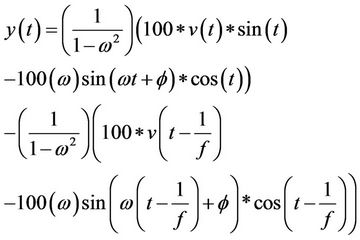
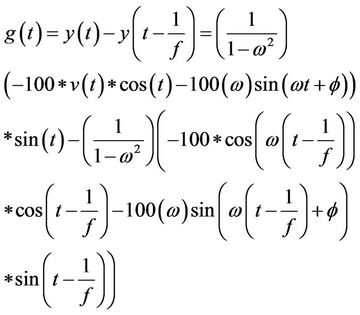
Now for magnitude and phase angle:

In this mathematical model we calculated real and imaginary part separately and then from it we calculated magnitude and phase
Figure 2 shows the PMU model which finds the Phasor of current, voltage, frequency and rate of change of frequency with respect to the GPS time. It gives us time synchronized measurement (this is the main advantage of PMU) angle.
3. Wide Area Modeling
Figure 3 shows our main simulation model where we have small sample power system; we have sub-system of generation and have two load areas consisting of domestic, commercial and industrial loads. These areas are fed by 500 kv transmission line. [11] In this power system we installed PMUs at both ends of transmission line and also in generation sub-system.
Figures 4-6 are the sub-system of load consisting domestic, commercial and industrial respectively.
4. Wide Area Monitoring
PMUs create a picture showing the stability status of the nodes in the monitored area. PMUs take this picture at the same reference time. Using real-time information from PMUs and automated controls to predict, identify, and respond to system problems; a smart grid can automatically avoid or diminish power outages, power quality problems and supply disruptions.
A Phasor network consisting of PMUs spread throughout the power system, PDC collect the information from PMUs and GPS time stamping can provide a theoretical accuracy of synchronization better than 1 microsecond. “Clocks need to be accurate to ±500 nanoseconds to provide the one microsecond time standard needed by each device performing SynchroPhasor measurement.” For 50 Hz systems, PMUs must deliver between 10 to 30 synchronous reports per second depending on the application. The PDC correlates the data, controls and moni-
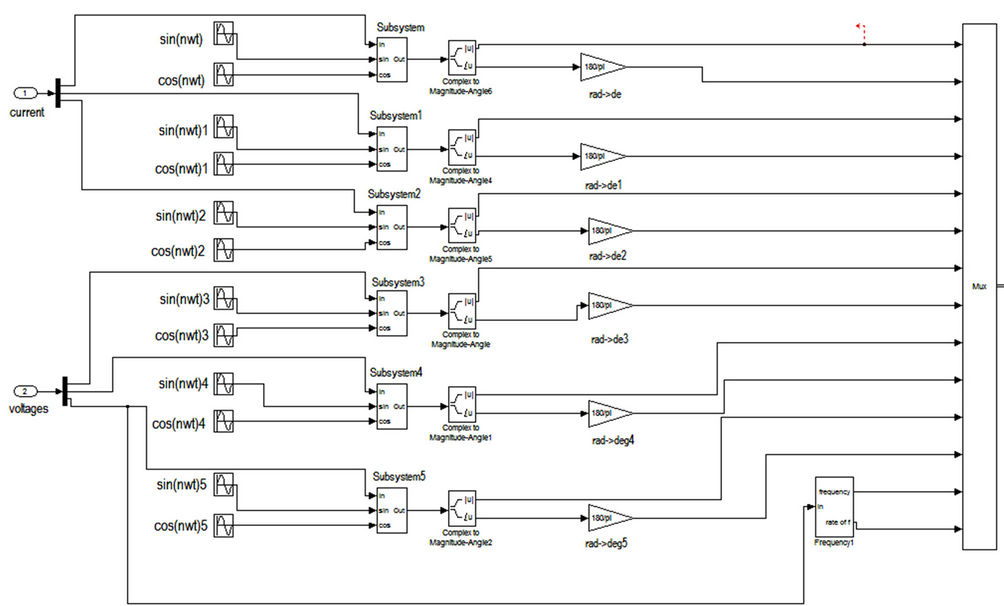
Figure 2. PMU SIMULINK block diagram.


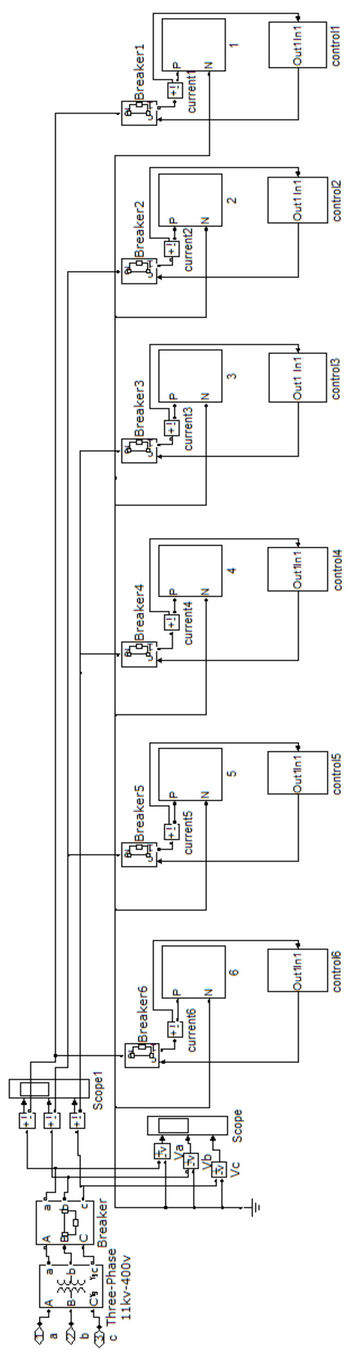

Figure 6. Industrial load modeling.
tors the PMUs (from a dozen up to 60) .
In Figure 7 we have a current magnitude of phase c, current injection of line-1, current injection of line-2 and current injection of generator. Generator current is higher than line-1 and line-2 because at generator terminal we have 11 kv but at transmission line we have 500 kv. This all information of current magnitude is measured by PMU. We are measuring the current magnitude of all phases like this one. These all values of currents are real and time synchronized taken at the simultaneous time.
Figure 8 shows the voltage magnitude of phase c, voltage of line-1, voltage of line-2 and voltage of generator. Generator voltage is less than line-1 and line-2 because for transmission we step-up the voltage. This all information of voltage is calculated by PMU. We are measuring the voltage magnitude of all phases like this one. These all values of voltages are real and time synchronized taken at the simultaneous time.
5. Wide Area Control
[12] Normal control measures are linked with permanent control activities, that can be either discrete, e.g., tapchanger and shunt devices, or continuous, such as frequency control. Normal control is defensive, i.e., measures are taken to adjust the power system operational conditions to the present and near future probable situation. Normal control is usually repeated, e.g., tap-changer, reactive shunt devices, frequency control and AGC. The difference between normal and emergency control is the penalty for the power system if the control achievement is not performed. If a normal, protective, control deed is not performed, there is an increased risk for the failure of power system stability that stability will be lost if a severe disturbance occurs. If an emergency, corrective, control action is not performed, the system will go unsound. The response requirement (time and reliability) are normally higher for emergency control measures then for normal control actions. [13] Emergency control functions are almost always habitual, while normal control measures can be either automatic or manual, e.g., in combination with alarms. The actions taken in the power system are however fairly similar for both normal control and emergency control. Protection, system protection, an emergency control contain remedial measures, i.e., actions are really needed to save the component or the system. Protection could very well be regarded as binary (on/off) emergency control, but by custom, protection is quite precise. Angle control is more exact if based on PMUs. Without PMUs power flow is an indirect method of measuring and controlling the angle. The measures are similar as for power flow control. [11] PMU is a device for synchronized measurement of ac voltages and cur-
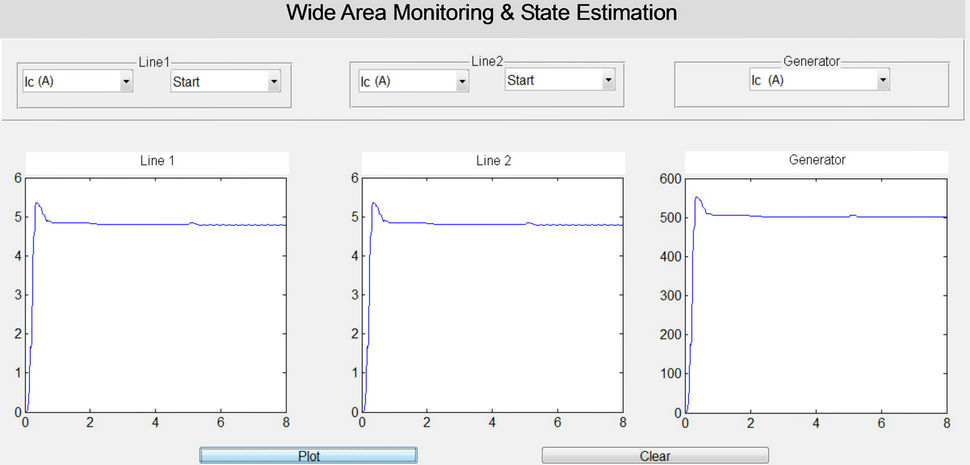
Figure 7. Current magnitude measurement.

Figure 8. Voltage magnitude measurement.
rents, with a common time (angle) reference. The most common time reference is the GPS signal, which has a precision better than 1 microsecond. In this way, the ac quantities can be calculated, converted to Phasor (complex numbers by their magnitude and phase angle), and time imprinted.
By using PMU we take voltage, current and phase angle from both ends of a transmission line and then send it to remote location by means of communication and there we compare these values with their respective GPS time. Actually we try to control the power flow. In the control room there are some pre-defined algorithms, those values (send by the PMU) are then compared with those algorithms, if there is a difference in the values of voltage current and phase angle then the power that will flow is changed, so to overcome that a signal is generated send it to the local area control room.
[14] The Wide Area structural design consists of various area loads i.e. Residential, Commercial, Farm, Agriculture, and Industrial. The residential and commercial load consists of resistive and inductive loads, the farm load, Agriculture load and Industrial load consisting of resistive, inductive and three-phase motor loads. The loads are controlled by WAC and additional customers of each load are controlled by a LAC. Control area Manager of each client receives signals from fault sensing system which send control signals to WAC through TCP/IP sender/receiver and manage each area all the way through bidirectional communication.
The wide area controller is the centralized portion which is the major body of the whole wide area smart grid architecture which got its smart control due to its computational engine and information user defined cases. Due to these situations the WAC perfectly control its region by means of TCP/IP through bidirectional communication.
Underneath frequency load shedding format is the most universally used control system to balance the production and load (power demand) and it is the last control step for preventing electric power system from blackouts. It deals with shedding the suitable amount of load for removing the overload situation. This may be performed in numerous steps with each step have its own set frequency and percent of load to be shed. One purpose of PMU in power system has been developed which is the execution of an adaptive load shedding scheme. Because, in this type of load shedding the quantity of load to be shed is determine adaptively according to the amount of the interruption.
6. Wide Area Protection
There exist always some disturbances in a power system but the time scale in which the dynamics of the disturbances affects the power network may be from several minutes to milliseconds. Time also depends upon the nature of the disturbances. So in all such cases there is a need of protection which consists of the following factors:
• Classification of the disturbance;
• Location of the disturbance;
• Identification and prediction of disturbance.
In order to protect the power network, we must have a full knowledge about states of the power network. The knowledge of the complete state of the power system, represented by several network parameters, requires realtime state measurements as an input. Adaptive approach is preferred in such circumstances, possessing ability to adjust to changing conditions. Relays that participate in wide-area disturbance protection and control should preferably be adaptive. Relay system design should satisfy minimum requirements of having the ability to communicate with the outside world. The communication links must be secure, and the possibility of their failure must be allowed for the design of the adaptive relays. The system measurements used in the relays must be related to the parameters that help observe the disturbance propagation. Such measurements must provide information about changing system conditions so that they will be useful in the management of the disturbance. PMU can explicitly fulfill this requirement of power system.
The power system states like voltage magnitude, voltage phase angle, current magnitude, current phase angle, frequency and rate of change of frequency are provided by PMU. All given states are real time, time synchronized accurate and error free because these states are directly measured from instrument transformers. That is why our protection system will not go for mal-operation and system will remain stable. PMU situated at the both ends (sending and receiving ends) of the transmission lines and continuously give time synchronized system states to a remote location.
Figure 9 shows an over current protection when fault occurs at time equals to 0.5 second then protection system operates and breaker gets tripped and current output will be zero.
7. Phase angle Monitoring
Through PMU we can monitor real time Phase angle of different nodes accurately because it is time synchronized and accurate PAM is too much important for a power system. PAM enables access in real time to the accurate phase angle difference between any pair of buses. PAM allows prediction of potential problems both locally and regionally. Basic PAM functionality has already been implemented with commercial and pilot software tools, and deployed in practice. Though very basic, system operators and area coordinators can be assisted by PAM in a variety of real time operational situations, such as monitoring angle separation or rate-ofchange of angle separation between two buses or two parts of a grid to determine stress on the system. Another critical application of PAM is during restoration. The phase angle value across an opened tie line or an opened circuit breaker would guide an operator in circuit breaker closing. Closing would take place only if the phase angle was below a preset threshold. The information obtained from PMUs can be also included in the CB interlocking logic. In a novel method for predicting the rotor angle stability condition of a large power system based on the use of the PMU and artificial intelligence is presented.
Figure 10 shows the phase angle in degrees of phase c. These angles are of line-1, line-2 and of generator. The phase angle of all is same and is calculated by PMU.
This figure shows that these phase angles are shifted from zero or 120 degree or 120 degree due to inductive load. Rest of the phase angles are calculated by the same way. These all values of phase angles are real and time synchronized taken at the simultaneous time.
8. Frequency and Rate of Change of Frequency Monitoring
We can measure frequency and rate of change of fre-
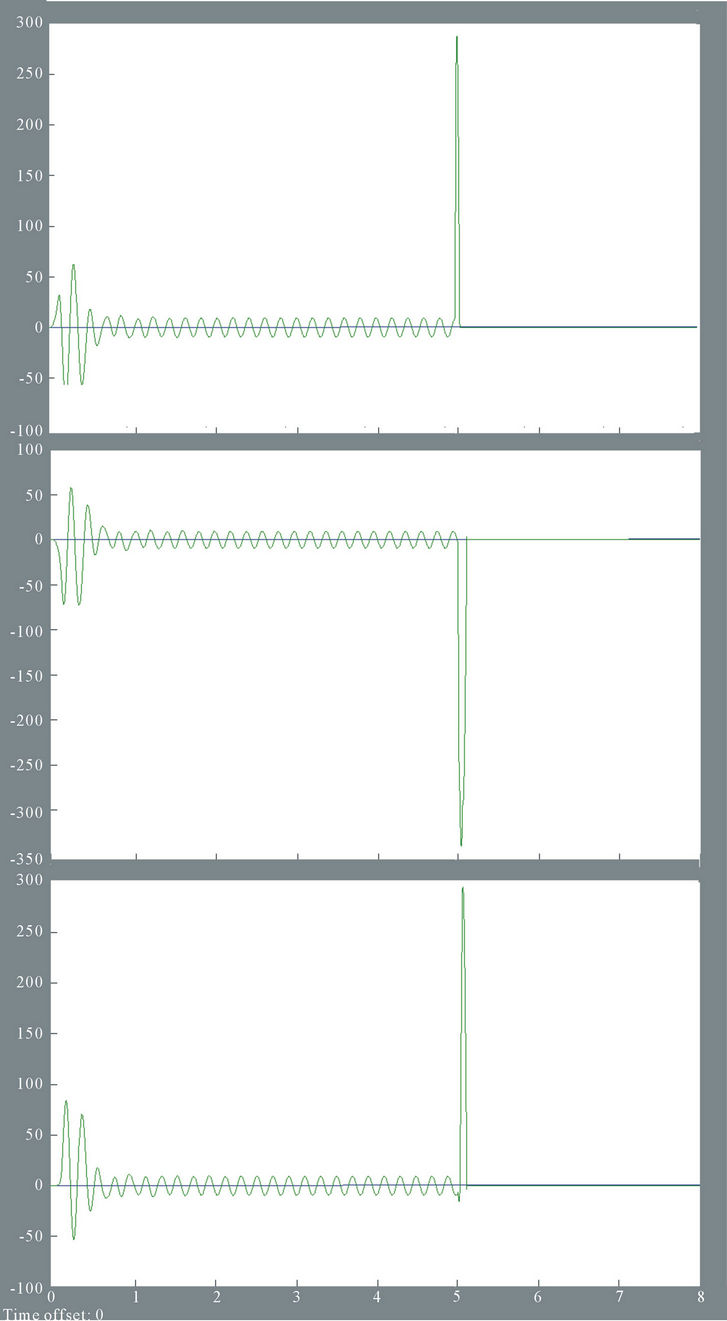
Figure 9. Over current protection.
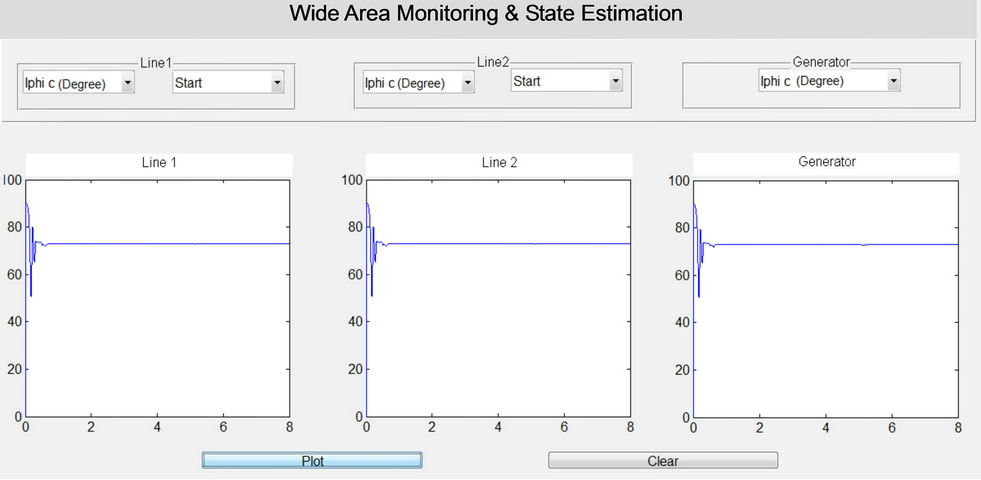
Figure 10. Current phase angle measurement.
quency through PMU. Change in frequency can reflect the change in impedance of power system component. We can observe stability of system through rate of change of frequency.
Figure 11 shows the model of frequency and rate of change of frequency measurement block. This model is integrated in PMU because it is the requirement of IEEE standard. Result of this model is shown in Figures 12 and 13.
9. Events Recording
It is very hard to find out the cause of blackout and determine the root cause of large-scale disturbance. When recorded data is not real time synchronized, so PMU is solution to this problem. PMU provides means for accurate long-term wide-area system dynamic recordings. The high data rate and precision that the technology provides also allow for capturing fast changing system dynamics of the power system. The measurements taken by a wide-area system dynamics recording technology are also helpful in determining power system characteristics such as line parameters, thermal limits, load models, machine performance, and parameters of its associated control system models. All real time synchronized data can be record in hard as well as in soft form.
10. Real Time Linear State Estimation
[15] A true application of PMU technology to state estimation would have all of the traditional measurements of real and reactive power injections and current and voltage magnitudes replaced by bus voltage Phasor and line current Phasor. If only PMU measurements are used, there are also no complications from the use of both polar and rectangular values in the state estimation process, as would be done when including PMU measurements in traditional state estimators.
If a state estimator could function with only PMU measurements as inputs then many issues associated with traditional state estimators could be resolved. Because PMUs are synchronized with GPS, the problem of scan time becomes irrelevant. One could imagine looking at the state of the power system with a traditional state estimator versus one which used explicitly synchronized PMU data and comparing it to putting on a pair of spectacles for the first time and finally having a focused view of the world. Once the problem of scan time has been erased, the only issue of time is the communication and computational delay between the collection of the measurements and the employment of useful information for decision making by the operation and control applications. Additionally, when using PMUs as metering devices, the state of the system is actually being directly measured. However, estimation is still necessary for including redundancy and bad data filtering. Because of this, the placement of the PMUs is critical for achieving a fully observable system with a sufficient amount of measurement redundancy.
11. Conclusion
The paper addresses the main reasons for execution of WAMPAC systems. In the first part of the paper, a typical WAMPAC structural design is presented with its main building blocks (PMUs). The structural design de-
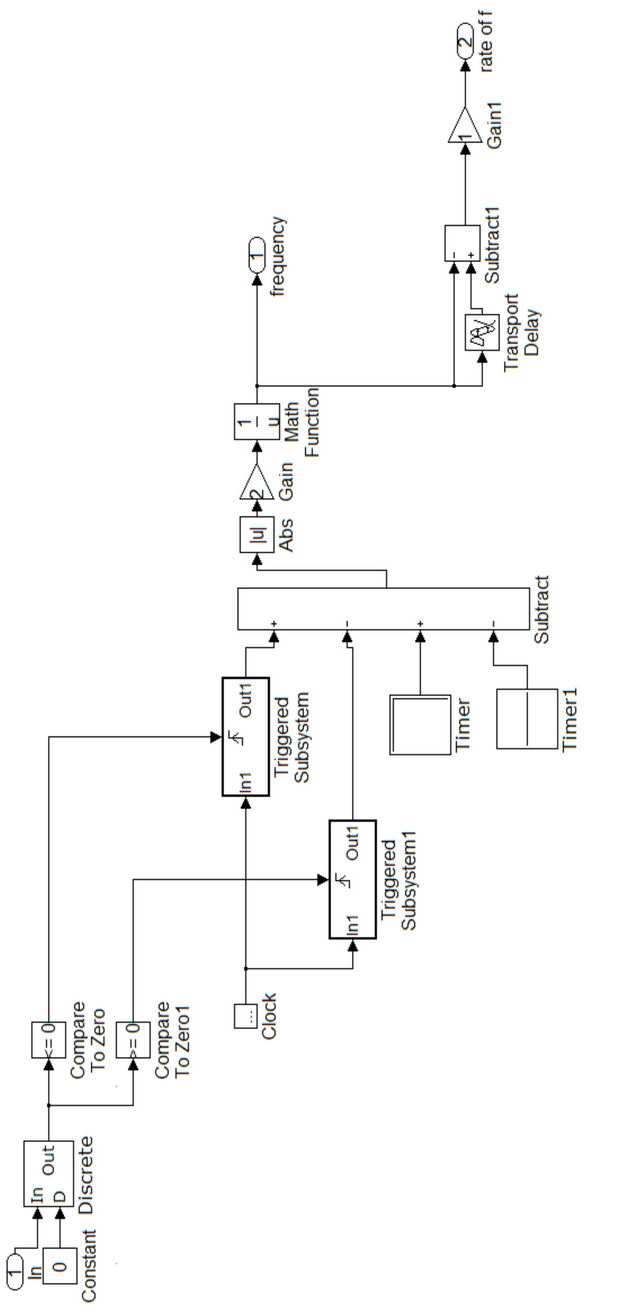
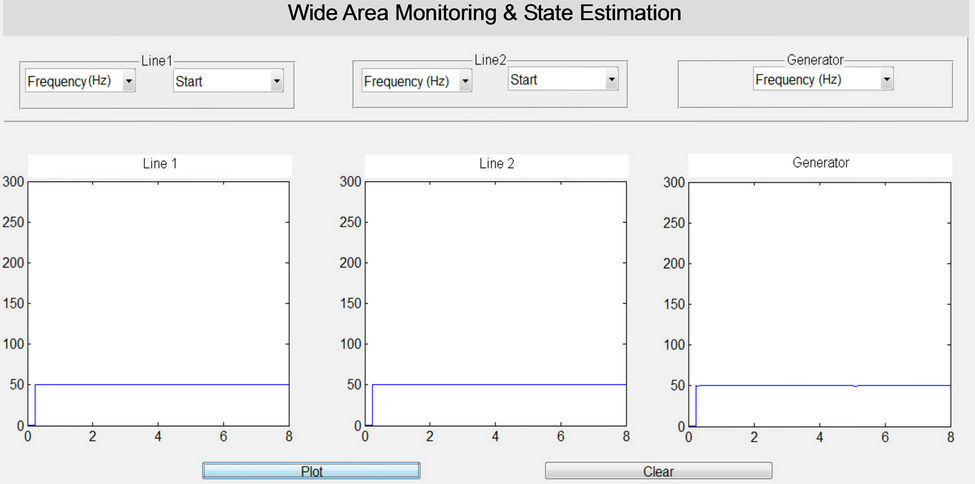
Figure 12. Frequency measurement.

Figure 13. Rate of change of frequency measurement.
pends on unambiguous system needs, its topology, creation profile, and the quality of the communication infrastructure. The paper also provides a general idea of the main WAMPAC applications and demonstrates some applications that is, dynamic recording, real time system state determination, phase angle and disturbance propagation monitoring, estimation of load model parameters, as well as protection and control related applications. References have been included which provide thoroughly implementation and lessons learned. Since future power networks will become more difficult to guess during both steady-state and transient conditions, WAMPAC systems will become an essential addition to every control room.
REFERENCES
- Y. Hu, R. M. Moraes, V. Madani and D. Novosel, “Requirements of Large-Scale Wide Area Monitoring, Protection and Control Systems,” Proc. 10th Annu. Fault Disturbance Anal. Conf., Atlanta, April 2007, pp. 1-9.
- C. Martinez, M. Parashar, J. Dyer and J. Coroas, “Phasor Data Requirements for Real Time Wide-Area Monitoring, Control and Protection Application,” EIPP White Paper, 2005, p. 8.
- J. Z. Zhu, D. Hwang and A. Sadjadpour, “Real Time Congestion Monitoring and Management of Power Systems,” IEEE/PES Transmission and Distribution Conference and Exhibition: Asia and Pacific, Dalian, 15-18 August 2005, pp. 1-5.
- J. Bertsch, M. Zima, A. Suranyi, C. Carnal and C. Rehtanz, “Experiences with and Perspectives of the System for Wide Area Monitoring of Power Systems,” CIGRE/IEEE PES International Symposium of Quality and Security of Electric Power Delivery Systems, Montreal, 7-10 October 2003, pp. 5-9.
- A. Guzman and D. Tziouvaras, “Localand Wide-Area Network Protection Systems Improve Power System Reliability,” Power Systems Conference: Advanced Metering, Protection, Control, Communication, and Distributed Resources, Clemson, 14-17 March 2006, pp. 174-181.
- A. G. Phadke, J. S. Thorp and K. J. Karimi, “Real Time Voltage Phasor Measurements for Static State Estimation,” IEEE Transactions on PAS, Vol. 104, No. 11, 1985, pp. 3098-3107.
- M. Zima, T. Krause and G. Andersson, “Evaluation of System Protection Schemes, Wide Area Monitoring and Control Systems,” 2002.
- “IEEE Standard for Synchro Phasor for Power Systems,” IEEE C37.118, 2005.
- J. S. Thorp, A. G. Phadke, S. W. Horowitz and M. M. Begovic, “Some Applications of Phasor Measurements to Adaptive Protection,” IEEE Transactions on Power Systems, Vol. 3, No. 2, 1988, pp. 791-798. doi:10.1109/59.192936
- C. Martinez, M. Parashar, J. Dyer and J. Coroas, “Phasor Data Requirements for Real Time Wide-Area Monitoring, Control and Protection Application,” EIPP White Paper, 2005, p. 8.
- D. Kosterev, A. Meklin, J. Undrill, B. Lesieutre, W. Price, D. Chassin, R. Bravo and S. Yang, “Load Modeling in Power System Studies: WECC Progress Update,” IEEE Power & Energy Society General Meeting, Pittsburg, 20- 24 July 2008, pp. 1-8. doi:10.1109/PES.2008.4596557
- A. G. Phadke, J. S. Thorp, R. F. Nuqui and M. Zhou, “Recent Developments in State Estimation with Phasor Measurements,” IEEE Power Systems Conference and Exposition, Seattle, 15-18 March 2009, pp. 1-7. doi:10.1109/PSCE.2009.4839954
- M. Zhou, V. A. Centeno, J. S. Thorp and A. G. Phadke, “An Alternative for including Phasor Measurements in State Estimators,” IEEE Transactions on Power Systems, Vol. 21, No. 4, 2006, pp. 1930-1937. doi:10.1109/TPWRS.2006.881112
- G. Valverde, C. Deyu, J. Fitch and V. Terzija, “Enhanced State Estimation with Real-Time Updated Network Parameters Using SMT,” IEEE Power & Energy Society General Meeting, Calgary, 26-30 July 2009, pp. 1-7.
- R. F. Nuqui and A. G. Phadke, “Phasor Measurement Unit Placement Techniques for Complete and Incomplete Observability,” IEEE Transactions on Power Delivery, Vol. 20, No. 4, 2005, pp. 2381-2388. doi:10.1109/TPWRD.2005.855457
Nomenclature
t: reference time;
Φ: phase angle;
v(t): input signal, voltage and current;
sin(t): reference signal of 50 or 60 Hz and have magnitude is 1 p.u.;
cos(t): reference signal of 50 or 60 Hz and have magnitude is 1 p.u.;
f: frequency of 50 or 60 Hz.