Energy and Power Engineering
Vol. 5 No. 7 (2013) , Article ID: 37005 , 8 pages DOI:10.4236/epe.2013.57052
Kite Modeling for Higher Altitude Wind Energy
Department of Mechanical Engineering, Rowan University, Glassboro, USA
Email: zhang@rowan.edu
Copyright © 2013 Hong Zhang. This is an open access article distributed under the Creative Commons Attribution License, which permits unrestricted use, distribution, and reproduction in any medium, provided the original work is properly cited.
Received June 21, 2013; revised July 21, 2013; accepted July 29, 2013
Keywords: Wind Energy; Kite; Angle of Attack; Aerodynamics
ABSTRACT
Among the renewable energy sources, high altitude wind power is gaining increased attention for its better strength, steadiness, and coverage compared to the traditional ground-based wind power with wind turbines. However, unlike the latter, the technology for high altitude wind is still immature and the works on the field are mostly empirical. In our research, we try to set up a framework about force analysis and provide a stepping stone for other kite energy researchers and engineers to develop more efficient systems. In this paper, we analyzed and experimentally verified the effects of acting aerodynamic forces at different angles of attack ranging from 0˚ to 90˚. We also studied the power potentials of a kite corresponding to these varying forces. The work will enable a researcher or engineer to design a more feasible and more efficient kite power system with better understanding of the kite dynamics.
1. Introduction
Wind energy has changed from an almost negligible part of the total electricity supply of the world to a much larger, more important, and fast expanding component after recent explosive growth [1]. As people have seen, giant industrial wind farms, small household wind turbines, and everything in between are erecting all over the places. In 2012, the electricity capacity from the wind power in the total electric capacity is about 7% in EU [2], 2.0% in China [3], and 3.5% in US [4].
Nevertheless, most people agree that wind energy should claim a much greater share of the future energy supply [5]. For example, the United States is working on an ambitious target of 20% total electricity capacity by 2030 [6]. Indeed, wind energy is one of the fastest growing energy sources today and in the foreseeable future [7]. However, finding a suitable site to build a wind farm or simply set up a wind turbine is not always easy. The wind must be strong and consistent; the tower cannot obstruct the view; and the noise cannot disturb the local residence. Due to the fast growth of population, it is increasingly difficult to find a suitable place that is proper for a wind turbine yet will not interfere with people’s everyday life.
On the other hand, wind is stronger and steadier if we move upward. Because there is less friction between the air and ground and there is less obstruction from ground topologies, wind blows faster when the altitude increases [8]. Meanwhile, the total power carried by wind is P = 1/2ρAv3, where ρ is the air density, A is the cross section area of the wind, and v is the wind speed. Hence, the total wind energy per unit area grows even faster than the wind speed. For this reason, the typical height of wind turbine towers increased from about 20 m in the 1980s to around 100 m today. Correspondingly, the tip of the rotor blades can reach nearly 200 m high.
However, there is a limit on the wind turbine height. The increased energy-flow through the rotor means a greater force on the tip of the tower, and correspondingly a greater load on the entire tower structure and the underground foundation. Meanwhile, the increased height makes it harder to install, repair or simply inspect the generator, gearbox, controller, and blades. The associated constructing and maintenance cost will significantly reduce the economic margin achieved by the higher tower and larger rotor.
Recently, many people started to think about ways of tapping the high altitude wind energy without building a big wind turbine. One method is to substitute the tower with a flying device. For example, Joby Energy [9] is developing a flying matrix of generators with rotors; Makani Power [10] is working on a generator-carrying airplane; while MagennPower [11] is working to outfit an airship with rotors and magnets and to convert it to a giant flying generator. In all of these designs, a conductive tether will both hold the flying generator in place and transmit power to the ground. However, the buoyancy of the generators completely relies on the dynamic flight control of the carriers. If there is a control or mechanical failure, the possibility of a catastrophic failure will be high. Meanwhile, safely transmitting high electric power from sky to ground is a demanding challenge to be solved.
Another approach is to separate the wind harnessing component and the power-generating component of the wind turbine. Then we can send the wind harnessing part to higher altitude and catch the full potential of the wind while keeping the heavier and more expensive power generating part on the ground for safety and maintenance purposes. For example, Laddermill [12] of Delft University of Technology (Netherlands) proposed an idea of controlling a group of vertically stacked kites to ascend and descend like a Ferris wheel and correspondingly turning the generator shaft that is connected to the hub. Likewise, KiteGen [13] of Politecnico Di Torino (Italy) proposed the concept of using a group of kites circling horizontally in the sky and powering a large stadium-like generator on the ground. Meanwhile, ideas are floating around of flying a kite with a Yo-Yo pattern and switching the power system between generator mode (pulled by the ascending kite) and electric motor mode (to reel back the descending kite). By changing the flying pattern of the kite and the corresponding lifting force, the energy generated in generator mode will be significantly greater than the energy consumed in the electric motor mode, which in turn generates positive net power in a cycle. An experimental system built by Rowan University is shown in Figure 1(b).
While many enthusiastic groups and startup companies are working on the direction, most designs are based on trial and error methods as most new technologies at their embryonic stage. Even among the researchers, most efforts are focused on design and control [13-16]. Systematic study of kite aerodynamics is rare [1,17,18]. Many people simply borrow the results from the study of airplane wings or horizontal wind turbines [19,20], and the latter are mostly based on wing study. However, there are several fundamental differences between the two. First, the airplane wings and wind turbine blades are sturdy and fixed while the kites used by most power-generating group are soft. Second, the wings and blades are designed to generate upward lift forces to keep the airplane afloat while the kite generator is to pull the tether that is connected to the generator. The force needs to not only overcome the combined weight of the kite and tether, but also the working load from the generator, which is usually significantly greater than the former loads. Third, most wings and blades are straight while most kites are curved in shape.
In this paper, we will help to pave the road of harness-
 (a)
(a)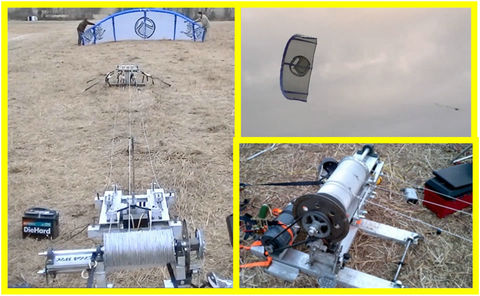 (b)
(b)
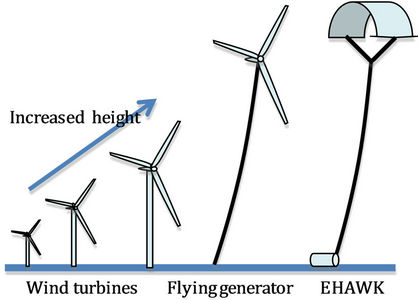
Figure 1. (a) Wind turbines are getting taller these days. To reach even higher, the tower can be changed to a soft tether. In the EHAWK (Electricity from High Altitude Wind with Kite) project, we can send the wind harness part up with a tether and keep the power generating equipment on the ground. (b) An experiment of EHAWK prototype was conducted at New Jersey to test the in-sky flight controller and overall feasibility of kite based power generator.
ing high altitude wind power by studying the aerodynamics of the kite. We will review the wind profile, develop a model of a simple weightless kite, and then theoretically analyze the forces of the kite corresponding to the varying angles of attack. We will further verify ourmodel with experimental results and then give some summary and conclusions.
2. Wind Profile
Due to the surface friction of the Earth, the wind speed is positively correlated to the height at the altitude we are interested. Although no single equation can capture the wind profile anytime anywhere, there are still two prevailing wind laws that are used in the field. They are the logarithm law and the power law [21].
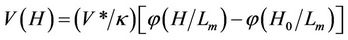
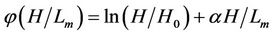
The logarithm law of wind profile over the height is based on the Monin-Obukhov similarity theory [22]. That is, in a stationary turbulent surface layer, the wind speed V(H) over height H can be described with a universal function φ
 (1)
(1)
where κ is the von-Larman constant, 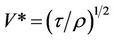 is the velocity scale generated by the turbulent friction τ and air density ρ of the surface wind over land or sea, H0 is the roughness length, and Lm is the length scale or the Monin-Obukhov length determined by the absolute temperature, gravity, air density, heat flux, and specific heat at the location. Both V* and Lm are independent of height.
According to Monin-Obukhov, we have
 (2)
(2)
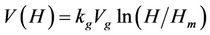
Then with some mathematical derivation, which we will not repeat here, we can get
 (3)
(3)
where Vg is the ground speed at Lm, Kg is a constant that can be determined empirically. Please note that the logarithm law does not consider the Coriolis effect and is valid for flat, uniform surface with neutral atmosphere conditions [21].
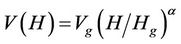
Power law is also used widely by the wind turbine industry:
 (4)
(4)
where Vg is the reference wind speed at the height Hg, α is a constant that can be determined empirically and is often taken as 1/7. This law was not developed mathematically like the logarithm law, but generally provide a close description of wind profile in many cases [1,14].
According to Thuiller and Lappe [23], the wind profile follows the logarithmic law better in middays while conforms the power law more closely at morning and evening. Both models and their variations [24] can be used in kite power designs since we just consider the effect of increased wind speed over height. The accuracy of the wind profile will determine the accuracy of the power output, but will not change the overall concept.
It is worth mentioning that due to the fluctuation of the temperature, the wind speed fluctuates accordingly since the air density ρ and the length scale Lm (a function of air density and temperature) both changes with temperature. Although the wind speed varies over time, its speed distribution is Rayleigh. Therefore, we can predict the average power generation of the kite at a given hour of the day. In fact, observation over time also shows that the change of wind speed can be assumed as sine curves over time [1]. The control design of the kite engines should be able to accommodate these changes.
3. Kite Modeling and Force Analysis
3.1. Physical Model of a Kite
When the kite is at horizontal position, or the zenith point, the wind is parallel to the chord plane of the airfoil. In most kite designs, each airfoil plane is connected to two bridal lines, one on leading edge and the other on trailing edge. A virtual effective tether can be considered to be attached to the chord plane through the aerodynamic center.
When fully inflated, the cross-section of a modern kite takes the shape of an airfoil. Therefore, we choose to model a flying kite as a number of flat airfoil planes linked together in parallel as shown in Figure 2. We also assume that the lift coefficient CL and the drag coefficient CD of the airfoils are homogeneous throughout. When the kite is gliding in the sky like a parachute, its aerodynamic behavior is similar to that of an airplane wing.
3.2. Force Analysis
However, there is one critical difference between a kite and an airplane wing. That is, a kite generally flies with a large angle of attack, which is often greater than the stall angle. On the contrary, the airplane seldom flies beyond this critical angle due to the possibility of losing speed. Therefore, we choose to define the aerodynamic forces slightly differently and set up a separate framework for kites. As seen in Figure 3(a), we can divide the incoming wind to two parts, VWF = VWcosθ as the Flying velocity, and VWP = VWsinθ as the Pushing velocity. Both VWF and VWP will generate aerodynamic forces that will affect
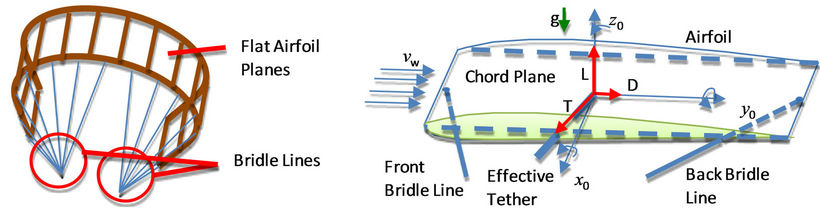
Figure 2. Left: A dynamic kite can be considered as a number of flat airfoil planes linked together in parallel. Right: A single airfoil plane in wind.
the flight of the kite.
Like an airplane wing, the flying velocity VWF will generate both lift force and drag force. We define Lift and Drag as the induced lift and drag due to the flight of the airfoil in this head wind. They are perpendicular and parallel to the chord plane respectively, as shown in Figure 3(a). Given wind speed VW, the Lift and Drag forces can be obtained as
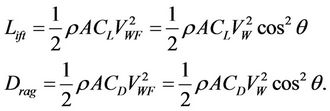 (5)
(5)
Meanwhile, VWP will generate a force Push, which can be considered as the chord plane of the kite being pushed away. That is,
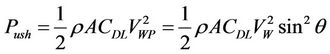 (6)
(6)
For simplicity, we can use vector summation to obtain the total aerodynamic force Pull generated by the kite with the incoming wind
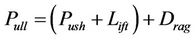 (7)
(7)
where Push and Lift are collinear and both are perpendicular to Drag.
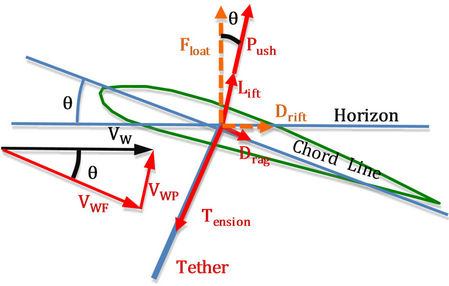 (a)
(a)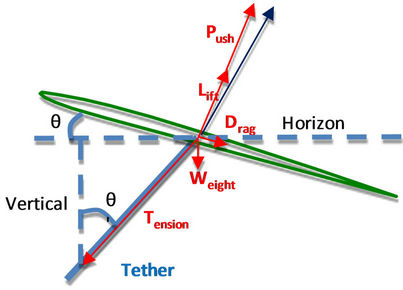 (b)
(b)
Figure 3. (a) Aerodynamic forces on kite. (b) Simplified force analysis.
Combining Lift, Drag and Push, we can project them to the horizontal and vertical directions, which are defined as Float and Drift respectively. Float is the force to keep the kite floating in the sky while Drift makes the kite drift away along the wind if it is free.
3.3. Effect of the Angle of Attack
If we change the angle of attack, we can observe different aerodynamic behaviors of a kite, where both the absolute and relative magnitudes of each aerodynamic force will change.
1) Laminar dominant range: This is where the kite flies overhead and the angle of attack is smaller than the stall angle. The head wind, VWF, is laminar and regular effect of an airfoil dominates the flight of the kite. The power carried by the transverse wind component VWP is negligible compare to that carried by VWF. Since the maximum lift coefficient CL is generally between 0.5 ~ 1 for typical large parafoils [25], the total force or tension generated by the kite is relatively small in this range. It can be used to park the kite when no power is needed or used to retrieve the kite with low power consumption.
2) Turbulent dominant range: When the angle of attack is sufficiently greater than the stall angle (without loss of generality, we arbitrarily choose it to be when Push = 3Lift), the airflow separates from the kite surface and becomes turbulent. Hence, the induced Lift and Drag from the headwind become insignificant and the form drag Push of the kite due to the crosswind becomes dominant. Since the form drag coefficient CDL (~2) of a kite is much greater than the lift coefficient CL (0.5 ~ 1), the force generated by the kite as a whole with its chord plane facing the wind is contributing far greater to the total force than the combined induced forces generated by the individual airfoils.
3) Transition range: The transition range is where the airflow changes from laminar dominant to turbulent dominant and both effects will have comparable contribution to the flight of the kite. In this paper, we will take the liberty to define it as from stall angle to the angle when Push = 3Lift.
In Figure 4(a), we illustrated the normalized aerodynamic forces generated by the kite throughout the entire range of angles of attack from 0˚ to 90˚. The airfoil profile is NACA 2412 with the stall angle around 15˚ and CDL ≈ 2. As shown in the figure, Lift and Drag forces are more evident at the laminar range. Meanwhile, Push dominates the overall aerodynamic forces at large angle of attack due to the increased VWP and greater CDL over CL and CD.
The Float increases quickly as the angle of attack increases in the laminar dominant range. As we can see from Figure 4(a), Float will keep mostly flat or increase slightly in a long range after the stall angle. However, it will deteriorate quickly at the end of the turbulent zone.
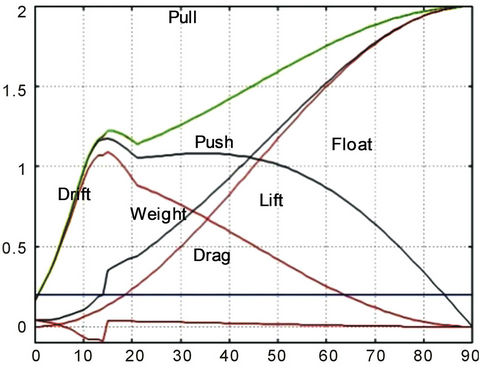
In Figure 4(b), we gave out the Drag to Pull ratio of a typical kite corresponding to the change of angle of attack. Beyond the stall angle, the ratio is extremely small, generally less than 2%. Therefore the Drag force and its corresponding angle deviation from overall pulling force will be negligible. That is, we can approximate that the aerodynamic force is perpendicular to the chord plane of the kite. For a weightless kite, or when the kite weight is negligible to the air force, we can further approximate that the tension or tether direction is perpendicular to the kite chord plane too. In this case, the angle of attack is equal to the angle of tether measured from the vertical line or z-axis.
By doing so, we can plot the relationship between Tension and the tether position as shown in Figure 4(c). The arrowed straight lines are the sample tether directions (we neglected the tether slope for simplicity). According to our assumption, their angles are equal to the angles of attack of the kite at the corresponding moment. Their lengths are the magnitudes of the normalized Tension at the directions. They are calculated as the equivalent total force coefficients 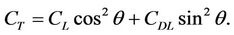 The outline curve is the change of Tension with angle of attack. As we can see, Tension increases in general as the tether rotates from upright position to horizontal position if we assume the wind speed is constant. This assumption is valid for the most kite sports like kite surfing or kite boards.
For large-scale power-generating kites, the length of the tether is long enough (>200 m) that wind speed changes over height. Therefore, the Tension force of the kite tether is not monotonically increasing. For a fixed length tether, Tension force increases (in general) when the kite moves away from the zenith point and reaches a maximum at certain angle. Then Tension starts to decrease due to the diminishing wind speed.
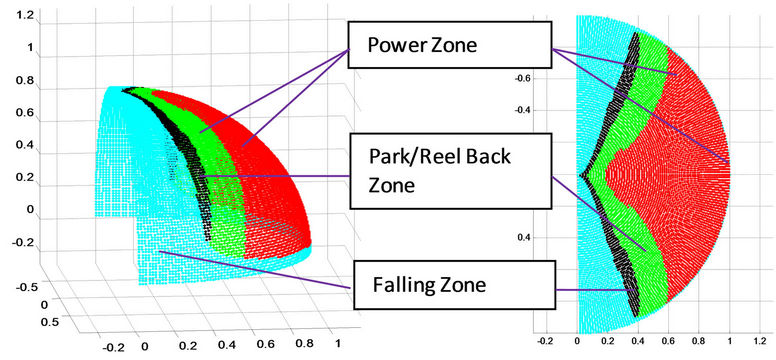
Figure 5 shows typical tension and float levels of a kite with unit length tether under unit wind velocity. The red and green zones are the power zones. It is where the kite can generate enough force to run a generator. Without losing generality, we arbitrarily divide the power zone to two parts. The forces in the green zone are lower than those in the red zone. Therefore, we can adjust the tether angle to accommodate the wind speed and power demand. For kite sports, green zone is generally used by beginners to learn basic actions while the red zone is for the advanced players to perform stunt moves.
The blue falling zone is where the float force generated by the kite cannot support the combined weight of the kite and the tether. It includes both the very large and very small angles of attack. The falling zone with very large angle of attack is often considered as the real cross
 (a)
(a) (b)
(b)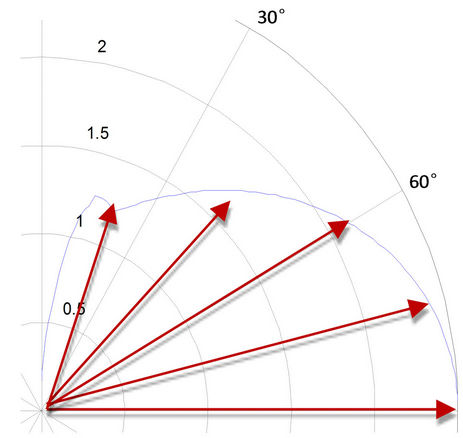 (c)
(c)
Figure 4. (a) Kite forces vs. angle of attack. (b) Drag to Pull ratio. (c) Tension for a weightless kite.
 (a) (b)
Figure 5. Power dome of a kite with unit length tether under unit wind speed blowing to right. (a) View from a general angle; (b) Top view. Assume same kite as used in Figure 4.
wind zone. In kite sports, the kite can briefly dip into this zone when it is moving along a certain pattern such as a circle. However, it is vulnerable to the error of flight control or a suddenly weakened wind. It is recommended to avoid this zone for a stable power or force generating kite.
The black park/reel-back zone is where a kite can float by itself yet with drastically decreased tension on the tether. It can be used to park or reel back a kite. The latter case is used when a pump or Yo-Yo style motion is chosen for power generation. That is, a kite can be released in the power zone. The strong tension will pull the tether, which in turn power the generator through a gearbox. When the tether reaches its length limit, the kite can be controlled to fly into the reel-back zone. Then an electric motor will reel the kite back. The tension in this zone is significantly smaller than that in the power zone, yet the aerodynamic force still maintains the shape of the kite and keeps it from falling. This will make it more stable to control the kite than in the falling zone.
4. Wind Tunnel Experiment
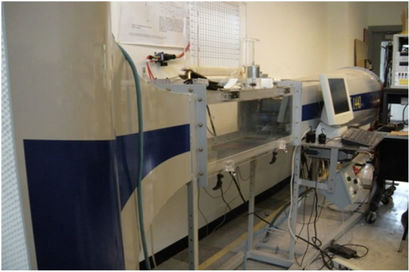
To verify the accuracy of the kite model, we conducted a wind tunnel test as described in Figure 6. The wind tunnel we used is Flotek 1440 made by GDJ Inc. (Figure 6(a)). It can generate wind speed up to 90 mph (40 m/s) in the observation chamber. The size of the chamber is 1 ft(W) × 1 ft(H) × 3 ft(L) while the total length of the wind tunnel is 12 ft (3 m) long. The force sensing unit (Figure 6(b)) is located at the back of the chamber behind a sealed window. It holds the kite model through a slim steel pin at front and uses two force transducers to measure the forces on X (horizontal) and Y (vertical) directions. Three plastic models (Figure 6(c)) are used. One is flat to model an airplane wing. One is warped to half circle, which is the case when a long soft kite is fully blown. The third one is a semi-circle that bent in half way between the flat and half circle. It is to model the semi-rigid kite with a backbone. All three models are designed by SolidWorks and generated by a 3D fast prototyping machine. The cross sections of them are all NACA 2412 profiles. The incoming velocity of the wind is controlled to be around 20 m/s.
It is evident that the theoretical calculation in Figure 4(a) is closely matched by the test result shown in Figure 6(d) provided that we choose same form drag coefficient CDL. The result also matches the wind tunnel test data extracted from the report by Klimes and Sheldahl [26] for NACA 0012 with Re = 10,000.
One interesting observation from the experiment is that the three models generate similar Float and Drift forces provide that they have equal projected or shadow areas on Y direction. It is seemingly contradict to the general teaching of a fluid textbook, where concave half circle comes with a higher CDL (~2.3) than that of a flat surface (~2). We contribute the effect to the narrow kite width compare to the overall length, i.e., the high aspect ratio of the models. For a concave half cylinder with infinite length, the incoming air stream has to go through the obstacle over the two curved ends. However, the stream can take the easier path to escape from the top and bottom parts of a short half cylinder just like passing over a flat plate.
One implication of the above observation is the calculation of total power generated by the kite. For the soft kite without backbone, its shape will become very close to a half circle under the strong wind. This will effecttively decrease more than one third (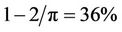 ) of the projected area compare to the original status when it is flat and fully expanded.
 (a)
(a)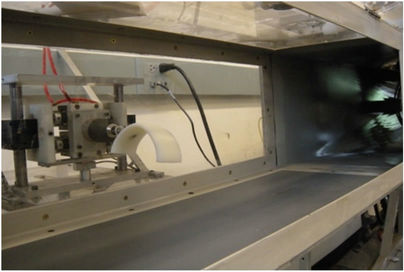 (b)
(b)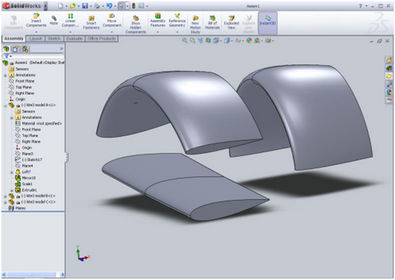 (c)
(c)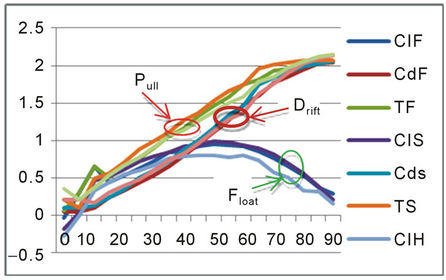 (d)
(d)
Figure 6. Aerodynamic forces vs. angle of attack. (a) The wind tunnel used in the test. (b) Model set up with measuring instruments. (c) Three models with different curvatures rendered in SolidWorks. One is flat, one is half circle, and one is in between. (d) Test results for Lift, Drag and Pull forces for equal projected areas. The angles of attack are changed at 5 degrees interval.
5. Summary and Conclusions
Tapping the higher altitude wind for renewable energy is gaining momentum in the recent years. The purpose of this paper is to provide some fundamental results on the force analysis of kites and serve as stepping stones for the future development of kite based power generating system.
The forces that are beneficial or useful to generate power in kites are different from those in airplanes or horizontal axial wind turbines. Therefore, we choose a different framework to describe the aerodynamics of kites. In this framework, the angle of attack of the kite can range from 0˚ to 90˚. The regular sense of lift and drag will not physically lift or hinder the flight of the kite like they do for an airplane. Therefore we defined the Float, Drift and Push forces to characterize the aerodynamic forces on the kite. However, they can be easily converted to lift and drag forces in conventional sense.
The Float and Drift forces vary greatly in the full range of angle of attack, as we have shown from both theoretical calculation and wind tunnel experiment. Their combined effect, or Push on the kite by the wind, grows in general (except right after the stall angle) with the climbing of angle of attack. We therefore divided the entire range of the angle of attack to Laminate, Transition and Turbulent ranges. Each range corresponds to the contribution of the resulted forces due to the head wind and transverse wind. By mapping the forces to the applications, we can further divide the flight of the kite to three zones: Power Zone, Falling Zone and Park/Reelback Zone. From this point, we can design the flight of a kite to obtain steady force, and then generate steady power or electricity.
As the next step, we are currently developing an innovative kite engine cycle based on this research. It will take advantage of the different power zones to maximize the power output of a kite from higher altitude wind.
REFERENCES
- A. D. Hansen and L. H. Hansen, “Wind Turbine Concept Market Penetration over 10 Years (1995-2004),” Wind Energy, Vol. 10, No. 1, 2006, pp. 81-97. doi:10.1002/we.210
- European Wind Energy Association. http://www.ewea.org/statistics/european
- Ministry of Industry and Information Technology of PRC. http://www.miit.gov.cn/
- US Energy Information Administration (EIA), Department of Energy. http://www.eia.doe.gov
- G. M. Joselin Herbert, S. Iniyan, E. Sreevalsan and S. Rajapandian, “A Review of Wind Energy Technologies,” Renewable & Sustainable Energy Reviews, Vol. 11, No. 6, 2007, pp. 1117-1145. doi:10.1016/j.rser.2005.08.004
- US Department of Energy, “20% Wind Energy by 2030, Increasing Wind Energy’s Contribution to US Electricity Supply,” 2008.
- “Trends in Renewable Energy Consumption and Electricity,” US Energy Information Administration, 2012.
- C. L. Archer and M. Z. Jacobson, “Spatial and Temporal Distributions of U.S. Winds and Wind Power at 80 m Derived from Measurements,” Journal of Geophysical Research, Vol. 108, No. D9, 2003, 4289. doi:10.1029/2002JD002076
- Joby Energy, Joby Energy Homepage. http://www.jobyenergy.com
- Makani Power, Makani Power Homepage, 2010. http://www.makanipower.com
- Magenn Power, Magenn Power Homepage, 2010. http://www.magenncom
- B. Lansdorp and W. J. Ockels, “Comparison of Concepts for High-Altitude Wind Energy Generation with Ground Based Generator,” NRE 2005 Conference, Beijing, 2005.
- M. Canale, L. Fagiano and M. Milanese, “KiteGen: A Revolution in Wind Energy Generation,” Energy, Vol. 34, No. 3, 2009, pp. 355-361. doi:10.1016/j.energy.2008.10.003
- D. L. Elliott, C. G. Holladay, W. R. Barchet, H. P. Foote and W. F. Sandusky, “Wind Energy Resource Atlas of the United States,” DOE/CH 10093-4, National Renewable Energy Laboratory (NREL), Golden, 1986. http://rredc.nrel.gov/wind/pubs/atlas/
- A. Ilzhofer, B. Houska and M. Diehl, “Nonlinear MPC of Kites under Varying Wind Conditions for a New Class of Large-Scale Wind Power Generators,” International Journal of Robust and Nonlinear Control, Vol. 17, No. 17, 2007, pp. 1590-1599. doi:10.1002/rnc.1210
- P. Williams, B. Lansdorp and W. Ockels, “Optimal Crosswind Towing and Power Generation with Tethered Kites,” Journal of Guidance, Control, and Dynamics, Vol. 31, No. 1, 2009, pp. 81-93. doi:10.2514/1.30089
- I. Argatov and R. Silvennoinen, “Energy Conversion Efficiency of the Pumping Kite Wind Generator,” Renewable Energy, Vol. 35, No. 5, 2010, pp. 1052-1060. doi:10.1016/j.renene.2009.09.006
- M. L. Loyd, “Crosswind Kite Power,” Journal of Energy, Vol. 4, No. 3, 1980, pp. 106-111. doi:10.2514/3.48021
- F. L. Ponta, J. J. Seminara and A. D. Otero, “On the Aerodynamics of Variable-Geometry Oval-Trajectory Darrieus Wind Turbines,” Renewable Energy, Vol. 32, No. 1, 2007, pp. 35-56. doi:10.1016/j.renene.2005.12.007
- S. J. Schreck and M. C. Robinson, “Horizontal Axis Wind Turbine Blade Aerodynamics in Experiments and Modeling,” IEEE Transactions on Energy Conversion, Vol. 22, No. 1, 2007, pp. 61-70. doi:10.1109/TEC.2006.889620
- S. Arya, “Introduction to Micrometeorology,” Academic Press, New York, 1988.
- A. S. Monin and A. M. Obukhov, “Basic Laws of Turbulent Mixing in the Atmospheric Surface Layer,” Trudy Geofiz, Instituta Akademii Nauk, SSSR (Proceedings of Geophysics Institute, National Academy of Science, SSSR), Vol. 24, 1954, pp. 163-187.
- R. H. Thuillier and U. O. Lappe, “Wind and Temperature Profile Characteristics from Observations on a 1400 ft Tower,” Journal of Applied Meteorology, Vol. 3, No. 3, 964, pp. 299-306. doi:10.1175/1520-0450(1964)003<0299:WATPCF>2.0.CO;2
- I. A. Pérez, M. A. García, M. L. Sánchez and B. de Torre “Analysis and Parameterisation of Wind Profiles in the Low Atmosphere,” Solar Energy, Vol. 78, No. 6, 2005, pp. 809-821. doi:10.1016/j.solener.2004.08.024
- J. D. Nicolaides, “Parafoil Wind Tunnel Tests,” University of Notre Dame, Notre Dame, 1971.
- R. E. Klimes and P. C. Sheldahl, “Aerodynamic Characteristics of Seven Symmetrical Airfoil Sections Through 180 Degree Angle of Attack for Use in Aerodynamic Analysis of Vertical Axis Wind Turbines,” Sandia National Laboratories, Albuquerque, 1981.