Energy and Power Engineering
Vol.5 No.1(2013), Article ID:26441,7 pages DOI:10.4236/epe.2013.51006
Mathematical Model and Experiment of Temperature Effect on Discharge of Lead-Acid Battery for PV Systems in Tropical Area
Department of Electrical Engineering, Faculty of Engineering, Rajamangala University of Technology Thanyaburi, Thanyaburi, Thailand
Email: *boonyang.p@en.rmutt.ac.th
Received September 30, 2012; revised November 4, 2012; accepted November 20, 2012
Keywords: Mathematic Model; Temperature Effect; Lead-Acid Battery
ABSTRACT
This paper presents Mathematical Model and Experiment of Temperature effect on Charge and Discharge of Lead-Acid Battery performance in PV system power supply. To test temperature effect on battery discharge cycles, a temperature range of tropical area from 25 - 60 degrees Celsius in a simulator is set up for testing. This temperature range is normally practical for battery usage. This allows the battery to determine the parameters of the battery quickly and high accurate. A Mathematical Model with MATLAB Program is written and constructed as block diagram using the equations of battery the parameters. By running program, the effects of various parameters are investigated. The results showed that time of discharge the battery is longer. Then, the experiment is set up by battery VRLA 12 V 20 AH. The results confirmed the mathematical model simulations.
1. Introduction
In present situation, energy demand is greatly increasing. Renewable energy is an alternative choice that can be substituted for future energy demand. For PV systems, the battery has important role in the process of storing electrical energy. The electrical energy is produced and used in the different tasks depend on the needs of users. Energy used in different places depends on the climate especially in tropical area. Thus the battery will be needed to maintain the system stability.
The temperature is a main factor for battery performance [1-5]. Therefore, it is interesting issue to be studied and analyzed for the property factor of discharge the battery. The mathematical model is constructed in order to study this issue. It is useful and can investigate to study the parameters of the battery quickly by simulation then the experiment will be implemented.
2. The Battery Equivalent Circuit
The equivalent circuit model of a lead-acid battery is a voltage source connecting with the internal resistance. (Figure 1) The circuit has a simple structure can be explained because the relationship between the voltage and resistance of the variable parts of the capacitor, state of charge (SOC) Temperature, and various elements of the battery parameters [6].
Voltage of lead-acid battery per cell produces 2 V. So battery 12 V consists of six cells, so that the next series. Voltage at the terminal will vary according to the conditions of work. And the concentration of the acid will be changed during the charge and discharge [7].
3. Mathematical Model and the Experiment
The experiment battery by mathematic model, have the following steps.
1) Study of the battery used in experiment, and research data from the various sources.
2) Designed the circuit test battery and block diagram of mathematical model using Math Lab program.
3) Create a mathematic model program.
4) Put the equation parameters in the mathematic model of battery.
5) Simulate program for recording parameters at the temperature from 25 to 60 degrees Celsius, and recording voltage and current Graph display.
6) Summary conclusions the simulation.
3.1. Block Diagram of Mathematical Model
Battery mathematical model is design by Math Lab. The
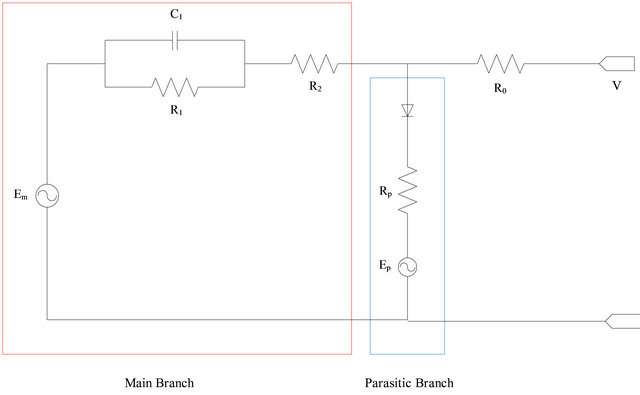
Figure 1. Battery equivalent circuit [8].
block diagram of the mathematical model is used as input current and temperature into the outputs which are voltage, Cell Temp, and the SOC [8,9] as shown in Figure 2.
3.2. Battery Equation for Mathematical Model
Battery equation for mathematic model will be using to simulate parameters included Main Branch, Parasitic Branch, Capacity, and Electrolyte Temperature [8-10].
Main Branch
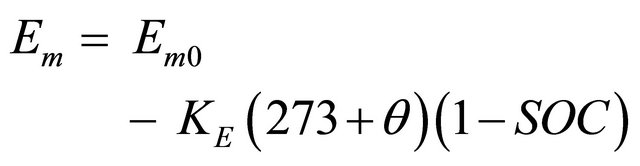 (1)
(1)
where :
Em = the open-circuit voltage (EMF) in volts;
Em0 = the open-circuit voltage at full charge in volts;
KE = a constant in volts/˚C;
θ = electrolyte temperature in ˚C;
SOC = battery state of charge.
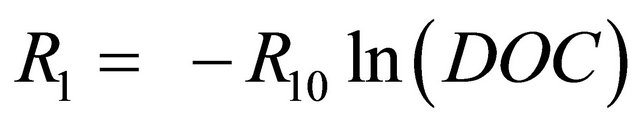 (2)
(2)
where:
R1 = a main branch resistance in Ohms;
R10 = a constant in Ohms;
DOC = battery depth of charge.
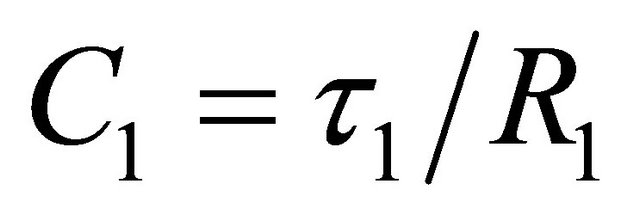 (3)
(3)
where:
C1 = a main branch capacitance in Farads;
![]() = a main branch time constant in seconds;
= a main branch time constant in seconds;
R1 = a main branch resistance in Ohms.
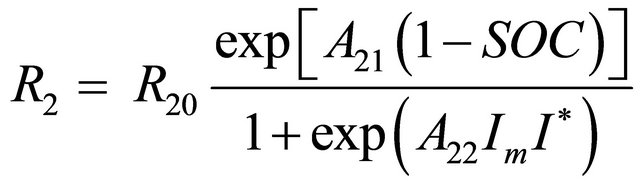 (4)
(4)
where:
R2 = a main branch resistance in Ohms;
R20 = a constant in Ohms;
A21 = a constant;
A22 = a constant;
SOC = battery state of charge;
Im = the main branch current in Amps;
I* = the a nominal battery current in Amps.
Parasitic Branch Current
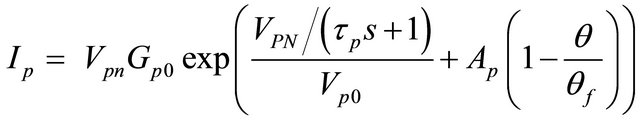 (5)
(5)
where :
Ip = the current loss in the parasitic branch;
Vpn = the voltage at the parasitic branch;
Gp0 = a constant in seconds;
 = a parasitic branch time constant in seconds;
Vp0 = a constant in volts;
Ap = a constant;
θ = electrolyte temperature in ˚C;
θf = electrolyte freezing temperature in ˚C.
Charge and Capacity
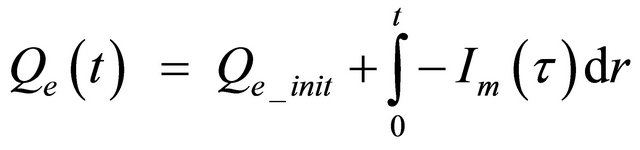 (6)
(6)
where:
Qe = the extracted charge in Amp-seconds;
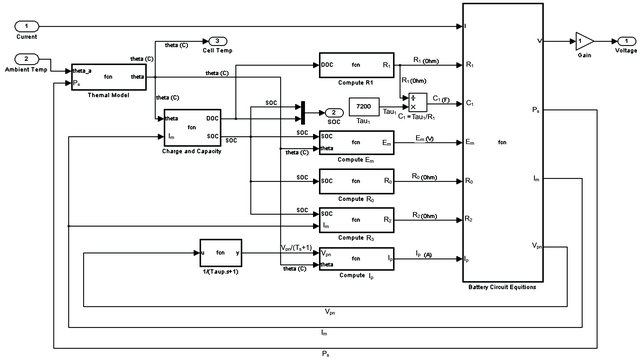
Figure 2. Block diagram of mathematic model [8].
Qe_init = the initial extracted charge in Amp-seconds;
Im = the main branch current in Amps;
τ = an integration time variable;
t = the simulation time in seconds.
 (7)
(7)
where:
Kc = a constant;
C0* = the no-load capacity at 0˚C in Amp-seconds;
Kt = a temperature dependent look-up table;
θ = electrolyte temperature in ˚C;
I = the discharge current in Amps;
I* = the a nominal battery current in Amps;
δ = a constant.
State of Charge and Depth of Charge
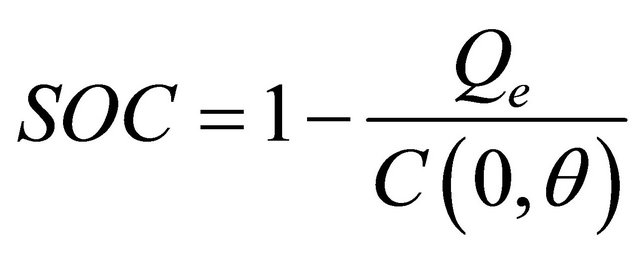 ,
,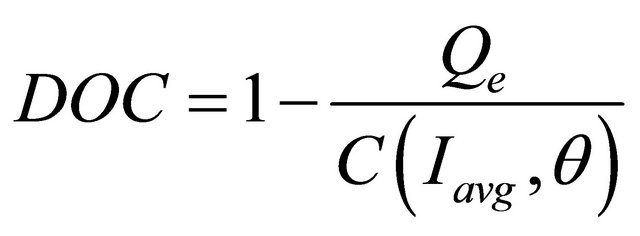 (8)
(8)
where:
SOC = battery state of charge;
DOC = battery depth of charge;
Qe = the battery’s charge in Amp-seconds;
C = the battery’s capacity in Amp-seconds;
θ = electrolyte temperature in ˚C;
Iavg = the mean discharge current in Amps.
 (9)
(9)
where:
Iavg = the mean discharge current in Amps;
Im = the main branch current in Amps;
![]() = a main branch time constant in seconds.
= a main branch time constant in seconds.
Electrolyte Temperature
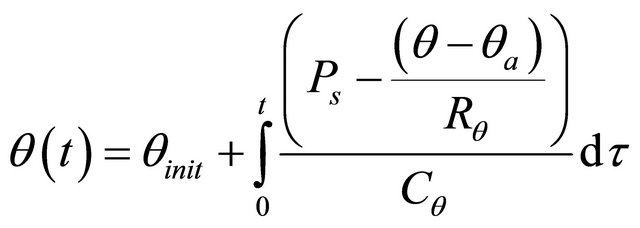 (10)
(10)
where :
θ = the battery’s temperature in ˚C;
θa = the ambient temperature in ˚C;
θinit = the battery’s initial temperature in ˚C, assumed to be equal to the surrounding ambient temperature;
Ps = the I2R power loss of R0 and R2 in Watts;
 = the thermal resistance in ˚C/Watts;
 = the thermal capacitance in Joules/˚C;
τ = an integration time variable;
t = the simulation time in seconds.
3.3. The Experiment
The experiment of lead-acid battery 12 V 20 AH is set up by using temperature control unit and a standard battery discharging system. The temperature in experiment is also controlled in the range of 25˚C - 60˚C. The discharged current and voltage are recorded by computer as shown in Figure 3.
4. Results
The simulation of mathematical model uses parameters of lead-acid battery 12 V, 20 AH. Discharge testing is by final voltage 9.6 V, 20 A, at temperatures ranging from 25˚C - 60˚C. The result of the simulation is shown as in Figure 4.
Figure 4 shows the results of simulation, battery discharge at 25˚C, it takes about 40 minutes to full discharge, at 30˚C is about 47 minutes, at 35˚C is about 50
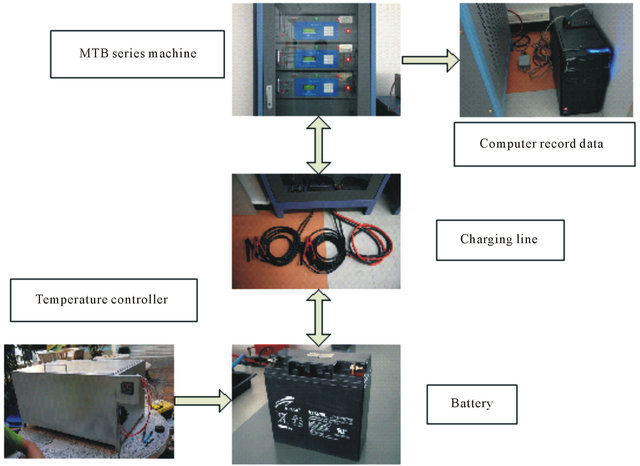
Figure 3. The experimental set up.
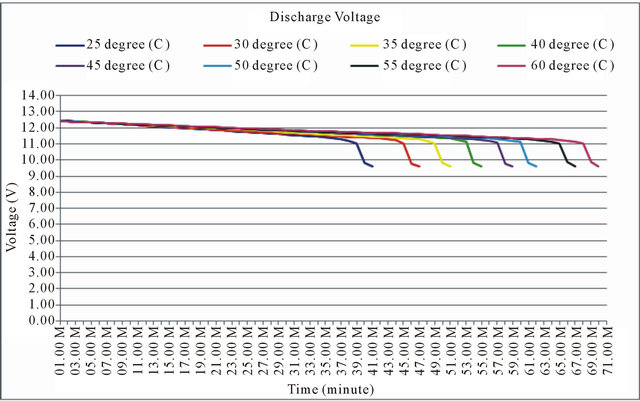
Figure 4. The simulation results of discharged voltage at 25˚C - 60˚C.
minutes, at 40˚C is about 55 minutes, at 45˚C is about 58 minutes, at 50˚C is about 62 minutes, at 55˚C is about 67 minutes, and at 60˚C is 70 minutes to full discharge. It indicates that the discharge time is longer if the temperature is higher.
The experimental results from the computer recorded data are shown as in Figure 5. The experimental results indicate the similarity to the simulation results. The discharge time was effected by the temperature precisely as on Table 1. From Figure 5, at the end of discharge time, the graph is up again because in the experiment even the system cut off the discharge circuit, the monitoring is still continuously real time recorded.
The experiment of mentioned lead-acid battery 12 V
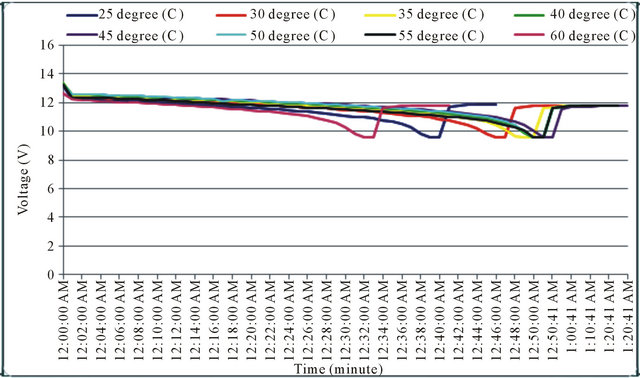
Figure 5. The experiment discharged voltage at 25˚C - 60˚C.
Table 1. Real time recorded discharge voltage at 25˚C - 60˚C.
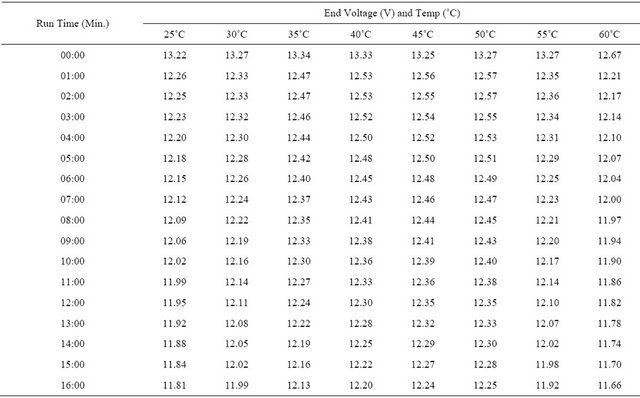
Continued
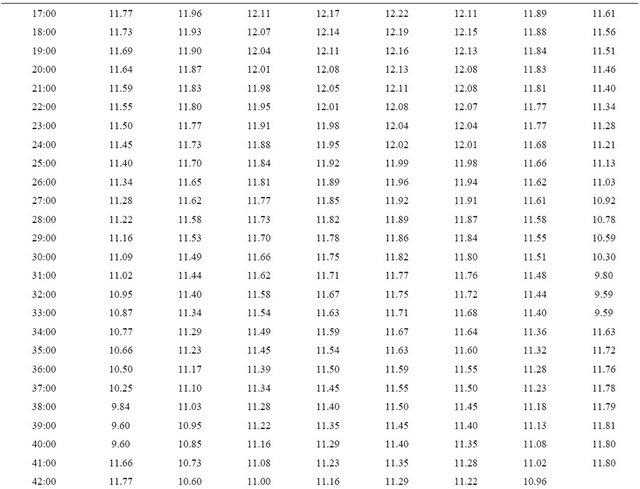
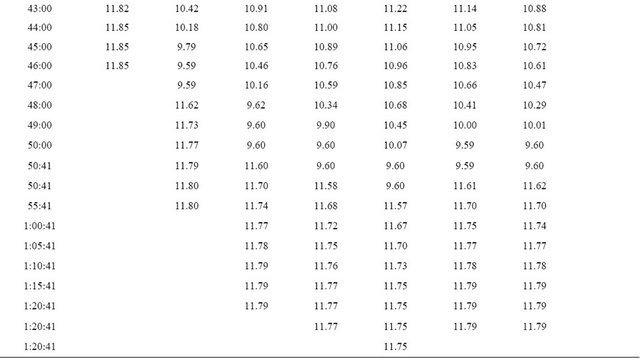
20 AH in Figure 5 is implemented by discharged current 20 A, at temperatures ranging from 25˚C - 60˚C. Battery discharge, at 25˚C, it takes about 40 minutes to full discharge. At 30˚C is about 45 minutes, at 35˚C is about 48 minutes, at 40˚C is about 49 minutes, at 45˚C is about 50 minutes, at 50˚C is about 49 minutes, at 55˚C is about 49 minutes, and at 60˚C is about 32 minutes to full discharge. It can be seen the similarity of the simulation and the experimental result however at the final experiment, the battery was broken as in Figure 6 then on the graph in Figure 5, at 60˚C, the performance of battery went down.
5. Conclusion
From the discharge results of lead-acid battery 12 V 20 AH, the mathematical model and the experiment have the similarity. By mathematical model discharged current 20 A, 9.6 V, the discharging time of the battery at 25˚C was 40 minutes and will also take longer time at higher temperature. At the temperature 60˚C, the discharging time was 70 minutes. The experiment of battery discharged current 20 A, 9.6 V, the discharging time of the battery at 25˚C was 40 minutes and will also take longer time at higher temperature. At the temperature 45˚C, the discharging time was 55 minutes. However at temperature above 45˚C, the battery was going to be broken. After 60˚C experiment, the battery was broken according to the temperature limitation shown as in Figure 6. Therefore even the battery capacity is longer when operates at higher temperature but the battery is able to stand only in the specific temperature. This study can lead to develop a suitable Battery Management Unit for PV system.
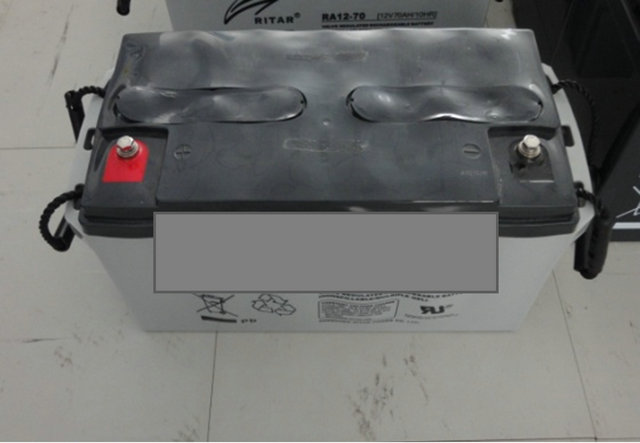
Figure 6. The broken battery after high temperature testing.
6. Discussions
Although the study results showed that the battery can work well when used at high temperatures however the battery should not be used at higher temperatures than its limitation because the battery will be destroyed at rated temperature [11-14], the result showed in Figure 6, comfirmed this issue.
REFERENCES
- D. Linden and T. B. Reddy, “Handbook of Batteries,” 3rd Edition, McGraw-Hill, New York, 2001.
- J. F. Manwell and J. G. McGwan, “Lead Acid Battery Storage Model for Hybrid Energy System,” Solar Energy, Vol. 50, No. 5, 1993, pp. 399-405. doi:10.1016/0038-092X(93)90060-2
- J. B. Copetti, E. Lorenzo and F. Chenlo, “A General Battery Model for PV System Simulation,” Progress in Photovoltaics Research and Applications, Vol. 1, No. 4, 1993, pp. 283-292. doi:10.1002/pip.4670010405
- D. Mayer and S. Biscaglia, “Modeling and Analysis of Lead Acid Battery Operation,” 11th International Telecommunications Energy Conference, 15-18 October, Vol. 2, pp. 23.3/1-23.3/6.
- C. Armenta-Deu, “Capacity Effects on the Determination of the State-of-Charge in Lead-Acid Cells,” Renewable Energy, Vol. 4, No. 2, 1994, pp. 249-256. doi:10.1016/0960-1481(94)90011-6
- M. Ceraolo and S. Barsali, “Dynamical Models of LeadAcid Batteries: Implementation Issues,” IEEE Transactions on Energy Conversion, Vol. 17, No. 1, pp. 16-23.
- H. Bode, “Lead-Acid Battery,” John Wiley & Sons, New York, 1977, p. 381.
- R. A. Jackey, “A Simple, Effective Lead-Acid Battery Modeling Process for Electrical System Component Selection,” The Math Works, Inc., Natick, 2007. doi:10.4271/2007-01-0778
- R. Jackey, “Automotive Electrical System Simulation and Control,” The Math Works, Inc., Natick, 2009.
- N. Moubayed, J. Kouta, A. El-Ali, H. Dernayka and R. Outbib, “Parameter Identification of the Lead-Acid Battery Model,” 33rd IEEE Photovoltaic Specialists Conference, Beirut, 11-16 May 2008, pp. 1-6.
- G. W. Vinal, “Storage Battery,” 4th Edition, John Wiley & Sons, New York, 1955, p. 437.
- L. Semyonov, “Storage Batteries Maintenance Manual,” Mir, Moscow, 1967, p. 271.
- D. Linden, “Handbook of Batteries,” 2nd Edition, McGrawHill, New York, 1995, pp. 2.1-24.15.
- Dynasty Division, “VRLA Battery Life Expectancy and Temperature,” C&D Technologies, Inc., Blue Bell.
NOTES
*Corresponding author.