Energy and Power Engineering
Vol. 4 No. 3 (2012) , Article ID: 19018 , 9 pages DOI:10.4236/epe.2012.43020
The New Brazilian Power Quality Standard and a Low Cost Device Meter
1Electrotechnical Department, Federal Institute of Espirito Santo, Vitoria, Brazil
2Department of Electrical Engineering, Federal University of Espirito Santo, Vitoria, Brazil
3Department Electrical Engineering, Federal University of Uberlandia, Uberlandia, Brazil
Email: *guilhermecolnago@gmail.com
Received February 15, 2012; revised March 10, 2012; accepted March 30, 2012
Keywords: Power Quality Standard; Power System Monitoring; Brazilian Electrical System
ABSTRACT
This paper presents an overview about the new Brazilian Power Quality Standard and provides a low cost device PQ meter, developed and implemented to assist the national campaign to assess the Brazilian power quality indices, unknown until now. This work contributes with the search of a low cost devices PQ meter for a cost sensitive market, and introduces the new Brazilian Power Quality Standard to the international community.
1. Introduction
The purpose of this paper is introducing the new Brazilian Power Quality Standard and a low cost power quality device meter in accordance with the Standard.
The Power Quality (PQ) area never has been regulated in Brazil. Few years ago the Brazilian Electrical Regulatory Agency (ANEEL) published a Standard [1] to regulate PQ area. Due to absence of enough knowledge about the PQ indices of Brazilian Electric System, the Standard has defined a national campaign of PQ measurement to monitor and assess the main PQ indices of the system.
As the Brazilian Electric System has great size and complexity to achieve this goal a large number of device meters will be necessary. However, the market is cost sensitive and the devices meter must have a low cost. To contribute with this, a low cost device meter was developed and implemented to assist the campaign. It is presented here.
2. Brazilian Electrical System—Past Review
Until the mid-90s, the Brazilian Electrical System was almost entirely state owned utilities. From generation to commercialization, electricity had been provided by the state as a monopoly. There has been inefficiency: “In this scenario, customers, especially those outside the large load centers, depended on the ‘good will’ of utilities to be provided with a proper electricity service” [2] . At that time there was no PQ Standard, which was introduced only at the end of last decade.
In 1995 the Brazilian Electric System went through a deep restructuring process, started with a privatizing program. The main steps were: introduction of competetion in generation, “deverticalization” of utilities, open access to the transmission and distribution grid, and introduction of retail competition.
The ANEEL was created in 1996 to regulate the national electric system. In 1998, the ANEEL created the National Manager of the Electric System (ONS) to coordinate and control the generation and transmission of electricity. A few years ago, the ANEEL defined the regulation to distribution grids labeled “PRODIST” and the ONS has created the “Grid Procedures” to regulate the generation and transmission grids. The relation between agents can be roughly understood as shown in Figure 1.
The PRODIST has a chapter fully dedicated to PQ issues, the PQ Standard [1] , which defines the PQ indices and reference values. It was published at the end of 2008 by ANEEL—the “Grid Procedures”, from ONS, has a chapter about PQ issues [3] too.
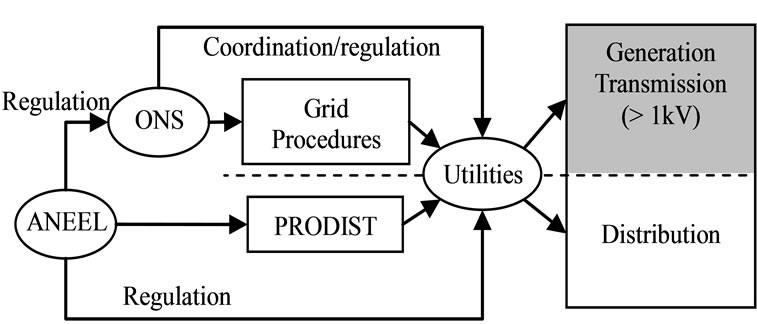
Figure 1. Relation between agents and system.
It is worth mentioning about the PQ Standard, that even after four revisions, there are limits, methods and protocols to compute some PQ indices without complete definitions. The reason could be the lack of enough knowledge about the actual PQ status of the electrical system. The ANEEL has started a national monitoring campaign in order to evaluate the real conditions of the system. As the Brazilian market is cost sensitive, low cost equipment meters are strongly needed to permit a large scale use.
3. Brazilian Power Quality Standard
The PQ Standard is divided in Quality of Service (QoS), concerned with Sustained Interruptions (Reliability), and Quality of Product (QoP), concerned about the steady state and transitory phenomena. It is divided in:
• Steady State Voltage;
• Power Factor;
• Harmonic Voltage;
• Voltage Unbalance;
• Voltage Fluctuation;
• Voltage Sag (Dip) and Swell;
• Frequency Variation.
3.1. Basic Procedures of Measuring
The Brazilian PQ Standard is based on classical concepts. The steady state measurement is performed in intervals of 10 minutes (as suggested in [4] too) at points of common coupling. For each interval the indices are computed and stored.
The measurement period is one week or 1008 intervals (168 h). However the period can be longer in case of transitory phenomena events. An interruption or sag/ swell voltage occurrence within an interval will invaliddate it. The invalid intervals must be substituted by subsequent intervals, until the final number of valid intervals becomes equal to 1008—the final number increases (the invalid are not erased). As these disturbances interfere significantly in steady state, so they are “eliminated” and singly analyzed.
The Figure 2 illustrates the measurement process. In this example an interruption occurs between intervals 3 and 4. The two intervals are invalidated (gray) and substituted by intervals 5 and 6. Two more valid intervals were needed to complete 1008 intervals, so the total number of intervals measured will be 1010. At the end of the measurement period, the results are analyzed and the final indices computed.
The intervals are subdivided in periods, or time “windows”, which are the basic time of the measurement. Each window is processed with specific equation to result in an index. As the fundamental frequency in Brazil is 60 Hz, the windows comprise 12 cycles (0.2 s). The interval is composed of 3000 windows. The device meters must be based on digital processing and the minimal requirements are: resolution of 12 bits, 16 samples/cycle and 1% error. It is worth mentioning that Standard specifies the window and minimal requirements just to Steady State Voltage section [1] .
3.2. Steady State Voltage
This index permits the analysis of the long-time voltage variation. First, the rms voltage of each time window is processed. At the end of 10 minutes the rms voltage value of the interval is computed. As soon as the measurement period is finished all the intervals (points) are classified into a set of voltage ranges, as indicated in Figure 3. The ranges are divided into Adequate, Precarious, and Critic voltage [1] . The limit values depend of nominal voltage of the grid. These values are defined in the Standard.
The number of points in precarious and critic ranges results in relative duration of precarious voltage index DRP in Equation (1) and relative duration of critic voltage index DRC in Equation (2) [1] .
 (1)
(1)
 (2)
(2)
where nlp and nlc are the number of precarious and critic points, respectively, and 1008 ate the valid points.
If DRP or DRC value is high the utility can be punished. The usual limits for voltage below 1 kV are about:
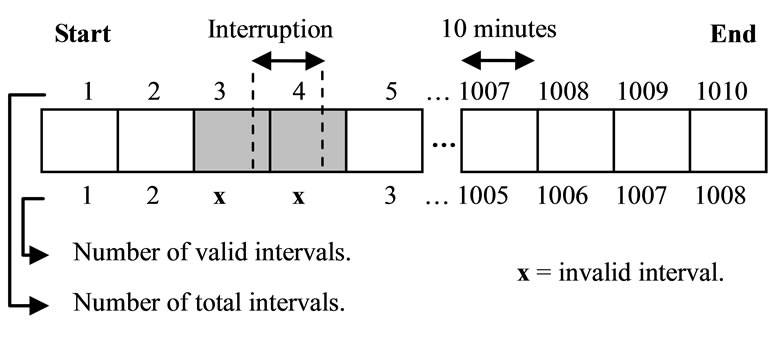
Figure 2. Measurement process.
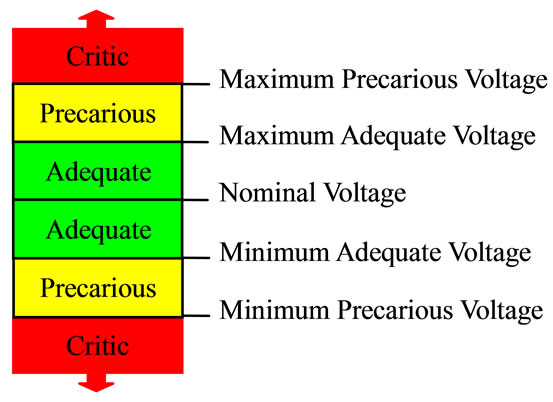
Figure 3. Voltage ranges for measurement analysis.
• Adequate 0.913 pu ≤ V ≤ 1.047 pu;
• Precarious 0.858 pu ≤ V < 0.913 pu or 1.047 pu < V ≤ 1.102 pu;
• Critic V < 0.858 pu or V > 1.102 pu.
3.3. Power Factor
The power factor (pf) of an interval is computed with Equation (3). The minimum power factor allowed is 0.92, inductive or capacitive, in accordance with specific regulation.
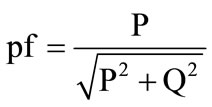 (3)
(3)
where P is real power and Q is reactive power.
3.4. Harmonic Voltage
The Standard requires the monitoring of all harmonic voltage distortion up to 25th components, at least [1] . For each window are computed the total harmonic distortion THD, in Equation (4), and the individual harmonic distortion IHDh, in Equation (5).
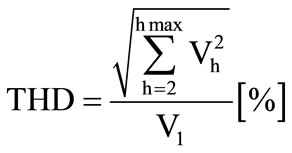 (4)
(4)
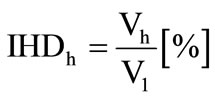 (5)
(5)
where Vh is the voltage amplitude of order “h” component, V1 is the voltage amplitude of fundamental component, and “hmax” the highest component monitored.
The components are calculated with Fast Fourier Transform (FFT) that computes the spectrum of the voltage signals. This index is an exception and the window time has a period of 8 cycles of the network—it is necessary to sample a 2n points and apply the FFT. The other indices have 12 cycles.
Although the THD and IHD window values are well defined, there is no definition on how to compute the final indices of interval—the average value from THD and IHD, for example.
The Standard suggests reference values for electrical planning. After the national campaign, the limits will be defined. For low voltage (≤1 kV) the maximum THD is 10% and the maximum IHDh are presented in Table 1.
3.5. Voltage Unbalance
The Voltage Unbalance Factor (VUF) is computed with CIGRE method in Equation (6).
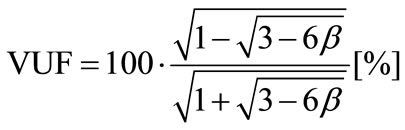 (6)
(6)
where β is given by Equation (7).
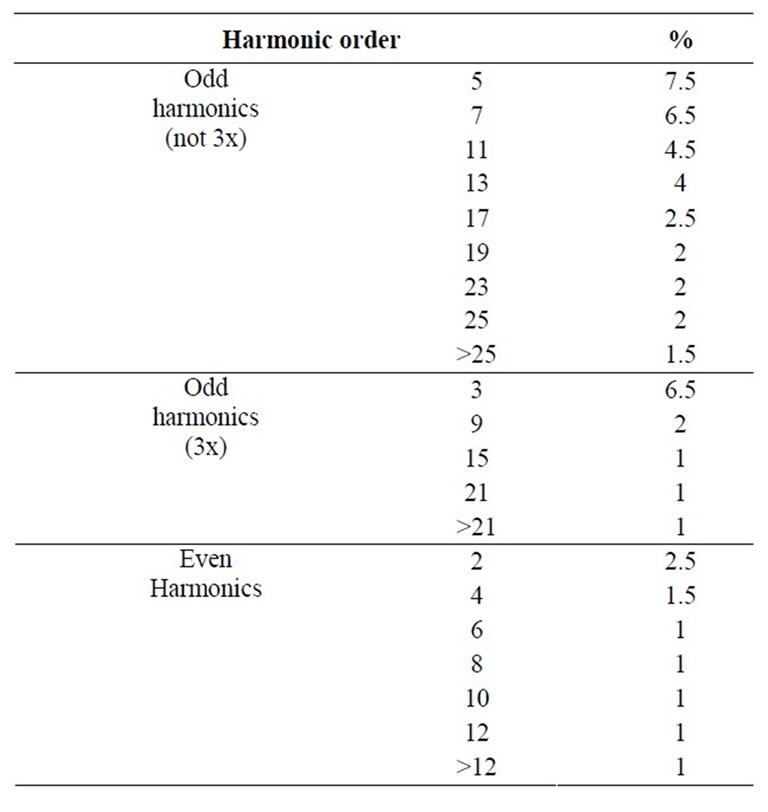
Table 1. Reference levels for IHDh.
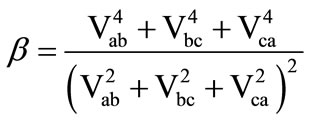 (7)
(7)
and Vab, Vbc, and Vca are the rms line voltage from “ab”, “bc” and “ca” phases, respectively.
The rms line voltage and VUF are computed for all windows. However, the Standard does not definite how compute the final indices of interval as well as there is no reference value for low voltage (≤1 kV).
3.6. Voltage Fluctuation
The Standard specifies the use of the IEC Flickermeter methodology [5] . First, the short-time flicker severity (Pst) and long-time flicker severity (Plt) must be calculated. The Pst is computed from the time-at-level statistics obtained from Flickermeter and computed with Equation (8).
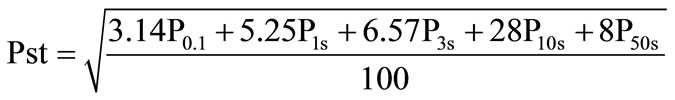 (8)
(8)
where P0.1, P1, P3, P10, and P50 are the flicker levels exceeded for 0.1, 1, 3, 10, and 50% of the time during the observation period. The suffix s indicates that the smoothed value shall be used—[5] has a complete description.
The Plt is computed with some Pst values in Equation (9).
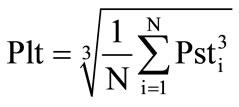 (9)
(9)
where Psti is the Pst of the interval “i” and “N” is the total of intervals to computes the Plt. Mostly N is equal to 12 intervals of 10 minutes (2 hours).
The PQ Standard defines that indices are computed by statistical methods. When a day of measurement is completed the percentile PstD95% has to be computed. It is the Pst level which was exceeded only by 5% of all Pst values computed. When the week of measurement is completed, the percentile PltW95% has to be computed. It is the Plt level which was exceeded only by 5% of all Plt values computed. The final indices will be the PltW95% and the biggest PstD95% computed on week.
The Standard suggests reference ranges [1] , which are divided in Adequate, Precarious, and Critic, as presented in Table 2. The limits have to be adjusted by a transfer factor (TF) for different coupling point. The TF depends on the bus and grid characteristics.
3.7. Voltage Sag and Swell
The voltage sag (dip) is the reduction of rms value, and the voltage swell is the increasing of the rms value. To simplify the terminology, these phenomena will be called STVV, from Short-time rms Voltage Variation. Intervals with STVV occurrences shall be invalidated.
The Standard classifies STVV in accordance to the rms variation and duration [1] , as in Table 3. There is a third phenomenon included, called Interruption. It can be roughly understood as “severe” sag. It must not be confused with an outage (Sustained Interruptions). The STVV index is used to analyze the grid performance, but there is no reference value.
The Figure 4 shows the STVV limits, where the dotted lines are the limit values. The Duration is the time that the voltage remains irregular. If the times T1, T2, or T3 are longer than 3 minutes, the ev ents will no longer be classified as a STVV—they will classified in Steady State. For example, if the minimum rms value is 0.7 pu (for all phases) it will be classified as a STVV Sag. If the minimum is 0.08 pu, it will be a STVV Interruption. The
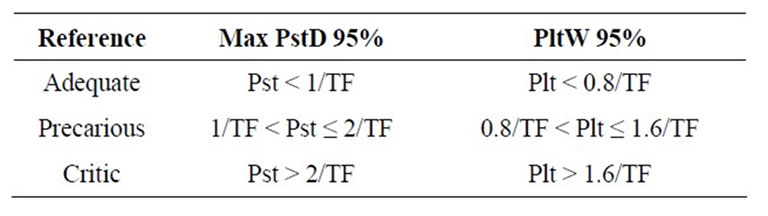
Table 2. Reference levels for voltage fluctuation.
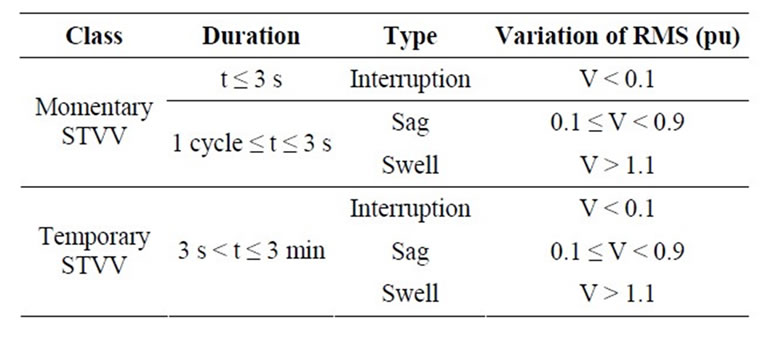
Table 3. STVV classification.
period between the start and the end of STVV will determine the event as Momentary or Temporary. In the occurrence are registered the worst rms value and period of occurrence.
3.8. Frequency Variation
The frequency of Brazilian Electrical System is 60 Hz. In steady state conditions, the system must work at 60 Hz ± 0.1 Hz. The Table 4 presents some frequency deviation limits for a disturbance situation [1] .
3.9. Sustained Interruptions (Reliability)
The Sustained Interruptions is defined as an outage (or rms voltage < 0.1 pu) longer than 3 minutes. In Figure 4 if the time T3 is equal to 4 minutes, the event is classified as an Interruption instead a STVV Interruption. It invalids an interval.
The Interruption is a QoS index and presents information about the reliability of the grid. It produces indices that are based in statistical analysis of the number of occurrences, the frequency of outages, and their duration. The limits depend on the regional characteristics. As this index existed before the Standard was created, regulation is precise about it.
4. A Power Quality Monitoring System
As explained, the size of the Brazilian Electrical System and cost sensitive market imply on the use of economically viable PQ meter devices. A Monitoring System was developed and implemented based on a low cost device.
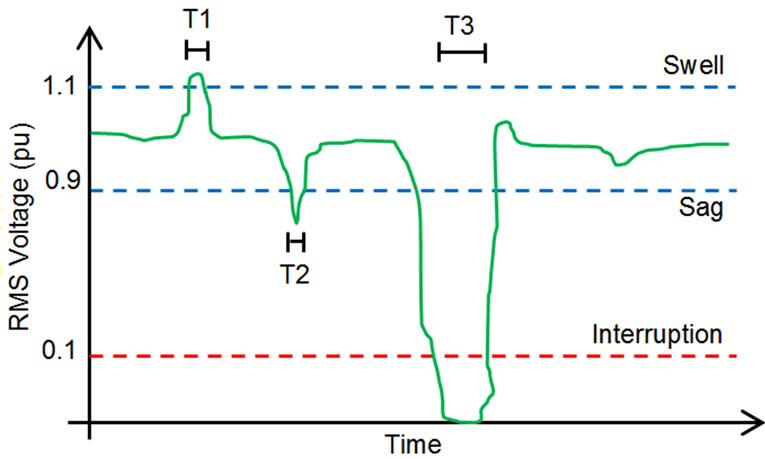
Figure 4. STVV events.
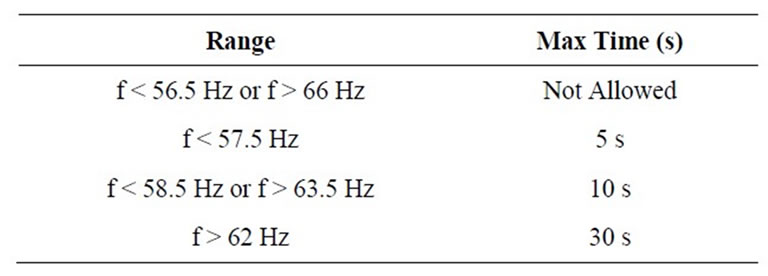
Table 4. Maximum periods of deviation.
To achieve the low cost goal, a cheap hardware was designed to perform the heavy signal processing, the firmware was simplified and optimized as much as possible to comply with Standard.
The Figure 5 shows the basic diagram of the Monitoring System. Each PQ meter device (PQM) is installed in a specific point of common coupling and computes the PQ indices of the electrical system. The data produced is locally stored and sent to a database after the measurement period. The channel used is the GPRS network and Internet.
The database is in a Remote Server (RS) at the Utility. The RS manages the monitoring system and remotely controls all PQMs, an important characteristic. After installed, the devices do not need local human support, and operational costs are reduced. Another characteristic is that outages warnings can be done in real-time, for example.
5. The Power Quality Meter Device
Preceding the publication of the PQ Standard, the Brazilian market had been analyzed. Three basic different types of PQM had been identified. The first had been the “low cost” type, which could comply with the future standard. The two others, “medium” and “high cost” types, that could comply with the standard, but were too expensive for large scale use. In this scenario, the Utility proposed a Research & Developing project to develop a low cost PQM and a Monitoring System.
It is worth mentioning that the Standard is specifically concerned about Voltage Quality—almost all indices are about voltage. The aim is the voltage regulation. The effective PQ monitoring implies in voltage and current monitoring. The current monitoring is not complex, but the “control” of the current is. Unlike the voltage, the current is tightly dependent on the load. Attempt to regulate or control the load “behavior” is a hard work—it is enough to imagine the common consumers’ regulation. Nowadays it is necessary to supervise if the voltage supplied by the utilities is adequate. Regulate the current quality is not the actual purpose of the Brazilian PQ Standard.
The second point is that the Standard is very concerned about harmonic voltage, voltage unbalance, voltage fluctuation, and STVV. These phenomena have never
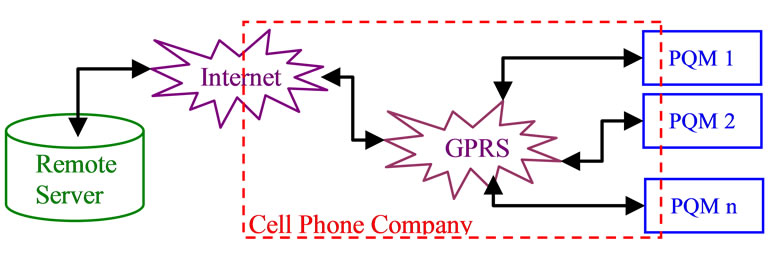
Figure 5. General diagram of the monitoring system.
been fully monitored and regulated in Brazil, so some indices do not have reference limits. The ANEEL manifests great interest in this monitoring.
Observed these points, the proposed PQM has two basic purposes: comply with the main points of the Standard and have a low cost, making it viable to be used in a large scale on the distribution network (<1 kV). With low cost device should be able to reduce the economic impact of monitoring actions. The proposed PQM had a cost of some hundred dollars, while other viable options had a cost of one or more thousand dollars.
The hardware and firmware proposed were carefully analyzed to achieve the objectives. Based in the low cost aim and the great interest of PQ Standard on harmonic voltage, voltage unbalance, voltage fluctuation, and STVV monitoring—phenomena not well known in the national grid—the capacities and functionality of the PQM were defined. The Utility and developers did not include the Power Factor and Frequency Variation indices on PQM —both indices, unlike the others, are well monitored by Utility. A reducing of processing charge and cost was achieved. The frequency is stable parameter and already well monitored. The power factor is also monitored, but the decision to not include it is the high cost of the hardware. To monitor this index is necessary to measure currents. High precision current transformers have a high cost. A market research was done and the cost of PQ meter with current measurement capability could be 150% higher than the one without such feature. The final cost was reduced significantly and the main requirements of PQ Standard were attended, since the most important indices are monitored.
5.1. Device Meter Overview
An overview of the PQM can be done with the basic block diagram, shown in Figure 6. It is composed of eight basic blocks, where the Block 1 is the power source and Block 2 has a battery to supply the device during outages or severe sags.
The blocks 3, 4, and 5 perform the analog signals processing: reducing of ac voltage, filtering (anti-aliasing), and sampling, respectively. The PQM uses low cost microcontrollers (Block 6) from dsPIC33 family, from Microchip. One microcontroller does the signal processing and indices computation, and the other one stores the processed data, manages the device and communication. The implemented device has a SD memory card (Block 7) and a cellular module (Block 8) to perform the communication with RS at Utility (Block 9).
The PQM was developed to be used in a three-phase star grounded system with nominal phase voltage of 127 V. However, it can work in single or two phase circuit and different nominal voltage too.
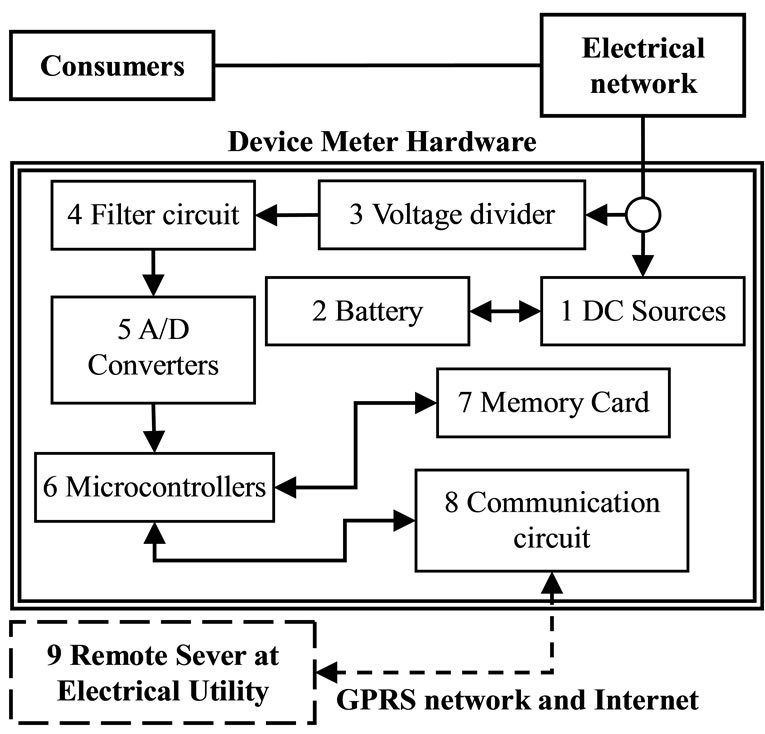
Figure 6. General block diagram of the device meter.
The fundamental sampling rate of the PQM is 128 samples/cycle (7.68 kHz), which allow it to measure up to the 25th harmonic voltage component. Internally, it is done a digital undersampling to compute the other indices, to reduce the processing load. The Fluctuation voltage is processed with 16 samples/cycle and the others with 64 samples/cycle.
5.2. Indices
It is worth mentioning that the methods to compute all the indices are not completely defined. In fact, the methods to compute the windows are clear, however the method to compute the final value of some indices are not defined (e.g. Voltage Unbalance). The developers and Utility have adopted some appropriated methods while the Standard is refined. In the future, a simple firmware update will reprogram the devices.
The Steady State Voltage, STVV, and Interruption (Sustainable) indices are processed in accordance with the Standard. The STVV does not have reference values, but the developed user application uses ITI Curve [6] to allow the final user to analyze the severity of STVV. The Voltage Unbalance does not have a specific method to compute the final index. It was defined to compute the maximum and medium VUF for each interval. Daily and Weekly can be processed the VUFD95% and VUFW95%, respectively—like Voltage Fluctuation indices. The Harmonic voltage indices have the same problems. Due to purpose of the campaign, it was defined the “worst case” option: the maximum THD and IHDh are computed in the intervals. The percentile can be used daily and weekly.
The Standard determines the use of the IEC Flickermeter [5] 1 for the Voltage Fluctuation index. The computation is well defined, but it was somewhat hard to implement—due to the natural complexity of Flickermeter implementation [7] . Figure 7 presents the IEC Flickermeter digitalized.
The diagram is similar to the original [5] . The original Block 1, now called Block A, was modified and has integrated circuits to do the voltage adjustment, filtering and sampling. The other blocks remain similar, but digitalized with all filtering, math, and statistical operation being done by a microcontroller.
The basic idea of the Flickermeter is try to simulate the lamp-eye-brain system (blocks B, C, and D) and measure the flicker level (block E) produced by voltage fluctuation.
6. Comments about Standard
Something else shall be mentioned about the new Brazilian Standard. An important point is that some indices do not have a complete methodology of computation or limits. What is the reason since international standards (as [4,5,8,9]) suggest these methodologies?
The answer could be the own system. The Brazilian Electrical System has a great size, diversity, and, of course, complexity. The system works in several complex environments, topologies, climates, seasons, and regional demands and agents with intrinsic characteristics. Add to this the absence of a data base about PQ phenomena. The result could be prudence in defining methodologies or
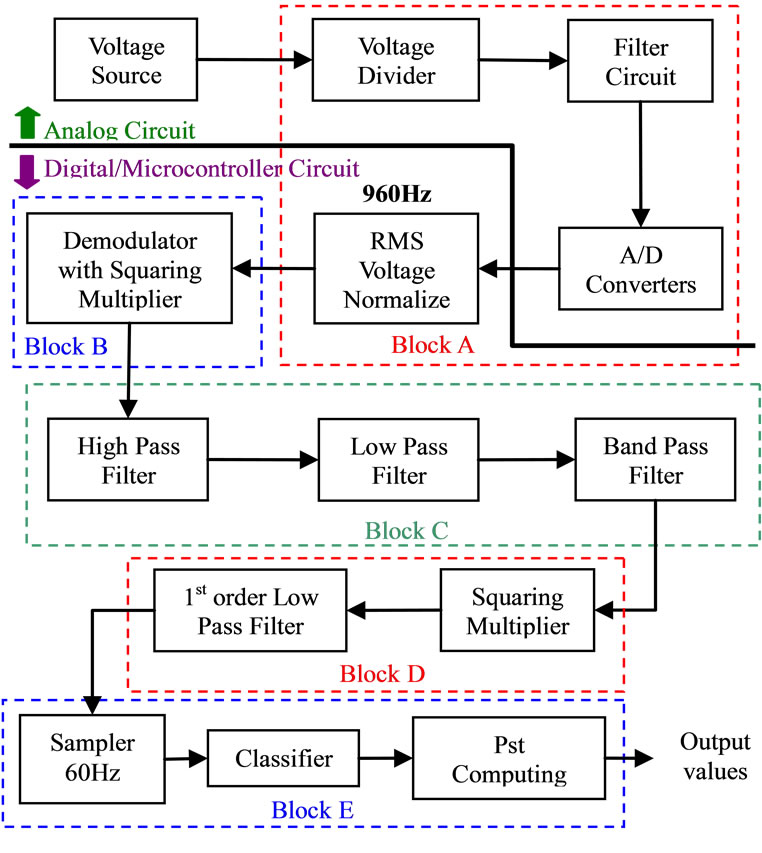
Figure 7. Digitalized IEC flickermeter.
limits.
A system without enough knowledge must be regulated carefully, or severe and inadequate limits could be defined, which can be unachievable, resulting in a lot of problems. The South Africa could be an example. In 1996 it was published the first version of the national standard NRS 048 [10] . A severe regulation had been determined for Voltage Dip (sag) and had resulted in troubles. The framework had been modified significantly and the standard was revised and republished again in 2003 with a more “comprehensive” regulation [11] . The Voltage Dip was rewritten highlighting significant impact of environment in dips and the complexity to define the limits. It was suggested reference limits and that the voltage dip performance should be negotiated [12] .
Based in South Africa example, it could be said that ANEEL is being “careful” with the Standard—the national campaign to survey the system is a proof. The undefined methodologies can make the campaign flexible allowing tests of assorted set of methods, instead of only one method.
On the other hand, this could produce a lot of incoherent results by monitoring systems, delaying the releasing of a more precise standard. And due to the “weak” limits, the PQ could suffer of negligence in this period.
7. Results
To verifying the performance of the developed PQM a set of laboratory and practical tests were performed. To evaluate the PQM comparatives tests were performed with others device meters. It was used two class A type device meters: the “Portable Power Sentinel 933A” and the “Power Sentinel GPS-Synchronized 1133A”, from Arbiter System.
The two devices and the PQM have important differences about the processing, but the admeasurements were very useful to validate the performance of the PQM.
The Table 5 presents the Pst comparative results between the device 1133A and the PQM. This test was done with a voltage fluctuation of 110 changes/minute and about 0.85% amplitude of modulation. The relative error is presented too.
The Figure 8 presents more tests realized to verify the performance of PQM. Voltage fluctuations were produced and applied to the devices, which measured instantaneous flicker values. The instantaneous flicker is the output of block D and represents the human flicker sensation and is used on Pst computation. The perceptibility threshold is about 1pu of instantaneous flicker.
The disturbances were generated with frequency modulation between 0.5 Hz to 40 Hz and specific magnitudes to produce about 1pu on block D output. The bars presents the instantaneous flicker results from reference device (dark) and PQM (white). The line is the relative error (right axis) of PQM results with reference device values. The relative error from instantaneous flicker is below ±5%—in accordance with the standard.
The Table 6 presents the comparative voltage unbalance results between the device 933A and the PQM.
The Table 7 presents the comparative harmonic results between the 933A and the PQM. A Power Function Generator was used to produce preprogrammed voltage wave forms with specific harmonic components.
The second line presents the rms voltage measured by the two meters as well as the third line shows the THD% measurement. How could be observed the PQM calculates about the same values indicated by of the 933A. The first column informs the harmonic component; the second has the admeasurements values of 933A; the third presents the PQM results.
The STVV index there is no limits or reference. This information shall be defined after the measurement campaign. However, the ITI Curve was used at the user application as a reference to present the STVV occurrence. The Figure 9 shows the ITI curve and some occurrences.
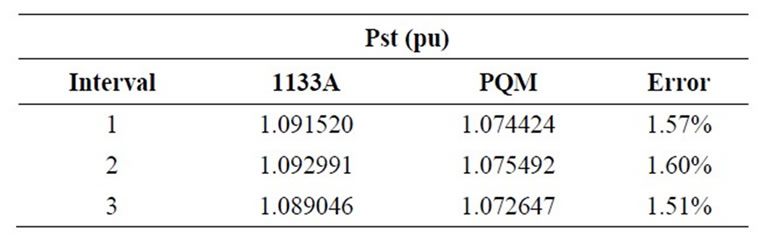
Table 5. Pst comparative results.
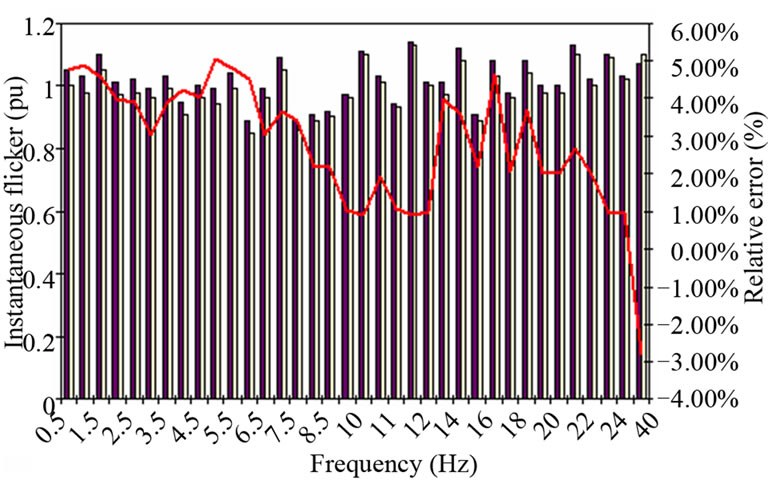
Figure 8. Instantaneous flicker and error.
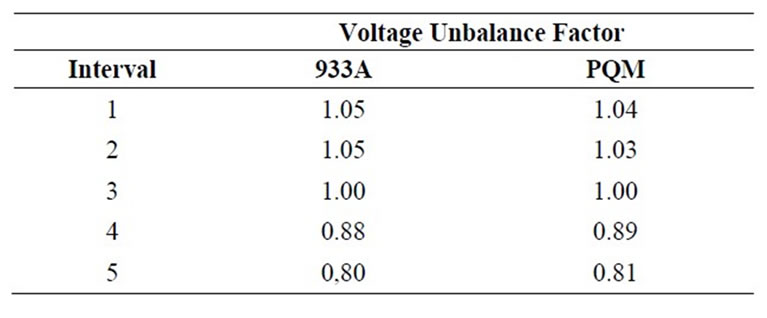
Table 6. Comparative voltage unbalance results.
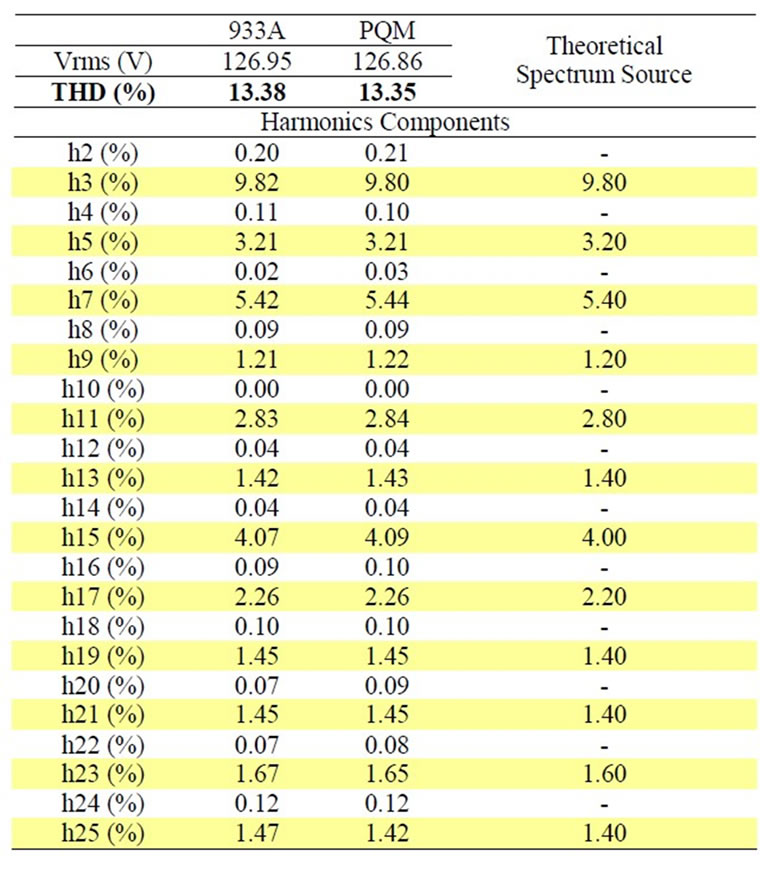
Table 7. Comparative harmonic results.
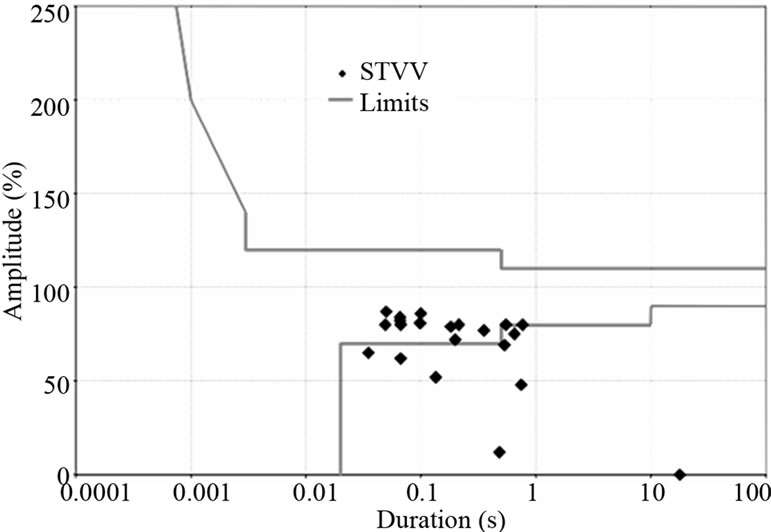
Figure 9. ITI Curve and STVV occurrences.
8. Conclusions
The first contribution of this work is the development of a low cost device meter to assist the national measurement campaign. The performed tests have indicated that the PQM has reached the purposes: 1) the main requirements of the new Brazilian PQ Standard; 2) the low cost. As said before, high cost device meters may be economically impracticable at Brazilian market. So, with just the necessary resources, could be develop a device that attend the standard and can reduce the economic cost of the large national measurement campaign. It is worth mentioning that the PQM is flexible to future standard’s revision. It just needed update the firmware of the device.
Another contribution was the introduction of the new Brazilian PQ Standard to the international community. The PQ area is growing around the world and the interchange of experience is very important to the development of electrical systems.
9. Acknowledgements
This work results from Research & Development project supported by EDP ESCELSA/ANEEL. The authors would like to thank the Utility EDP ESCELSA for the financial support.
REFERENCES
- Agência Nacional de Energia Elétrica, “Procedimento de Distribuição de Energia Elétrica—PRODIST—Módulo 8: Qualidade da Energia Elétrica,” 2011. http://www.aneel.gov.br/arquivos/PDF/M%C3%B3dulo8_Revis%C3%A3o_4.pdf
- M. De Oliveira, I. Camargo, F. Figueiredo and J. E. Tanure, “Power Quality Standards in Brazil during Electricity Industry Restructuring Program,” IEEE Power Engineering Society Summer Meeting, Edmonton, 18-22 July 1999, pp. 124-128. doi:10.1109/PESS.1999.784333
- Operador Nacional do Sistema Elétrico, “Procedimentos de Rede—Submódulo 25.6—Indicadores de qualidade de energia elétrica,” 2010. http://www.ons.org.br/download/procedimentos/modulos/Modulo_25/Subm%C3%B3dulo%2025.6_ Rev_1.1.pdf
- International Electrotechnical Commission, “IEC Testing and measurement techniques—Power Quality Measurement Methods Standard, 61000-4-30, Ed. 2.0,” IEC, Geneva, 2008.
- International Electrotechnical Commission, “IEC Testing and measurement techniques: Flickermeter, Standard 61000-4-15, Ed. 1.1,” IEC, Geneva, 2003.
- Information Technology Industry Council, “ITI (CBEMA) Curve Application Note,” Technology Committee 3 (TC3) of the ITI Council, Washington DC, 2000.
- M. Piekarz, M. Szlosek, Z. Hanzelka, A. Bien, A. Stankiewicz and M. Hartman, “Comparative Tests of Flickermeters,” 10th International Conference on Harmonics and Quality of Power, Rio de Janeiro, 6-9 October 2002, pp. 220-227. doi:10.1109/ICHQP.2002.1221436
- International Electrotechnical Commission, “IEC Testing and measurement techniques—General guide on harmonics and Interharmonics Measurements and instrumentation, for Power Supply Systems and equipment Connected Thereto, Standard 61000-4-7, Ed. 2.0,” IEC, Geneva, 2002.
- IEEE, “IEEE Recommended Practices for Monitoring Electric Power Quality, Standard 1159-2009,” Institute of Electrical and Electronics Engineers, New York, 2009.
- South African Bureau of Standards, “Electricity Supply— Quality of Supply—Part 1: Minimum standards NRS 048-2, Ed. 1,” SABS, Witbank, 1996.
- R. G. Koch, P. Balgobind and E. Tshwele, “New developments in the management of Power Quality Performance in a regulated environment,” 6th IEEE Africon Conference in Africa, Pretoria, 2-4 October 2002, pp. 835-840. doi:10.1109/AFRCON.2002.1160022
- South African Bureau of Standards, “Electricity Supply— Quality of Supply—Part 2: Voltage characteristics, compatibility leves, limits and Assessment Methods, NRS 048-2, Ed. 2,” SABS, Witbank, 2003.
NOTES
1The standard was revised recently. It introduced more information to permit a proper digital implementation of flickermeter and a new set of test protocol. However, the concept remains the same.