World Journal of Condensed Matter Physics
Vol.4 No.2(2014), Article ID:45834,9 pages DOI:10.4236/wjcmp.2014.42013
Diffusion Coefficient in Silicon Solar Cell with Applied Magnetic Field and under Frequency: Electric Equivalent Circuits
Amadou Diao1, Ndeye Thiam1, Martial Zoungrana2, Gokhan Sahin1, Mor Ndiaye1, Grégoire Sissoko1
1Laboratory of Semiconductors and Solar Energy, Physics Department, Faculty of Science and Technology, University Cheikh Anta Diop, Dakar, Sénégal
2Laboratory of Environment Materials, Physics Department, Training and Research Unit in Applied Science, University of Ouagadougou, Ouagadougou, Burkina Faso
Email: gsissoko@yahoo.com
Copyright © 2014 by authors and Scientific Research Publishing Inc.
This work is licensed under the Creative Commons Attribution International License (CC BY).
http://creativecommons.org/licenses/by/4.0/


Received 30 January 2014; revised 4 March 2014; accepted 21 March 2014
ABSTRACT
In this paper, a theory on the determination of the diffusion coefficient of excess minority carriers in the base of a silicon solar cell is presented. The diffusion coefficient expression has been established and is related to both frequency modulation and applied magnetic field; the study is then carried out using the impedance spectroscopy method and Bode diagrams. From the diffusion coefficient, we deduced the diffusion length and the minority carriers’ mobility. Electric parameters were derived from the diffusion coefficient equivalent circuits.
Keywords:Solar Cell, Magnetic Field, Frequency Modulation, Diffusion Coefficient

1. Introduction
Photovoltaic conversion is ensured by a solar cell whose conversion efficiency depends on the nature of the semiconductor structure, its manufacturing technique and processes. This study deals with the minority carriers’ diffusion coefficient in the base. Several studies have been done on the minority carriers’ diffusion coefficient [1] [2] and diffusion length [3] -[6] in the goal of improving solar cells quality for a better conversion efficiency. Authors determine the diffusion coefficient that depends on both frequency modulation and magnetic field in one hand or combine local diffusion length calculated from the laser beam induced current and bulk lifetime obtained from microwave-detected photo conductance decay measurements in another hand. They also determine the diffusion length using electroluminescence emission measurements of multicrystalline silicon solar cells at near-bandgap wavelengths which coincides with the one calculated from spectrally quantum efficiency methods. Our study consists on the determination of the diffusion coefficient by using the DRÜDE model, when the solar cell is under a polychromatic illumination in frequency modulation and under an applied magnetic field. Expression of the diffusion coefficient is established as a complex number according to the frequency and the magnetic field. This implies that capacitive and/or inductive effects in the diffusion phenomena directly are related to the solar cell behavior. Considering the minority carrier diffusion in the base as an electric phenomenon; an electric-diffusion analogy, by means of the Bode and Nyquist diagrams [7] of the diffusion coefficient, is pointed out. Equivalent circuits of the diffusion coefficient are then deduced and the related parameters are calculated.
2. Theory
On Figure 1, a simplified n+-p-p+ silicon solar cell type [8] [9] is presented:
Where d is the thickness of the emitter and H0 the thickness of the solar cell.
The solar cell illumination, in frequency modulation, generates electron-hole pairs in the base where a constant magnetic field ![]() is applied perpendicularly [10] [11] . The excess minority carriers in a p-base (electrons) are subjected to the electrical force
is applied perpendicularly [10] [11] . The excess minority carriers in a p-base (electrons) are subjected to the electrical force![]() , magnetic force
, magnetic force  and frictional force
  during their diffusion in the crystal lattice. By use of the basic dynamics principle applied on electrons, one obtains Equation (1):
 (1)
(1)
with ;
;  and
and 
where mn, q and tn are respectively the effective mass of the electron, the elementary charge and the average lifetime of electrons in the base; ![]() is the electron velocity;
is the electron velocity; ![]() the electric field resulting from the base polarization.
the electric field resulting from the base polarization.
Equation (1) can be rewritten as follows:
 (2)
(2)
The electron velocity and the electric field can be expressed as:
 and
and
 (3)
(3)
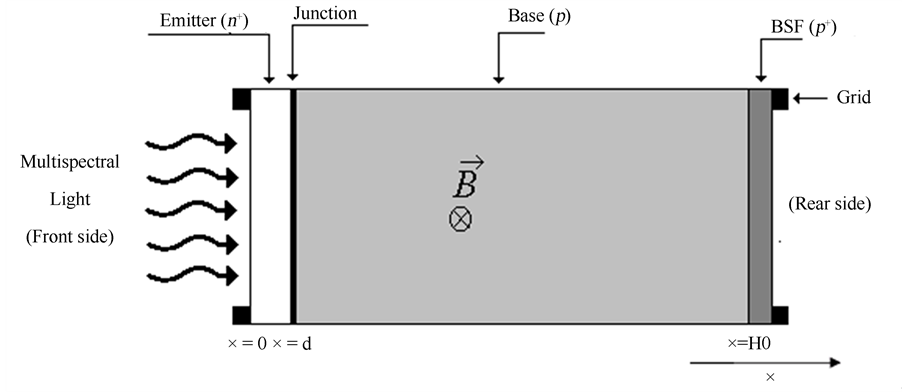
Figure 1. An n+-p-p+ type of a silicon solar cell scheme under applied magnetic field.
where ![]() and
and  are respectively the velocity and the electric field amplitudes; t is the time,
  is the angular frequency and
  the frequency; i is the imaginary number (i2 = ‒1).
Substituting Equation (3) in Equation (2), one obtains:
 (4)
(4)
where  is the electron intrinsic mobility Let pose:
  and
and 
Equation (4) becomes:
 (5)
(5)
In one hand, using the vectorial product for each members, and in the other hand the scalar product of ![]() and
and , one gets:
 (6)
(6)
and
 (7)
(7)
where
 and
and
 (8)
(8)
Finally 
given that
 and
and
 (9)
(9)
we substitute Equations (6)-(9) in Equation (5), and we get:
 (10)
(10)
Equation (10) can be rewritten in the form:
 (11)
(11)
with  the cyclotron frequency [12] [13] of the electron.
The term  is the parallel component of the electron velocity and is neglected because magnetic energy according to this direction is neglected.
So Equation (11) becomes:
 (12)
(12)
We rewrite Equation (12) as:
 (13)
(13)
where  is the complex mobility of electrons according to the frequency modulation and the magnetic field.
From the Einstein relation  , where KB is the Boltzmann constant, T the absolute temperature and
 the complex diffusion coefficient of the electrons according to the magnetic field and the frequency modulation [14] [15] , we obtain:
where Dn is the intrinsic diffusion constant of the electrons without applied magnetic field.
 (14)
(14)
3. Diffusion Coefficient Profile
Figure 2 presents the diffusion coefficient of the minority carriers in base of the solar cell in 3D view according to the frequency modulation and the applied magnetic field:
One can observe that diffusion coefficient decreases with the frequency modulation; effectively, for higher frequency, carriers cannot relaxate so that they cannot move properly in the material. Given that diffusion coefficient expresses the ability of carriers to diffuse in the material, frequency modulation increase leads to a direct decrease of the diffusion coefficient. Diffusion coefficient increases with magnetic field until a certain magnetic field value Bo from which the diffusion coefficient decreases. This maximum value of the diffusion coefficient corresponds to a resonance phenomenon. Above Bo, minority carriers trajectories are more and more incurvated so that they cannot move in the base: this corresponds to a decrease of the diffusion coefficient with magnetic field. The decrease of the diffusion coefficient while increasing magnetic field and frequency modulation degradates the intrinsic properties of the solar cell by affecting basically the energy bands.
4. Bode Diagram of the Diffusion Coefficient
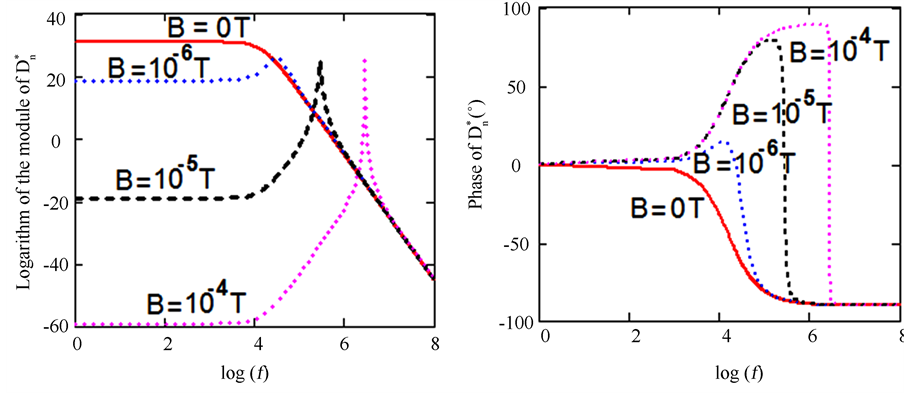
The logarithm of the diffusion coefficient module and its phase are represented according to the logarithm of the frequency for various magnetic fields on Figure 3.
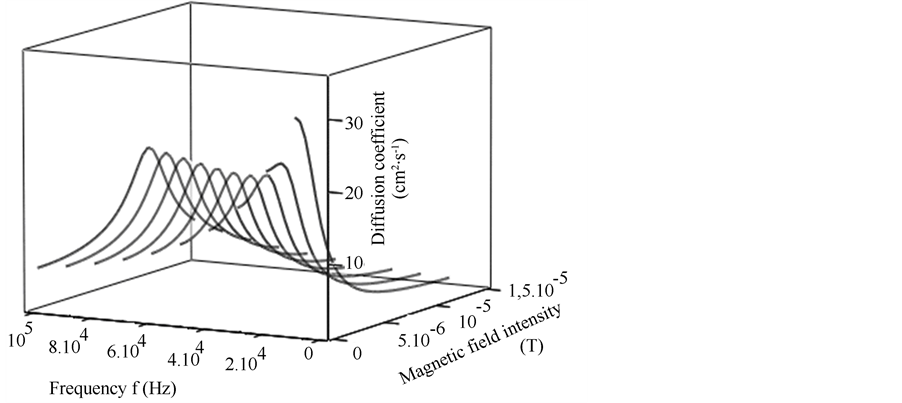
Figure 2. Diffusion coefficient module versus frequency modulation f and magnetic field intensity B.
On can note on Figure 3(a)) that without magnetic field, the diffusion coefficient doesn’t depend significantly on frequency in quasi steady state (ωtn = 1) and the associated phase (Figure 3(b)) is practically zero: carriers diffusion follows their generation in the base of the solar cell. For higher frequencies, the diffusion coefficient decreases very markedly: the diffusion process is slowed down compare to the generation process; this fact is confirmed by the phase plot with a negative value of the phase. The solar cell behaves as a capacitance from the point of view of the diffusion process. The application of a magnetic field induces resonance peaks of the diffusion coefficient for higher frequencies. This resonance phenomenon arises when the frequency modulation is equal to the cyclotron frequency (the electron frequency on its orbit in the presence of an applied magnetic field). For these higher frequencies, the phase increases to a maximum positive value until a certain frequency corresponding to the resonance phenomenon. Above that frequency, the phase decreases rapidly to a negative value for the remaining frequencies (Figure 3(b)). We then have three different behaviors of the solar cell from the point of view of the diffusion phenomenon:
• a resistive effect with phase practically zero.
• an inductive effect from the cut-off frequency to the resonance frequency.
• a capacitive effect above the resonance frequency.
5. Nyquist Diagram and Equivalent Circuit Model of the Diffusion Coefficient
We, now, present the Nyquist diagram of the diffusion coefficient with the associated electrical model for three magnetic field values:
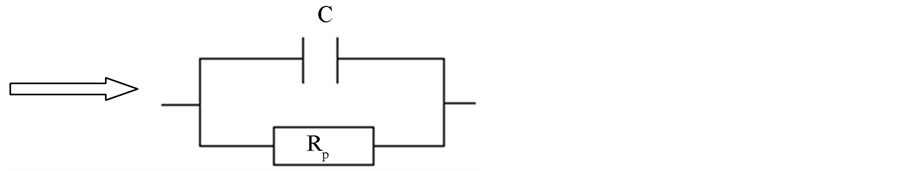
1) B = 0 T The obtained Nyquist diagram is presented on Figure 4(a); this diagram shows three particular points that correspond to: ,
,  and
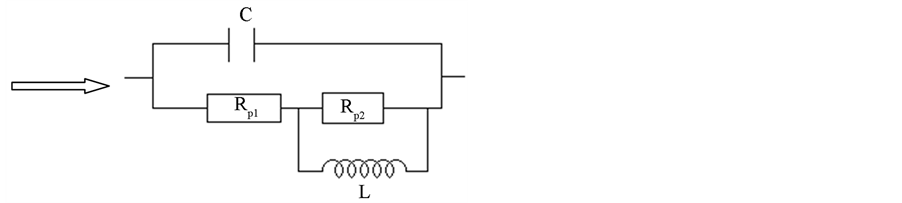
and . This plot is semi-circular with only negative values of Im(D*). Given also the Bode diagram, the associated electric equivalent circuit can be presented as on Figure 4(b) [16] - [21] . We have a resistance RP in parallel with a capacitance C; RP characterizes resistive effect in the diffusion process (low frequency) and C characterizes capacitive effect at high modulation frequencies;
  corresponds to the cut-off frequency.
2) B = 10‒6 T
Figure 5(a) and Figure 5(b) show respectively the Nyquist diagram and the equivalent circuit of the diffusion coefficient:
The Nyquist diagram has a spiral shape with positive and negative imaginary part. There are now, five particulars frequencies: ,
,  ,
,  ,
,  and
and . Frequencies
 ,
,  and
and  correspond to resistive behavior of the diffusion process;
  and
and  represent two cut-off frequencies where
 ![]() is the beginning of the resonance and
is the beginning of the resonance and ![]() the end of the resonance. From
the end of the resonance. From  to
to 
 (a) (b)
Figure 3.  and its phase versus log(f).
 (a)
(a)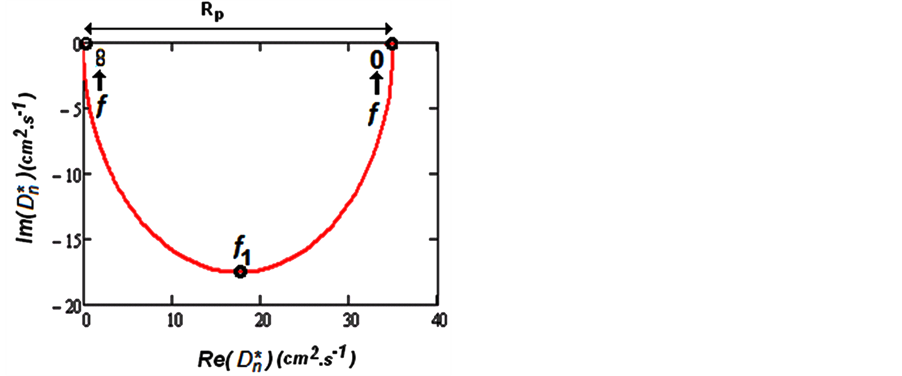 (b)
(b)
Figure 4. Nyquist diagram and electric equivalent circuit of ![]() without magnetic field. (a) Nyquist diagram; (b) Electric equivalent circuit.
without magnetic field. (a) Nyquist diagram; (b) Electric equivalent circuit.
 (a)
(a)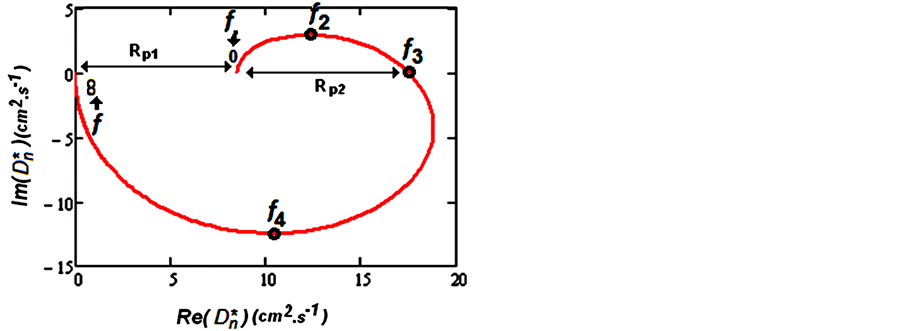 (b)
(b)
Figure 5. Nyquist diagram and electric equivalent circuit of ![]() for B = 10−6 T. (a) Nyquist diagram; (b) Electric equivalent circuit.
for B = 10−6 T. (a) Nyquist diagram; (b) Electric equivalent circuit.
we have a resistive and an inductive behavior where both resistance RP2 and inductance L are in parallel while from  to
to  we have now resistive and capacitive behavior. The corresponding equivalent circuit is presented on Figure 5(b).
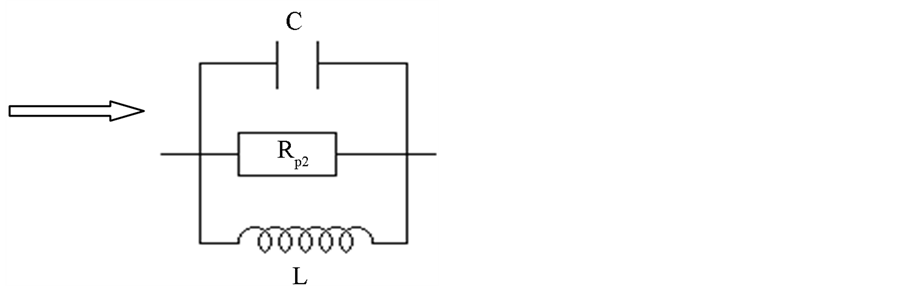
3) B = 10‒4 T In Figure 6(a) Nyquist plot (Figure 6(a)) and an equivalent circuit model (Figure 6(b)) are presented:
We can see the Nyquist plot is a circle shape. We have both inductive and resistive behavior from  to
to ; from
  to
to  it is a resistive and capacitive behavior. We have here, resistance RP2, inductance L and capacitance C in parallel. The corresponding electric equivalent circuit is given on Figure 6(b).
We note that resistance RP1 is now neglected because the photogenerated minority carriers do not diffuse any more under the effect of the intense applied magnetic field.
6. Results and Discussion
Without any magnetic field, the diameter of the semi-circle obtained is equal to RP [17] [18] which is a resistance associated to the steady state diffusion process characterized by Dn. The corresponding diffusion length is deduced from the relation . Through the Einstein relation, the minority carriers’ mobility is also calculated. From the time-constant
  supposed equal to the average lifetime of the minority carriers, we can deduce the capacitance C.
When a magnetic field is applied, resistances RP2 and RP1, mobility, the diffusion length and the inductance L, are given according to the two cases that followed:
1) 1st case: in the frequency range , the resistance RP2 is equal to the semi-circle diameter associated to the time-constant
  corresponding to inductive effect; this enables us to deduce the inductance L.
2) 2nd case: in the range , corresponds the time-constant
 . When the diameter
  of the semi-circle is determined, the value of RP1 can be deduced, leading us to the capacitance C and the diffusion length. By using the Einstein relation, we deduce the minority carriers’ mobility in the base.
Based on these relations, we present on the Table 1 the results obtained:
When the magnetic field increases, the resistance RP can be subdivided in two others as RP1 and RP2. For a given magnetic field from 10−6 to 10−4 T, RP1 decreases (the diffusion of the carriers is slowed down) while RP2 increases (carriers recombination in volume is higher). The diffusion length and the mobility are reduced, compared to their initial values (without magnetic field): the photogenerated minority carriers in the base, having no enough time to diffuse, recombine immediately. Consequently, the intrinsic properties of the solar cell are damaged; this implies a poor cell quality. The capacitance decreases since there are few minority carriers stored in volume and that the inductive phenomena occur with increasing magnetic field.
 (a)
(a)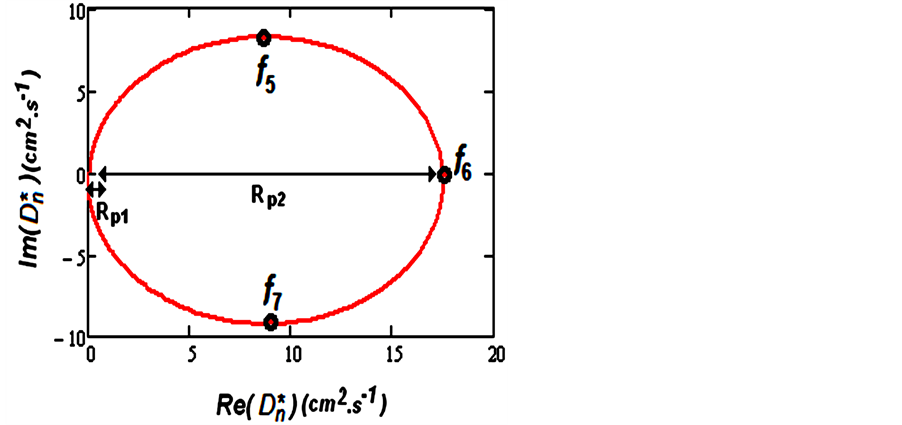 (b)
(b)
Figure 6. Nyquist diagram and electric equivalent circuit of ![]() for B = 10‒4 T. (a) Nyquist diagram; (b) Electic equivalent circuit.
for B = 10‒4 T. (a) Nyquist diagram; (b) Electic equivalent circuit.

Table 1. Electric and intrinsic parameters for![]() .
.
7. Conclusion
A theoretical study has been made on the diffusion coefficient of a crystalline silicon solar cell under polychromatic illumination, in frequency modulation and under magnetic field. With an applied magnetic field, the diffusion of the minority carriers is slowed down because carriers are deviated from their normal trajectories on side surfaces of the base; what involves a poor quality solar cell. Bode and Nyquist diagrams show that the resonance effect appears with the frequency and the magnetic field which change the cell behavior: capacitive, resistive and inductive. For the frequencies and magnetic fields, we propose electrical equivalent circuits of the diffusion process.
References
- Sontag, D., Hahn, G., Geiger, P., Fath, P. and Bucher, E. (2002) Two-Dimensional Resolution of Minority Carrier Diffusion Constants in Different Silicon Materials. Solar Energy Materials & Solar Cells, 72, 533-539. http://dx.doi.org/10.1016/S0927-0248(01)00202-1
- Dieng, A., Zerbo, I., Wade, M., Maiga, A.S. and Sissoko, G. (2011) Three-Dimensional Study of a Polycrystalline Silicon Solar Cell: The Influence of the Applied Magnetic Field on the Electrical Parameters. Semiconductors Sciences and Technologies, 26, Article ID: 095023. http://dx.doi.org/10.1088/0268-1242/26/9/095023
- Schinke, C., Hinken, D., Bothe, K., Ulzhöfer, C., Milsted, A., Schmidt, J. and Brendel, R. (2011) Determination of the Collection Diffusion Length by Electroluminescence Imaging. Energy Procedia, 8, 147-152. http://dx.doi.org/10.1016/j.egypro.2011.06.116
- Hollenhorst, J.N. and Hasnain, G. (1995) Frequency Dependent Hole Diffusion in InGaAs Double Heterostructures. Applied Physics Letter, 67, 2203-2205. http://dx.doi.org/10.1063/1.115103
- Misiakos, K., Wang, C.H., Neugroschel, A. and Lindholm, F. (1990) Simultaneous Extraction of Minority-Carrier Transport Parameters in Crystalline Semiconductors by Lateral Photocurrent. Journal of Applied Physics, 67, 321-332. http://dx.doi.org/10.1063/1.345256
- Mandelis, A. (1989) Coupled ac Photocurrent and Photothermal Reflectance Response Theory of Semiconducting P-N Junctions. Journal of Applied Physics, 66, 5572-5583. http://dx.doi.org/10.1063/1.343662
- Lathi, Bhagwandas Pannalal: Signals, Systems and Controls. Intext Educational Publisher, New York, 1973-1974.
- Hübner, A., Aberle, A.G. and Hezel, R. (2001) 20% Efficient Bifacial Silicon Solar Cells. 14th European Photovoltaic Solar Energy Conference, Munich, 2001, 1796-1798.
- Meier, D.L., Hwang, J.-M. and Campbell, R.B. (1988) The Effect of Doping Density and Injection Level on Minority-Carrier Lifetime as Applied to Bifacial Dendritic Web Silicon Solar Cells. IEEE Transactions on Electron Devices, ED-35, 70-78.
- Madougou, S., Made, F., Boukary, M.S. and Sissoko, G. (2007) I-V Characteristics for Bifacial Silicon Solar Cell Studied under a Magnetic Field. Advanced Materials Research, 18-19, 303-312. http://dx.doi.org/10.4028/www.scientific.net/AMR.18-19.303
- Thiam, Nd., Diao, A., Ndiaye, M., Dieng, A., Thiam, A., Sarr, M., Maiga, A.S. and Sissoko, G. (2012) Electric Equivalent Models of Intrinsic Recombination Velocities of a Bifacial Silicon Solar Cell under Frequency Modulation and Magnetic Field Effect. Research Journal of Applied Sciences, Engineering and Technology, 4, 4646-4655.
- Kittel, C. (1972) Introduction à la Physique de l’état Solide. 284-285.
- Cardona, M. (1969) Modulation Spectroscopy. Solid State Physics Supplement 11.
- Seeger, K. (1973) Semiconductor Physics. Print in Austria by B. Müller, 269. http://dx.doi.org/10.1007/978-3-7091-4111-3
- Sze, S.M. (1981) Physics of Semiconductor Devices. John Wiley & Sons, Hoboken.
- Chenvidhya, D., Kirtikara, K. and Jivacate, C. (2003) A New Characterization Method for Solar Cell Dynamic Impedance. Solar Energy Materials and Solar Cells, 80, 459-464. http://dx.doi.org/10.1016/j.solmat.2003.06.011
- Suresh, M.S. (1996) Measurement of Solar Cell Parameters Using Impedance Spectroscopy. Solar Energy Materials and Solar Cells, 43, 21-28. http://dx.doi.org/10.1016/0927-0248(95)00153-0
- Kumar, R.A., Suresh, M.S. and Nagaraju, J. (2001) Measurement of AC Parameters for Gallium Arsenide (GaAs/Ge) Solar Cell by Impedance Spectroscopy. IEEE Transactions on Electron Devices, 48, 2177-2179. http://dx.doi.org/10.1109/16.944213
- Thiam, N., Diao, A., Ndiaye, M., Zerbo, I., Sarr, M., Maiga, A.S. and Sissoko, G. (2013) Study of the Photothermal Response of a Monofacial Solar Cell in Dynamic Regime Under a Multispectral Illumination. Research Journal of Applied Sciences, Engineering and Technology, 5, 134-141.
- Wang, C.H. and Neugroschel, A. (1991) Minority-Carrier Lifetime and Surface Recombination Velocity Measurement by Frequency-Domain Photoluminescence. IEEE Transactions on Electron Devices, 38, 2169-2180. http://dx.doi.org/10.1109/16.83745
- Mora-Sero, I., Garcia-Belmonte, G., Boix, P.P., Vazquez, M.A. and Bisquert, J. (2009) Impedance Spectroscopy Characterisation of Highly Efficient Silicon Solar Cells under Different Light Illumination Intensities. Energy and Environmental Science, 2, 678-686. http://dx.doi.org/10.1039/b812468j