Atmospheric and Climate Sciences
Vol. 3 No. 3 (2013) , Article ID: 33892 , 8 pages DOI:10.4236/acs.2013.33033
Characterization of Particulate Matter from Power Plant Stack Emissions in Southern Zimbabwe
Department of Environmental Science, Bindura University of Science Education, Bindura, Zimbabwe
Email: *violet.dudu@yahoo.com
Copyright © 2013 V. P. Dudu et al. This is an open access article distributed under the Creative Commons Attribution License, which permits unrestricted use, distribution, and reproduction in any medium, provided the original work is properly cited.
Received April 25, 2013; revised May 26, 2013; accepted June 3, 2013
Keywords: Particulate Matter; Pollution; Sulphur; Oncrop; Emissions
ABSTRACT
The study investigated the effects of four major particulate matter (PM) components namely sulphur, pulsar ash, carbon residue and ammonium components on the physical damage of sugarcane. A cyclone ambient kit tetra detector was used to quantify the components of the particulate matter at 2, 4, 6 and 8 km both in the windward and leeward sides of the power plant. This was done during the oncrop and offcrop season over a period of sixteen weeks. Eight sampling points were selected in an area of 2500 m2. Plant leaves were visually assessed for physical damage and the percentage of damage was noted. The results of the study were analyzed using SPSS version 16 and General Linear model-multivariate analysis to determine variation between the different means of components. Results showed that all PM components were only detected in the leeward side throughout the oncrop season and in the first two weeks of the offcrop. Ash and carbon deposition decreased with increasing distance. Ammonium components and sulphur were deposited only at 6 and 8 km. The percentage damage of the sugar cane was observed in the leeward side during the oncrop season. The physical damage caused by carbon and ash was observed in the 2 and 4 km distances whereas that caused by ammonium components and sulphur was observed in the 6 and 8 km distances.
1. Introduction
Major sources of air pollution include motor vehicles and industries with SO2 and NOx being two major pollutants emitted in industrial cities [1,2]. In the United States, half of the electricity generation using coal is responsible for 97% emissions in SO2, and 85% of NOx emissions [3]. The highest emissions of SO2 and NOx in a certain city in Korea were attributed to the yearly combustion of 950 million tonnes of coal at a thermoelectric power plant for energy production [1]. In Zimbabwe, the major source of air pollution is emissions from industries. Besides adverse health effects, air pollutants can have negative direct or indirect effects on plants. Huge economic damage can occur as a result of crop damage. A study by Muller et al. [4] showed that the largest industrial contributor in economical damages in the United States was coal whose damages ranged from 0.8 - 5.6 times value added. In this study area a nearby power plant uses coal and baggase as inputs for generating electricity. When baggase is used as a fuel in power plants, typical emissions include particulate matter in the range of 4000 - 6000 Mg/Nm3 and NOx [5]. It is in this background that many countries now have standards for the emission of gaseous pollutants from the generation of electricity using baggase. These include South Africa, Brazil, Malaysia, India and Mauritius [5].
United States Environmental Protection Agency (USEPA) defined particulate matter as a complex mixture of elemental carbon (EC), unburnt or partly combusted fuel such as organic carbon (OC), sulphur, ammonium components (for example sulphates from fuel sulphur and nitrates), and lubricant products that is ash and additives [6]. Emissions of particulate matter from combustion sources consist of many different types of compounds, including ammonium components (nitrates and sulphates), carbons, oxides, and any uncombusted elements in the fuel. These can be corrosive and toxic to plants and animals depending on their quantities [7]. Particulate matters have negative mechanical effects on plants. They cover leaf blades thereby blocking sunlight penetration and also prevent the opening of the stomata and these negatively affect photosynthesis [8].
Particulate matter emissions generally are classified into two categories; PM2.5 and PM10. PM2.5 and PM10 denote fine particles with aerodynamic diameter less than 2.5 and 10 microns respectively. Oxides of nitrogen (NOx) and sulphur dioxide (SO2) are pollutants that can react to form particulate matter. They are transformed into sulphate and nitrates through reaction with ammonia (NH3) at a significant distance downstream from the pollution source [9]. SOx and NOx gases can also first transform into acids and later into crystals of salts (sulphates and nitrates) then deposited. Sulphur dioxide is the biggest contributor to fine particle pollution from power plants [9,10]. The principal types of directly emitted particles are soil-related particles, sulphur, ash, organic and elemental carbon particles from the combustion of coal and the baggase. Secondary particles are primarily ammonium sulphate and ammonium nitrate which are generally referred to as ammonium components.
Pollution sampling at coal-fired electrical generating units in Baltimore showed that the fraction of particulate matter emitted from the stack as PM2.5 equals between 21% and 44%. According to US EPA data based on estimated emissions showed that stacks were responsible for 27% of state wide PM2.5 pollution in 2001 [9]. Studies by the Air Hygiene Foundation (AHF), the National Research Council of Canada, the United States Department of Agriculture and the Boyee Thompson Institutions denotes that studying the effect of the components of particulate matter on vegetation is of importance to agro-based industries. This is as a result of the negative impacts that these components have proved to have on vegetation during these studies [11,12]. The injurious effects of particulate matter on plants calls for investigations and discussion and this backdates to 1848 [13]. Researchers generally agree that concentrations of the components of soot on the order of 1 part per million of air by volume (ppm), will cause typical foliar markings on more sensitive species in a few hours, under favorable conditions, and that higher concentrations may cause complete defoliation and death of vegetation [14]. However, there is need to do further research on specifying on the exact components of the particulate that give the foliar markings. During photosynthesis, a large quantity of atmospheric components passes through the plant tissues. Any toxic particle present in the atmosphere and any obstruction to the gaseous exchange between the plant and its environment lead to undesirable effects [15]. As soot contains toxic substances, it can have adverse effects to plants.
Of late particulate matter pollution is increasingly being recognized as more dangerous than many of the gaseous pollutants with serious and irreversible repercussions on life forms and ecosystems [16,17]. Damage to plants by air pollutants usually occur on the leaf structure. Since the leaf contains the building mechanisms for the entire plant, all biochemical processes are negatively affected and therefore reducing productivity [18]. Surveys around European industrial areas showed that some of the plants have even withered with particulates emitted from stacks having significant contribution [16]. The leaves were brownish, yellowish and darker in colour reflecting the presence of pollutants that would have accumulated on them. Studies conducted in Kwazulu Natal confirm such a status of plants around an industrial area where stack emissions are ejected [19]. The degree of nature of damage is determined by the components of particulate matter in an area, the concentration of each component and also the height of the receiving plant. Taller trees are more prone to harm by particles of lower densities and vice versa for shorter plants and large particles [20]. In this study area a nearby power plant uses coal and baggase as inputs for generating electricity. The study investigated the particulate matter components that were emitted from the stacks of the power plant. There are few researches in Zimbabwe that have been published on this topic and so it was important to have such a study.
2. Methods
The study was conducted in the Southern part of Zimbabwe. Eight sampling sites were selected from the cane fields in the South East and North West area (four at each side) of the power plant. These were marked at 2 km distance intervals and since the wind blows from the South East, this direction was taken as the reference. A more detailed description of the sampling points is as shown in Table 1.
Four components of the particulate matter emissions (sulphur, pulsar ash, carbon residue and ammonium components) were measured using a cyclone ambient kit. The cyclone ambient kit is an automated particulate matter detector or a real-time in situ analyzer which detects and quantifies the presence of the four components of particulate matter (sulphur, pulsar ash, carbon residue and
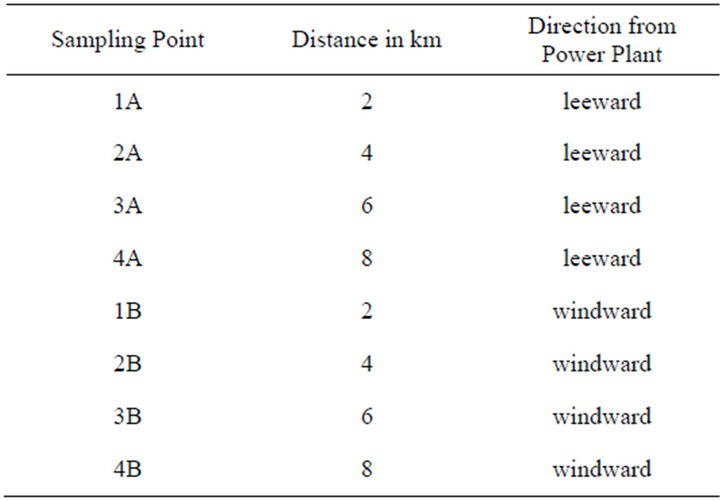
Table 1. Sampling sites in the study area.
composition of ammonium sulphates and ammonium nitrates). The underlying principle of the instrument is to fragment each particle into ions using a high-power laser and detecting the concentration in mg/m3. It was left for eight hours per day at each sampling point in which after those hours it showed the concentration of each component. At each sampling point four measurements were taken at ground level (0), 1, 2 and 3 m height. Measurements were taken twice in a week for a period of sixteen weeks. These measurements were done considering distance (km) from the source, direction (leeward and windward), height and season (oncrop and offcrop). At each sampling site, visual checks were done on the physical appearances of the leaves of sugarcane to determine the markings of the particulate matter components. At each sampling point a sampling area of 2500 m2 was demarcated using a surveyor’s tap measure. The cane was categorized according to height range (0 - 1, 1 - 2 and 2 - 3 m). The height was chosen to cater for all the sugarcane in their different growth stages. The sugarcane plants were then counted in an area of 100 m2 and simple calculation was used to determine the number of plants in 2500 m2. The checks were done during the oncrop (sugar production season in which the power plant is in full operation to meet the electricity demands for crushing the cane) and the offcrop season (the power plant is not operating) on both sides. In these areas leaf markings were analyzed and results noted down in a log book.
3. Results and Discussion
3.1. Characterization and Quantification of the Different Components
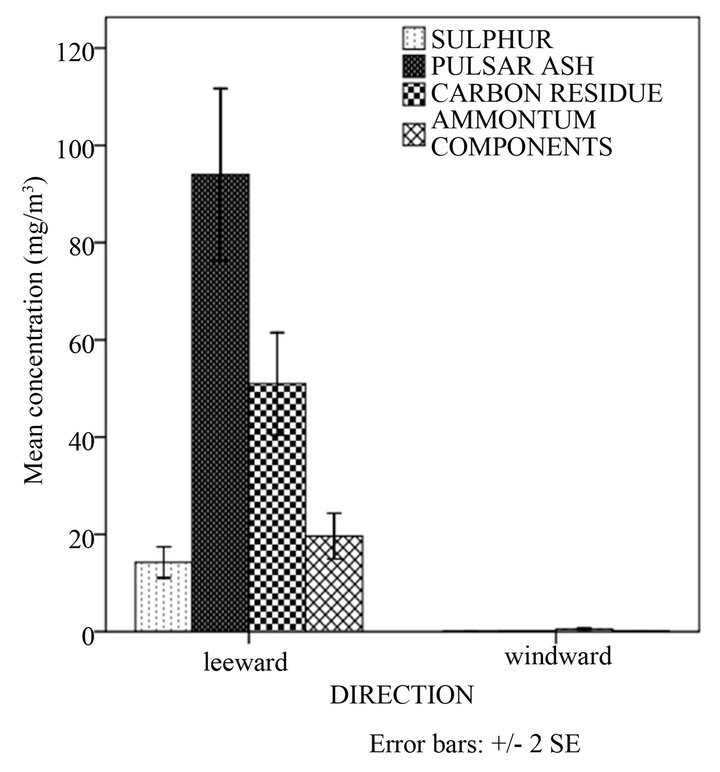
Figure 1(a) shows that significantly high concentrations of the particulate matter components were detected in the leeward side in the order ash > carbon residue > ammonium components > sulphur. Minute quantities of components were detected in the windward side. This can be explained by the fact that wind blows from the windward side to the leeward side and therefore particulates were carried by the wind as it moved. There was a statistically significant difference between mean concentrations of the components in different directions from the source (p < 0.05). These results compare well to a study by Hao [10] in Beijing. Secondary pollutants such as sulphates had the least values of emissions (0.21 µg/m3) and this represented a contribution from power plants of 3% annually. In the US, coal burning generates more than 125 million tonnes of waste which include ash, slag and sludge annually [21]. This explains why ash dominated the emissions in this study.
Figure 1(b) shows that concentration of ash and carbon in the leeward side decreases with distance whereas that of ammonium components and sulphur increased with distance. Particulate matter that was detected in the windward side was insignificant. There were statistically significant differences between mean concentrations of ash, carbon, sulphur and ammonium components in different distances and direction from the source (p < 0.05) (Table 2). This observation could have been attributed to particle size which determines the distance particulates travel before deposition. The greater the particle size and density, the less the distance it travels before deposition. The particle sizes of ammonium components and sulphur were small so they deposited at a distance far away from the source. Results of a study conducted by Mahajan et al. [16] on the impacts of coal fired thermal power plants on agriculture showed that PM2.5 particulates affected trees that were in greater distances whereas PM10 particulates were deposited and affected trees in shorter distances (less than 5 km). A study by Hao and coworkers [10] showed that for the spatial distribution of primary pollutants, higher concentration appears near power plants. Modelling studies of air pollutants from power plants by Levy et al. [3] showed that secondary PM concentrations increased from the source and diminished more slowly with distance from the source.
The oncrop season had the highest concentrations of all PM components (Figure 1(c)). The order of concentrations was ash < carbon < ammonium components < sulphur. There was a statistically significant difference between mean concentrations of the components in different production seasons (p < 0.05). This trend is in agreement with the findings from a study by Senior and Panagiotou [22] who found out that ash constituted the highest percentage in coal combustion emissions than carbon elements. A reduction in PM components was observed in the offcrop season (Figure 1(c)). This could have been because the combustion process was stopped. However, these particulate matter components were only detected in the first week of the offcrop season with only sulphur and ash being observed in significant quantities yet carbon and ammonium components were in quantities that were insignificant. This observation could have been due to the settling period of all components which was low and the residence times of ammonium and carbon residue which are short (2 - 4 days) [23]. The longer settling period of ash was due to its greater quantity. The greater the quantity of a substance the longer the time taken for all particles to subside regardless of the density [24].
Figure 1(d) demonstrates that there was a statistically insignificant difference between mean concentrations of sulphur, carbon residue and ash at different heights in the windward and leeward side (p > 0.05). This could have been attributed to the small difference in height which was in this case 1 m. There was a statistically significant difference between mean concentrations of ammonium
 (a)
(a)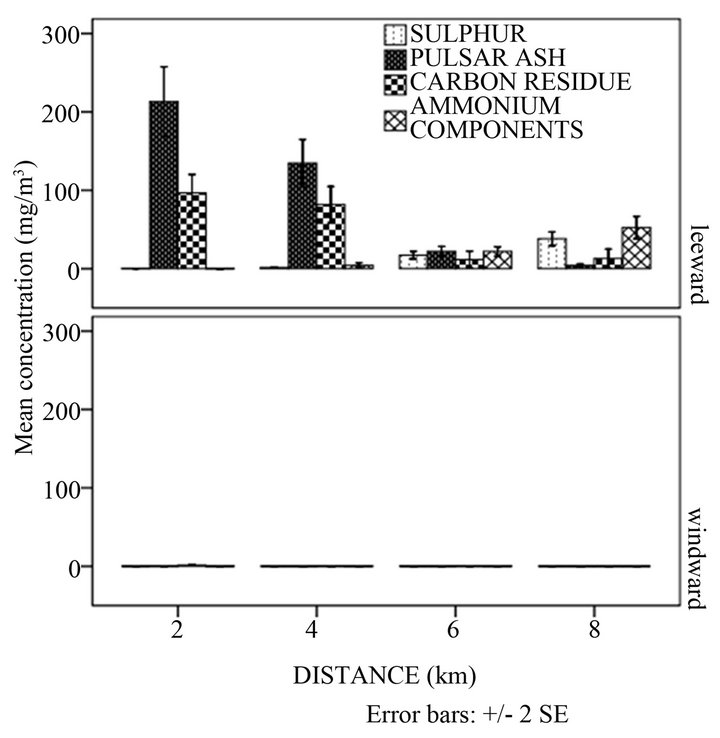 (b)
(b)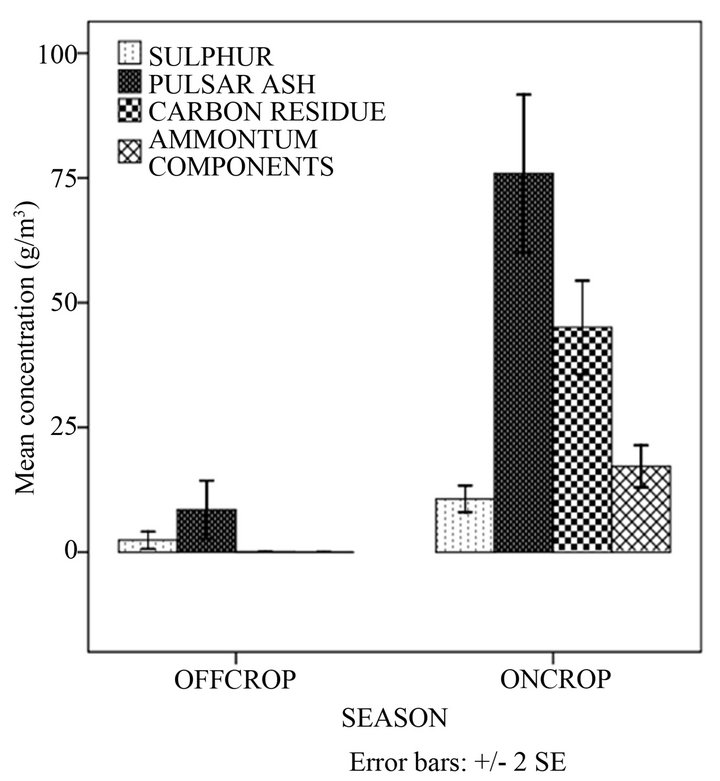 (c)
(c)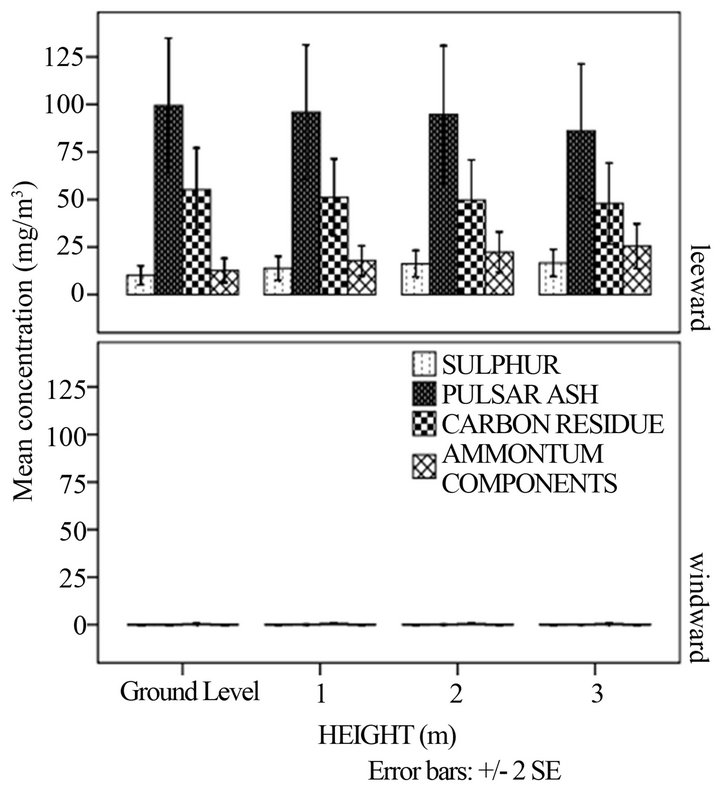 (d)
(d)
Figure 1. Mean quantities of sulphur, ash, carbon residue and ammonium components at: (a) direction; (b) distance and direction; (c) season and (d) height and direction.
components in the 0 - 1 m height whereas that in the 2 - 3 m-height was insignificant (p < 0.05) as shown in Table 3.
This trend has not been explained in literature but a probable explanation could have been due to transformations of the ammonium components.
3.2. Physical Damage Caused by Particulate Matter Components to Sugarcane
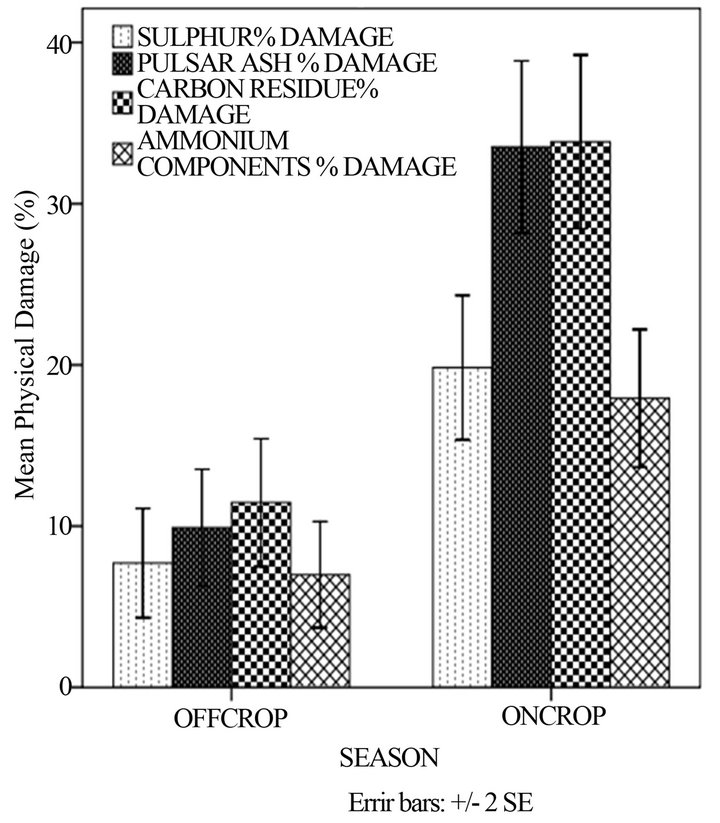
In Figure 2(a) a significantly higher physical damage on sugarcane was in the oncrop season as compared to the offcrop season. There was a statistically significant difference between mean percentage damages in different seasons (p < 0.05). This observation was expected because it was during the oncrop season that the power stations were working and therefore emissions were greater. The greatest percentage of damage on sugarcane occurred in the leeward side (Figure 2(b)). No visible symptoms of damage were observed in the windward side. The quantities of PM components that were detected in the windward side were too minute to cause any damage on leaves. In the leeward side no significant differences were observed between mean percentage damage of leaves at different heights (p > 0.05). As in Figure 1(d), the explanation could have been due to a small difference in height in sugarcane crops to cause much damage. According to Baedecker and others [20] taller trees are more prone to harm by particles of lower densities. Shorter plants are more subjected to damage by particles of large densities. Gheorghe and Ion [8] observed that under certain conditions, ammonia may remain in the cloud and cause more injury to trees than to ground flora.
The physical damage caused by ash and carbon was only detected in the leeward side decreasing with distance whereas that of ammonium components and sulphur increased (Figure 2(c)). These results were different from what was noted in literature. Gheorghe and Ion [8] observed that where there was pollution from ammonia, the extent of injury reduced with increasing distance from the source. Other factors could have contributed and these can include meteorological aspects and chemistry. The percentage physical damage caused by sulphur and ammonium components was high (>50%) in the 6 to 8 km distance. This could have been as a result of the period the sugar cane was exposed to the particulates. According to Spiro and Stigliani [25], the longer the exposure of the plant to particulates, the higher the percentage damage of any plant organs.
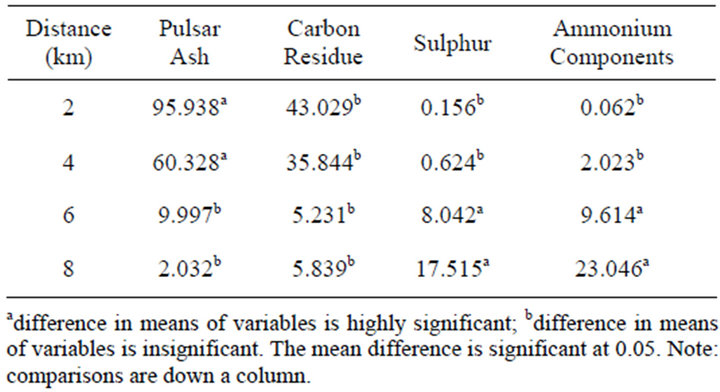
Table 2. Multiple comparisons of PM concentration means at different distances.
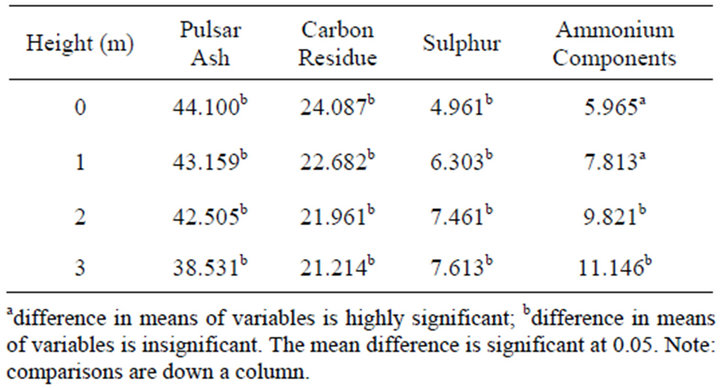
Table 3. Multiple comparisons of PM concentration means at different heights.
Plants when exposed to airborne pollutants experience physiological changes before exhibiting physical damage to leaves [26]. PM components when deposited on vegetation by dry deposition may be incorporated into raindrops or cloud droplets to increase the acidity of precipitation (Lovett et al., 2009). According to the California Air Resources Board [27] particulate matter, whether suspended in the atmosphere, or already deposited on a surface, also adsorb or absorb acidic gases from other pollutants like sulphur dioxide (SO2) and nitrogen dioxide (NO2), thus serving as nucleation sites for these gases. The deposition of “acidified” particles on a susceptible vegetative surface is capable of accelerating chemical degradation of the plants organs. PM components reduce photosynthesis and cause some foliar lesions [28]. Some of the sugarcane plants had withered; their leaves turned brownish, yellowish and darker in colour reflecting that pollutants had accumulated on the leaves. Particulate matter consists of extremely fine carbon-containing particles that are responsible for the blackening of plants and browning of the leaves. These in general block the pores of the leaf surface thereby reducing the gaseous exchange between the plant and the atmosphere. They block sunlight infiltration, can result in leaf injury, damage to the stomata, premature senescence and reduce photosynthetic activity. This has subsequent effects of reduced growth and low yields [26]. Sulphur is deposited in two forms; dry and wet deposition. It can be dropped off from the atmosphere as sulphur particles in the dry deposition process. In the wet deposition, SO2 combines with moisture to form sulphates. SO2 has adverse effects on the morphological and physiological characteristics of plants [26]. Sulphur is toxic to plants in short-term concentrations of about 12 mg/m3. It reduces plant growth and whitens the leaves [29]. However, the extent of the leaf and foliar markings depend on the concentration of the sulphur. Acidification can have long term changes in ecosystem structure and function. There is decreased health and biological productivity of plants. Interactions occur in chemical and biochemical processes which result in injury to leaf epidermal layers and cells of plants, there is also alteration of stomatal conductance. Air pollutants such as SO2 and NOx cause partial denaturing of the chloroplasts and decreases pigment contents in the cells of polluted leaves. Chlorophyll levels in plants decrease under pollution stress [2]. High exposure levels to SO2 can result in water stress, photosynthetic decline, increased cell wall rigidity and reduced carbon assimilation [26]. Some of the sugar cane plants had tiny black and brown spots indicating possible damage by ammonium components. Ammonium nitrates and ammonium sulphates in high concentrations have been shown to be harmful to citrus trees and ornamental plants, which are of economic importance. According to Maurer and co-
 (a)
(a)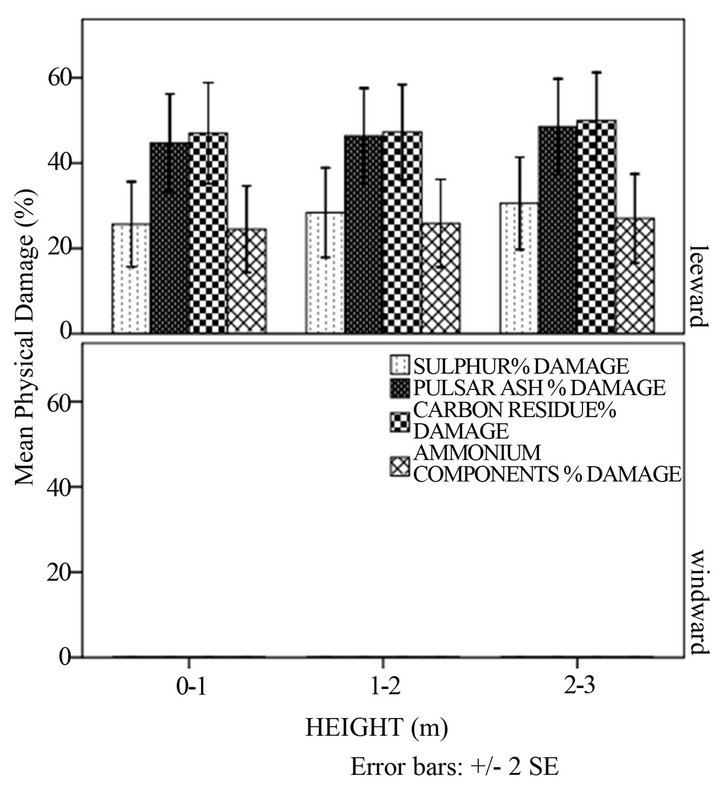 (b)
(b)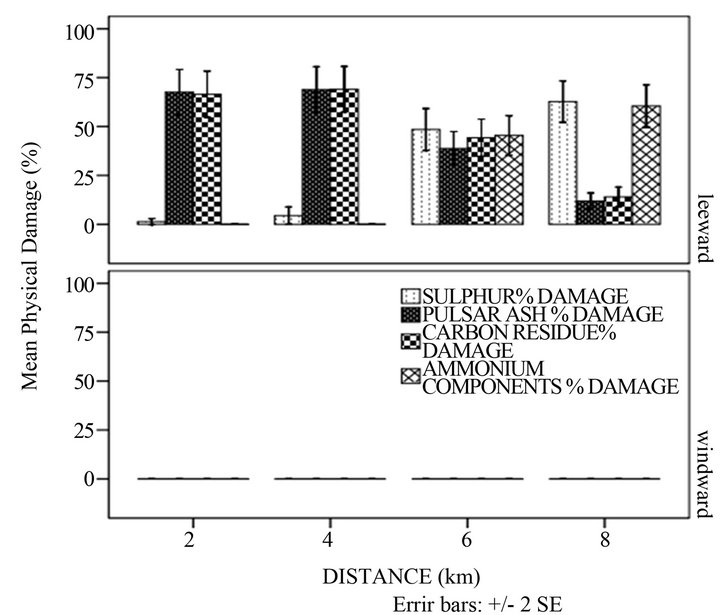 (c)
(c)
Figure 2. Mean percentage physical damage of the sugar cane with: (a) season; (b) height and direction and (c) distance and direction.
workers [30], the deposition of ammonium components on plant leaves gives out tiny black and brown spots and excessive deposition burns out the whole leaf structure. Researchers have shown that pollutants interact with other pollutants for example the role of ammonia in enhancing sulphur deposition. When SO2 is deposited on a leaf it acidifies the surface thereby slowing down the SO2 deposition process. Ammonia being alkaline will counteract the acidifying effect leading to enhanced sulphur deposition [28]. Ash that is emitted during coal combustion contains various toxic and radioactive elements. Interference with gaseous exchange caused by deposition of ash particles on the leaf surfaces can choke up the stomata openings of leaves. The coal ash emitted by a power plant carries into the surrounding environment 100 times more radiation than a nuclear power plant producing the same amount of energy [24]. When coal is burned into ash, uranium and thorium are concentrated at up to 10 times their original levels. Sometimes these elements leach into the soil and water surrounding a coal plant, affecting cropland and, in turn, food [24].
The model shown in Figure 3 can be used to explain how pollutants can affect the plants in general. Pollutants enter the plant through the stomata. These together with CO2 may influence stomatal conductance and the flux of the pollutant gases into the leaf. Pollutants may reduce the rate of CO2 assimilation. The availability of carbohydrates (influenced by CO2 and pollutant concentrations) may change the capacity of the plant to repair pollutant injury and the supply of important chemicals which influences the threshold flux above which pollutants may cause injury. Translocation and allocation of carbon to different plant organs such as leaves, stems, roots and storage organs may be affected by availability of carbon and direct pollutant effects [31]. However it is important to note that the nature and extent of damage on the plant will depend on the chemistry and physical characteristics of the pollutant and the ability of the plant to detoxify that pollutant.
4. Conclusions
The study showed that components of the PM were deposited more on the leeward side causing damage to sugarcane that was grown on this side. The quantities of the PM deposited and the physical damage on the sugarcane were influenced by the distance from the power plant, height of the sugarcane and the growing season. The
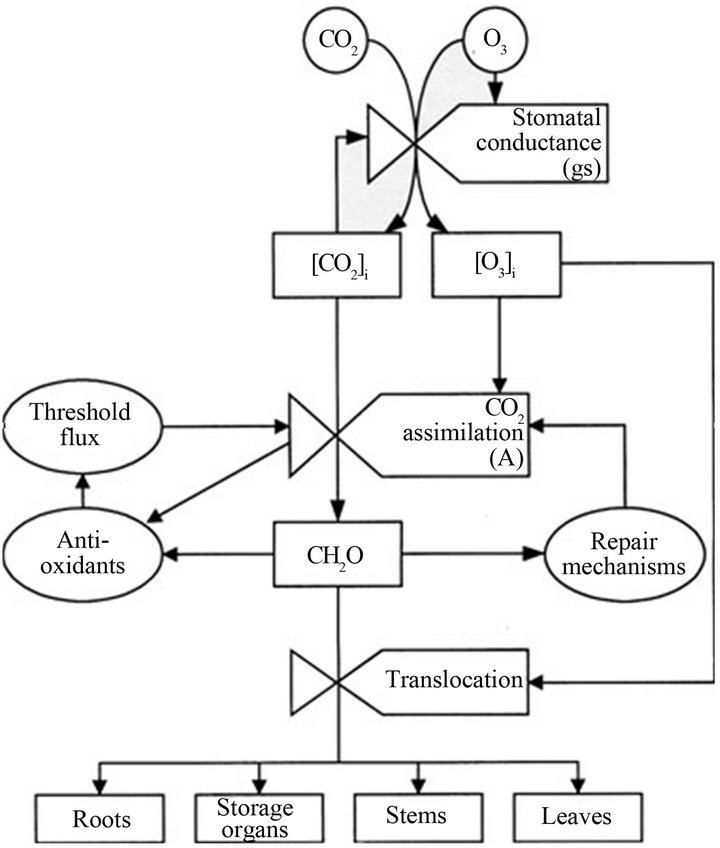
Figure 3. Conceptual model of the effects of CO2 and O3 on carbon assimilation and allocation in plants. From Ashmore (2005).
sugarcane grown in fields in a distance of less than 4 km were more prone to physical damage by carbon residues and ash during the oncrop season. Physical damage to sugarcane by sulphur and ammonium components was observed at distances 6 km and 8 km again during the oncrop season. The current levels of stack emissions at the power plant can be reduced to permissible levels with control technologies. These technologies could include using coal with low sulphur content, fabric filters, electrostatic precipitators and adsorption towers.
PM monitoring equipment should be installed in order to monitor emissions in an effort to assess and reduce PM pollution. Sugarcane is of major economic importance to the country. In order to reduce damage to the plants, a windbreak is needed which acts as a physical barrier to pollutants. Trees can be planted around the sugarcane fields so that they act as shields and minimize the pollutants that reach the sugarcane plants.
5. Acknowledgements
The authors wish to thank all individuals who contributed to this research.
REFERENCES
- I. H. Choi and W. K. Jo, “Application of Stack Emissions Data from Tele-Monitoring Systems for Characterization of Industrial Emissions of Air Pollutants,” Aerosol and Air Quality Research, Vol. 11, 2011, pp. 412-418.
- K. Mohammed, K. Rashmi and P. W. Ramteke, “Studies on Air Pollution Tolerance of Selected Plants in AllahAbad City, India,” E3 Journal of Environmental Research and Management, Vol. 2, No. 3, 2011, pp. 042-046.
- J. I. Levy, J. D. Spengler, D. Hlinka, D. Sullivan and D. Moon, “Using CALPUFF to Evaluate the Impacts of Power Plant Emissions in Illinois: Model Sensitivity and Implications,” Atmospheric Environment, Vol. 36, No. 6, 2002, pp. 1063-1075. doi:10.1016/S1352-2310(01)00493-9
- N. Z. Muller, R. Mendelsohn and W. Nordhaus, “Environmental Accounting for Pollution in the United States Economy,” American Economic Review, Vol. 101, No. 5, 2011, pp. 1649-1675. doi:10.1257/aer.101.5.1649
- E. S. Lora, F. P. Arietta, R. C. Carpio and L. A. H. Nogueira, “Clean Production: Efficiency and Environment,” Paper Presented at the Seminar “The Sugarcane: A Multidimensional Agenda for 21th Century”, Dominican Republic, 25-29 October 2012, pp. 1-15.
- US Environmental Protection Agency, “National Emissions Inventory,” EPA, Washington DC, 2005.
- R. Andrews, “Managing the Environment, Managing Ourselves: A History of American Environmental Policy,” Yale University Press, New Haven, 1999.
- I. F. Gheorghe and B. Ion, “The Effects of Air Pollutants on Vegetation and the Role of Vegetation in Reducing Atmospheric Pollution, the Impact of Air Pollution on Health, Economy, Environment and Agricultural Sources,” InTech Publisher, Croatia, 2011, pp. 241-281.
- B. Heavner, M. Barrett and E. Ridlington, “Particulate Matter Pollution from Maryland Power Plants,” Environment Maryland Research & Policy Centre, Baltimore, 2007.
- J. Hao, L. Wang, M. Shen, L. Li and J. Hu, “Air Quality Impacts of Power Plant Emissions in Beijing,” Environmental Pollution, Vol. 147, No. 2, 2007, pp. 401-408. doi:10.1016/j.envpol.2006.06.013
- C. J. Bailey, “Congress and Air Pollution: Environmental Policies in the USA,” Manchester University Press, New York, 1998.
- L. D. Emberson, et al., “Impacts of Air Pollutants on Vegetation in Developing Countries,” Water, Air and Soil Pollution, Vol. 130, No. 1-4, 2001, pp. 107-118. doi:10.1023/A:1012251503358
- D. Stradling, “Smokestacks and Progressives: Environmentalists, Engineers, and Air Quality in America,” Johns Hopkins University Press, Baltimore, 2002.
- US Environmental Protection Agency, “Particulate Matter Standards and Agriculture Fact Sheet,” EPA, Washington DC, 2012.
- S. Kayin, G. Tuncel and C. Yurteri, “Local Air Quality Impacts Due to Downwash around Thermal Power Plants: Numerical Simulations of the Building Orientation,” Middle East Technical University, Turkey, 1999.
- V. Mahajan, P. A. Azeez and P. R. Arum, “Impacts of Coal Fired Thermal Power Plants on Agriculture: A Case Study of the Chicku (Sapota) Ochards of Dahanu,” Gregory Publishers, Maharashtra Chicku (Sapota), 2004.
- D. Li, Y. Guo, Y. Li, P. Ding, X. Wang and Z. Cao, “Air Pollutant Emissions from Coal-Fired Power Plants,” Open Journal of Air Pollution, Vol. 1, No. 2, 2012, pp. 37-41. doi:10.4236/ojap.2012.12005
- H. S. Bhatia, “A Textbook on Environmental Pollution and Control,” Galgotia Publications Private Limited, Delhi, 2003.
- P. Ort, “South Durban Multi Point Plan Case Study Report: Air Management Planning,” Durban Printers, Durban, South Africa, 1995.
- P. A. Baedecker, E. O. Edney, P. J. Moran, T. C. Simpson and R. S. Williams, “Effects of Particulate Deposition,” State of Science and Technology, Vol. 3, 1991, pp. 34- 265.
- D. Shindell and G. Faluvegi, “The Net Climate Impact of Coal-Fired Power Plant Emissions,” Atmospheric Chemistry and Physics, Vol. 10, No. 7, 2010, pp. 3247-3260. doi:10.5194/acp-10-3247-2010
- C. L. Senior and T. Panagiotou, “Formation of Ultra-Fine Particulate Matter from Pulverized Coal Combustion,” University Of Utah, Salt Lake City, 2000.
- M. Vallius, “Characteristics and Sources of Fine Particulate Matter in Urban Air,” National Public Health Institute, Finland, 2005.
- US Environmental Protection Agency, “Toxics Release Inventory (TRI): Public Data Release Report,” EPA, Washington DC, 2003.
- T. G. Spiro and M. W. Stigliani, “Chemistry of the Environment,” Prentice Hall of India, New Delhi, 2002.
- S. M. Seyyednejad, M. Niknejad and H. Koochak, “A Review of Some Different Effects of Air Pollution on Plants,” Research Journal of Environmental Sciences, Vol. 5, No. 4, 2011, pp. 302-309. doi:10.3923/rjes.2011.302.309
- California Air Resources Board, “Toxic Air Contaminant Fact Sheets,” Environmental Quality Data, Vol. 1, 1998, pp. 1-2.
- G. M. Lovett, T. H. Tear, D. C. Evers, S. E. G. Findlay, B. J. Cosby, J. K. Dunscomb, C. T. Driscoll and K. C. Weathers, “Effects of Air Pollution on Ecosystems and Biological Diversity in the Eastern United States,” Annals of the New York Academy of Sciences Vol. 1162, 2009, pp. 99-135. doi:10.1111/j.1749-6632.2009.04153.x
- M. Lippmann, “Environmental Toxicants,” 2nd Edition, John Wiley & Sons Ltd., New York, 2000.
- D. Maurer, M. Mengel, G. Robertson, T. Gerlinger and A. Lissner, “Environmental Pollution,” Elsevier Science Ltd., London, 2011.
- M. R. Ashmore, “Assessing the Future Global Impacts of Ozone on Vegetation,” Plant, Cell and Environment, Vol. 28, 2005, pp. 949-964. doi:10.1111/j.1365-3040.2005.01341.x
NOTES
*Corresponding author.