Atmospheric and Climate Sciences
Vol.3 No.1(2013), Article ID:27561,6 pages DOI:10.4236/acs.2013.31006
Performance Evaluation of Four Commercial Optical Particle Counters
Institute of Atmospheric Sciences and Climate (ISAC), National Research Council, Bologna, Italy
Email: f.belosi@isac.cnr.it
Received November 20, 2012; revised December 22, 2012; accepted December 31, 2012
Keywords: Optical Particle Counter; Air quality; Aerosol Size Distribution
ABSTRACT
The performances of four optical particles counters, Aerosol Spectrometer (Grimm 1.108), Enviro Check (Grimm 1.107), DustMonit and ParticleScan, were evaluated in laboratory tests employing monodisperse aerosol particles. The study focused on how commercial instruments perform during routine measurements respect to OPC scientific understanding, because it is important for users of such instruments to be aware of their limitations. Measurements were performed using aerosol generated by a Monodisperse Aerosol Generator (MAGE), which produced carnauba wax particles of diameter (1.00 ± 0.08) µm and (1.40 ± 0.15) µm, and monodisperse Polystyrene Latex (PSL) aerosol with nominal diameter of 1.0 mm. The results show comparable total particle number concentrations for all the counters, when the count of the first size channel (0.3 - 0.4 µm) for the 1.108 Grimm counter was left out. In the said channel the Grimm counter 1.108 always showed much higher particle counts than those inferred from the tested aerosols. The overcount was proved by the fact that the aerosol sampled in each test on a Nuclepore filter showed no particles in the 0.3 - 0.4 µm range when examined under Scanning Electronic Microscope (SEM). The presence of an artefact produced by the counter was assumed as a likely explanation. For all the counters, the Count Median Diameters (CMDs) of aerosol size distributions, were far below the expected value for the aerosol used. The nearest CMD values to the expected ones were shown by the Grimm 1.107 counter.
1. Introduction
Single particle light scattering is one of the most widely used techniques for measuring the particle number size distribution in the range from 0.2 µm up to several microns. Single Optical Particle Counters (OPCs) measure the light elastically scattered from a single particle illuminated by a well defined light source while it is passing through the sensing volume of the instrument. The scattered light intensity is utilized as a measure of the particle’s size. The Mie theory is used to predict the light scattering intensity of an electromagnetic wave by a homogenous spherical particle. Consequently, the relative signal response of an OPC can be determined by knowing the characteristics of the light source, the detector, and the physical configuration of the sensitive volume, and the properties (mainly size, refractive index and shape) of the particle [1]. Several efforts have been made to test experimental OPC’s response against Mie theory, using polystyrene latex [2-4].
In recent years, measurement techniques based on aerosol light scattering have received greater attention because of the possibility of deploying the aerosol size distribution as a proxy of the health related fractions like PM10, PM2.5 and PM1 [5]. The increasing importance of adverse health effects of air pollution has driven research towards the development of real time measurement techniques, which can couple meteorological parameters and particulate matter characteristics (mainly concentration and size distribution), thus providing an improved understanding of the relationship between sources and effects of mitigation actions that could be taken. In order to estimate the aerosol mass concentration from the OPC size distribution measurements, as well as the influence of particle shape and refractive index, particle density must also be taken into account. Since the latter is generally not known over the size distribution spectrum, only empirical conversion matrix factors can be used. Therefore, only sampling site-dependent correlations can be obtained [6].
In the present study, four commercial OPCs were tested in parallel with monodisperse generated aerosols, in order to compare their particle counting efficiencies and particle size classification capabilities.
The aim of the present study is to caution against careless use of the counters in monitoring situations. The study was promoted by the Italian Aerosol Association (IAS) in the context of the working group on “PMx aerosols”.
2. Experimental Set-Up
The experimental work was carried out at the Institute of Atmospheric Sciences and Climate (ISAC) of the Italian National Research Council (CNR) in Bologna during summer 2010. Monodisperse particles were generated by means of MAGE (Monodisperse Aerosol Generator, Lavoro & Ambiente, Bologna, Italy). MAGE is a condensation-type generator capable of producing monodisperse particles in a wide size range. A stream of nuclei (mainly NaCl nuclei) is exposed to the vapour of a low-volatile liquid at an elevated temperature, and the controlled heterogeneous condensation of the vapour onto the nuclei results in the generation of monodisperse aerosol [7,8]. MAGE was used with Carnauba Wax (CW) at 270˚C and 300˚C oven temperatures in order to obtain two different monodisperse aerosol distributions. Particles size was ascertained by aspirating the aerosol on a Nuclepore filter (Whatman, 0.20 mm pore size) at the outlet of the MAGE and observing the filter under SEM. The measured diameter were (1.00 ± 0.08) µm at the lower temperature and (1.40 ± 0.15) µm at the higher temperature value. Figure 1 shows a typical SEM image of the aerosol generated by the MAGE at 270˚C, sampled directly from the generator outlet. It can be seen that the particles are of spherical shape. Their density is supposed to be the same as the CW bulk density (about 990 Kg∙m−3), while the refractive index is 1.45˚C at 20˚C.
Since the particle number concentration was very high at the MAGE outlet (of the order of 1012 particles∙m−3), two diluters were positioned in series, after which all OPCs sampled from a mixing volume. The diluters were based on the Venturi effect, as shown in the paper of Yoon et al. [9].
A test was also carried out with Polystyrene Latex particles (PSL, Agar Scientific) with nominal diameter of
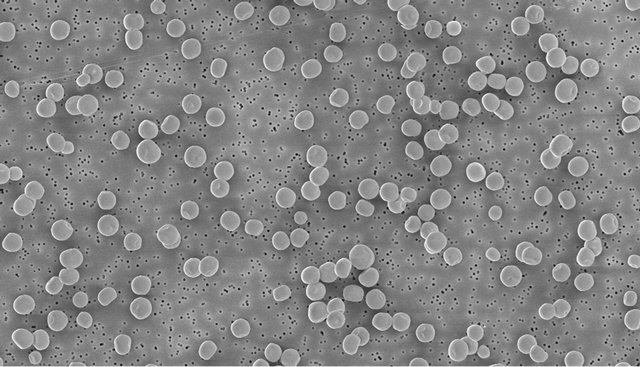
Figure 1. Monodisperse carnauba wax particles obtained with the MAGE at the working temperature of 270˚C.
1.0 mm and refractive index of 1.59. The PSL particles were nebulized with a six-jet TSI atomizer model 9306, aerosol generator, and were sampled without dilution.
The generated aerosols were not strictly monodisperse due to various causes. As a matter of fact some NaCl nuclei could not have been nucleated by the CW vapour. Based on the concentration of the NaCl solution and the size of the droplets generated by the Collison, the nuclei should have a diameter of about 60 nm [10]. In addition the generation of PSL particles involves even residue particles which are below 100 nm [11]. Therefore the OPC counters should not be able to detect both the NaCl nuclei and PSL residue particles. A possible coagulation of the aerosol at the exit of the MAGE due to the high particle concentration was avoided by diluting the aerosol.
The OPCs tested were the following: DustMonit (Con. Tec Engineering srl, Milan) with sampling flow rate of 1 lpm, size separation range of 0.3 - 10 mm and 8 channels; Grimm 1.107 (Grimm Aerosol Technik, GmbH) with sampling flow rate 1.2 lpm, size separation range of 0.2 - 32 mm and 31 channels; Grimm 1.108 (Grimm Aerosol Technik, GmbH) with sampling flow rate 1.2 lpm, size separation range of 0.3 - 20 mm and 15 channels; ParticleScan CR (ParticleScan, Advanced Particle Counters. IQAir) with sampling flow rate 2.8 lpm, size separation range of 0.3 - 5 mm and 6 channels. Each OPC name is shortened to the following initials: DM (DustMonit), EN (Grimm 1.107), GR (Grimm 1.108) and PS (ParticleScan). When comparing the OPCs, the particle number concentration of the EN counter was considered only for sizes larger than 0.3 mm (first two channels excluded). The tested OPCs have a laser wavelengths in the range from 675 nm (Grimm 1.107) to 780 nm (Grimm 1.108). In accordance with the manufacture’s recommendations, Grimm OPCs are calibrated with polystyrene latex, while for DustMonit and ParticleScan the calibration procedures are not available.
The OPC performances were compared by measuring the size distribution of monodisperse aerosol particles simultaneously sampled from a 1 liter mixing volume. Before each test session the background particle number concentration in the laboratory was measured and verified to be less than 1% of the particle number concentration generated in the comparison experiments. In order to compare the findings from each OPC, the particle number concentration in each size channel (dN) was normalized by considering the channel width (dN/dDp). During each run (for both particle diameters), an aerosol sample generated by MAGE was sampled on Nuclepore filter media for SEM observations. Only tests with a total particle number concentration less than 2 × 10⁶ l−1 were considered, as this is the maximum particle number concentration recommended by the respective manufacturers to avoid coincidence errors.
In addition, in order to confirm the results of the comparison, the GR counter was subsequently sent to the manufacturer for the yearly revision (calibration checks and adjustments). On its return, a further test was performed against a Las-X (PMS, Inc) active cavity laser.
3. Results and Discussion
The results are presented below, separately for the total particle number concentration and the particle size classification.
3.1. Total Particle Number Concentration Measurements
1) Carnauba wax particles
Figure 2 shows the ratio of the total particle number concentration measured by each OPC and the average total particle number concentration (M), obtained by averaging the total counts of the single OPC, for the four tests performed with monodisperse particles at (1.00 ± 0.08) mm (MAGE at 270˚C). The bars show one standard deviation. The histogram shows the results considering the OPC channels from 0.3 mm and from 0.5 mm separately.
Figure 3 shows the results obtained with the particle size of (1.40 ± 0.15) µm (MAGE at 300˚C).
Compared to the other counters the results show a higher total particle number concentration in the case of GR, when the full size spectrum is considered. The agreement among the OPCs improves when only channels starting from 0.5 µm are considered.
2) Polystyrene latex particles A test with PSL particles of 1.0 µm diameter was carried out to investigate any possible artifacts in the gener-
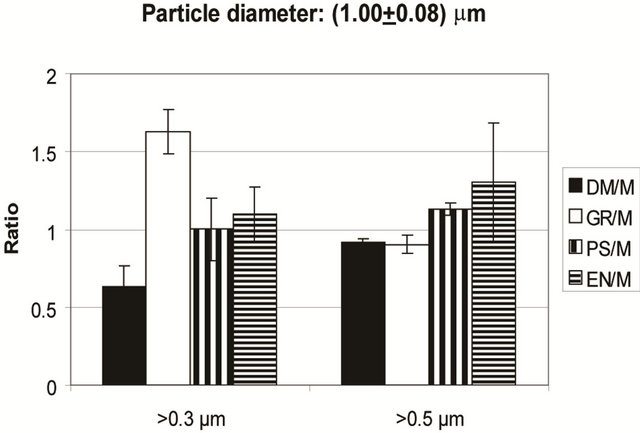
Figure 2. Ratio of the total particle number concentration measured by each OPC and the average total particle number concentration. Particle diameter: (1.00 ± 0.08) mm. Bars show one standard deviation. Results are shown considering the OPC channels from 0.3 mm and from 0.5 mm separately.
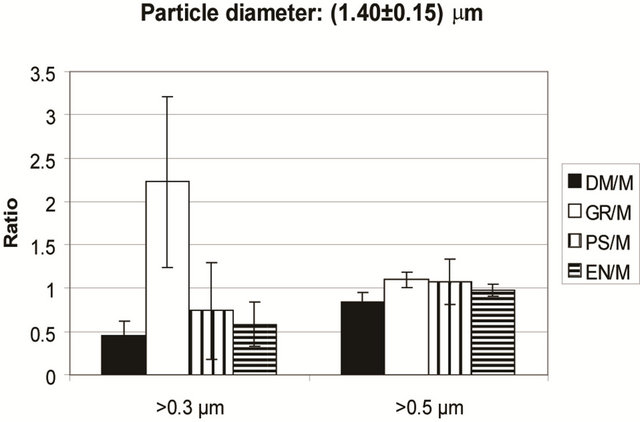
Figure 3. Ratio of the total particle number concentration measured by each OPC and the average total particle number concentration. Particle diameter: (1.40 ± 0.15) mm. Bars show one standard deviation. Results are shown considering the OPC channels from 0.3 mm and from 0.5 mm separately.
ated CW aerosol particles. The results, shown in Figure 4, are comparable to those of the CW particle tests, showing a higher particle number concentration of the GR sampler in the first two size channels. It can be concluded that the GR counter counts more particles than the other samplers, in the first two size channels (0.3 - 0.4 µm and 0.4 - 0.5 µm).
The behaviour of the GR counter conflicts with the results of Heim et al. [4], who found a decrease in the counting efficiency of the OPCs towards the first size channels (lower particle diameters).
3.2. Particle Size Distribution Measurements
Figures 5 and 6 show the particle size distributions obtained with PS, GR, DM and EN optical particle counters, by measuring generated CW particles. The sampled particle diameter obtained from SEM observation were (1.00 ± 0.08) mm and (1.40 ± 0.15) mm, respectively.
The results show that EN, and to a greater extend GR, measured higher particle number concentrations in smaller size channels, as compared to PS and DM.
Table 1 shows the CMD and the Geometric Standard Deviation (GSD) for each counter. The CMD and GSD were obtained by reporting cumulative particle number distributions on log-probability plots. The CMD from all counters turned out to be much lower than expected according to the tested particles.
By excluding the count of the first channel (size 0.3 - 0.4 µm) and sampling aerosol of size (1.00 ± 0.08) µm and (1.40 ± 0.15) µm, the CMD for the EN counter was 0.73 µm and 0.98 µm, and for the GR, 0.52 µm and 0.68 µm, respectively. In the case of PSL particle tests, the GR counter showed the highest particle number concentration in the first size channel. By excluding this channel, a CMD of 0.56 µm was obtained, instead of the

Figure 4. Ratio of the total particle number concentration measured by each OPC and the average total particle number concentration. PSL particles. Results are shown considering the OPC channels from 0.3 mm and from 0.5 mm separately.
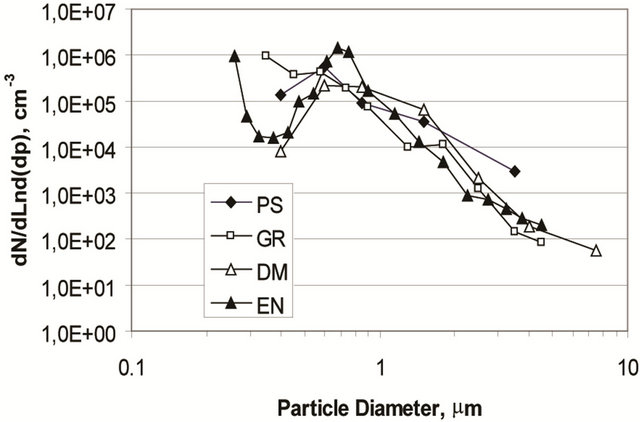
Figure 5. Particle size distributions obtained for CW particles. Particle diameter: (1.00 ± 0.08) mm.
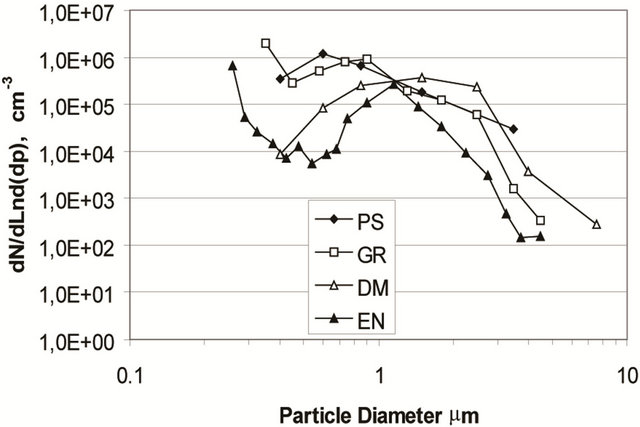
Figure 6. Particle size distributions obtained for CW particles. Particle diameter: (1.40 ± 0.15) mm.
1.0 µm sphere diameter. The CMD underestimation by GR is in agreement with the results obtained by Heim et al. [4], which showed, albeit for the Grimm 1.109 OPC, a ower detected PSL particle diameter in the size range from around 0.8 µm to approximately 2 µm. After the comparison tests the GR optical particle counter was sent
Table 1. Averaged CMD and GSD obtained during the tests with different monodisperse particle class ranges: (a) Particle diameter (1.00 ± 0.08) µm; (b) Particle diameter (1.40 ± 0.15) µm; (c) PSL (1.0 µm). For the EN counter only size channels larger than 0.3 µm were considered.

l to the manufacturer for the yearly calibration and maintenance. On its return a further comparison against a Las-X (PMS, Inc) active cavity laser was performed. Figure 7 shows the results for GR-A before maintenance (same curve as Figure 5) and after (GR-B). It can be seen that the GR better classifies the particles size than it did before the calibration, but the over count in the first size channel is still present.
The reported results evidence that OPC users are not able to check whether the instruments they employ are working well or not. As a matter of fact the software installed in all OPCs takes into account only the lens cleaning effect, and therefore the instrument self-test procedure can indicate “no errors”, even when the size classification capabilities of the sampler is compromised.
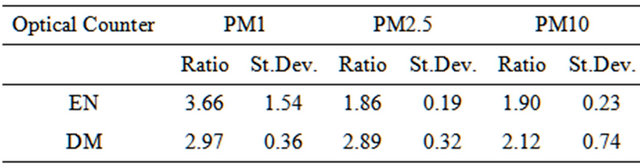
In addition, since these instruments could be used to assess the environmental aerosol fractions (PM1, PM2.5 and PM10), a comparison between particle number and particle mass concentrations was undertaken. This could be done only for EN and DM counters, because GR and PS counters do not give particle number and mass distribution simultaneously. The particle mass distribution was computed from the particle number size distribution for all tests and aerosols by considering spherical and unity density particles.
Figure 8 shows the ratio between the measured PMx fractions given by the two counters (size-segregated according to the environmental particle fractions) and the computed mass concentrations (9 tests considered).
Table 2 summarizes the ratio between measured and computed PMx fractions. Since this ratio is related to the particle density, the computed and measured mass concentrations become equivalent by assuming an average particle density of about 1.9 for EN (excluding PM1 fraction) and about 2.7 for DM. The comparison with data published by Tuch et al. [12] gave a value of around 1.6 g∙cm−3; Morawska et al. [13] gave a derived density ranging from 1.2 to 1.8 g∙cm−3 (comparison between TEOM and SMPS), while Burkart et al. [14] reported an instrument-specific factor of 2.8 for GR 1.108 to calculate mass concentration from particle number size distribution.
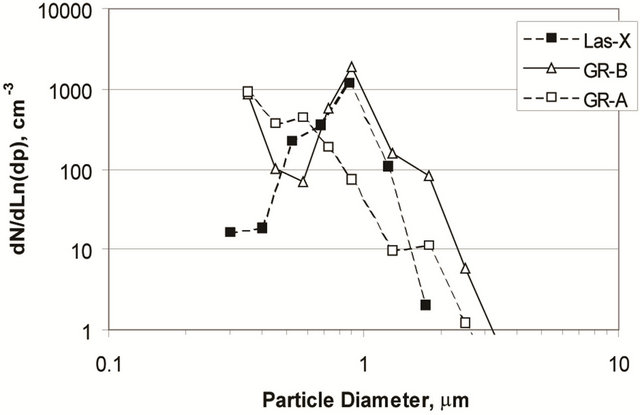
Figure 7. Particle size distribution obtained with GR and LAS-X. Particle diameter: (1.00 ± 0.08) mm. GR-A means before maintenance and GR-B after maintenance.

Figure 8. Ratio between measured and computed PMx fractions for the EN and DM counters. Bars show one standard deviation.
Table 2. Averaged particle number mass ratio obtained during the tests with different monodisperse particle class ranges for EN and DM. For EN only size channels larger than 0.3 µm were considered.
4. Summary and Conclusions
The results show a comparable total particle concentration number for all the counters, if the count of the first size channel 0.3 - 0.4 µm, for the Grimm 1.108 counter is excluded. The GR counter always showed much higher particle counts for this channel. The over count was proven by the fact that the aerosol sampled in each test on a Nuclepore filter showed no particles in the 0.3 - 0.4 µm range when examined under SEM. The presence of an artefact produced by the counter was supposed to be a likely explanation.
The CMDs of the aerosol size distributions were far below the expected value for all the counters, even taking into account the low size resolution of the DM and the PS instruments. The GR counter showed improbable CMDs values, and only by excluding the first size channel it was possible to obtain comparable CMDs with that of other counters. The nearest CMD value to the expected one was obtained by the Grimm 1.107 counter.
Since these counters could be used to assess the environmental aerosol fractions (PM1, PM2.5 and PM10), a comparison for EN and DM counters was performed between the particle mass concentration derived from the particle size distribution and the particle mass shown by the counters. The obtained ratio, which is related to an averaged particle density, is consistent with published data. GR and PS do not allow to get simultaneous measurements of aerosol number and mass concentrations.
In view of their widespread use in air quality programs, also in unattended mode, a check-kit for the instrument should be developed and provided to the users in order to guarantee reliability of the measured data. For example, a microscope slide with deposited calibrated particles could be supplied for periodical transfer into the optical chamber, thus allowing the comparison of the instrument’s output with reference values.
5. Acknowledgements
The Authors wish to thank Prof. M. Causà (Univ. of Naples), C. Giglioni (ConTec Engineering) and Prof. P. Prati (Univ. of Genova) for making their respective counters available for the tests. Special thanks to C. Colombi and V. Gianelle (ARPA-Milano) for the useful discussions, and to the Italian Aerosol Association (IAS).
REFERENCES
- J. Gebhart, “Optical Direct-Reading Techniques: Light Intensity Systems,” In: P. A. Baron and K. Willeke, Eds., Aerosol Measurement, Van Nostrand Reinhold, New York, 1993, pp. 313-344.
- B. T. Chen, Y. S. Cheng and H. C. Yeh, “Experimental Response of Two Optical Particle Counters”, Journal of Aerosol Science, Vol. 15, No. 4, 1984, pp. 457-464. doi:10.1016/0021-8502(84)90041-7
- H. Y. Wen and G. Kasper, “Counting Efficiencies of Six Commercial Particle Counters,” Journal of Aerosol Science, Vol. 17, No. 6, 1986, pp. 947-961. doi:10.1016/0021-8502(86)90021-2
- M. Heim, B. J. Mullins, H. Umhauer and G. Kasper, “Performance Evaluation of Three Optical Particle Counters with an Efficient ‘Multimodal’ Calibration Method,” Journal of Aerosol Science, Vol. 39, No. 12, 2008, pp. 1019-1031. doi:10.1016/j.jaerosci.2008.07.006
- A. Tittarelli, A. Borgini, M. Bertoldi, E. De Saeger, A. Ruprecht, R. Stefanoni, G. Tagliabue, P. Contiero and P. Crosignani, “Estimation of Particle Mass Concentration in Ambient Air Using a Particle Counter,” Atmospheric Environment, Vol. 42, No. 36, 2008, pp. 8543-8548. doi:10.1016/j.atmosenv.2008.07.056
- H. Grimm and D. J. Eatough, “Aerosol Measurement: The Use of Optical Light Scattering for the Determination of Particulate Size Distribution, and Particulate Mass, including Semi-Volatile Fraction,” Journal of Air Waste Management Association, Vol. 59, No. 1, 2009, pp. 101- 107. doi:10.3155/1047-3289.59.1.101
- V. Prodi, “A Condensation Aerosol Generator for Solid Monodisperse Particles,” In: T. T. Mercer, P. E. Morrow and W. Stoeber, Eds., Assessment of Airborne Particles, Charles C Thomas Publisher, New York, 1972, pp. 169- 181.
- V. Prodi and W. Mölter, “Temperature Characteristics of a Monodisperse Aerosol Condensation Generator, Aerosols: Formation and Reactivity,” Proceedings of the 2nd International Aerosol Conference, Berlin, 22-26 September 1986, pp. 1065-1068.
- Y. J. Yoon, S. Cheevers, S. G. Jenings and C. D. O’Dowd, “Performance of a Venturi Dilution Chamber for Sampling 3 - 20 nm Particles,” Journal of Aerosol Science, Vol. 36, No. 4, 2005, pp. 535-540. doi:10.1016/j.jaerosci.2004.10.004
- K. D. Horton, R. D. Miller and J. P. Mitchell, “Characterization of a Condensation-Type Monodisperse Aerosol Generator (MAGE),” Journal of Aerosol Science, Vol. 22, No. 3, 1991, pp. 347-363. doi:10.1016/S0021-8502(05)80012-6
- K. T. Whitby and B. Y. H. Liu, “Polystyrene Aerosols—Electrical Charge and Residue Size Distribution,” Atmospheric Environment, Vol. 2, No. 2, 1968, pp. 103- 116. doi:10.1016/0004-6981(68)90026-7
- Th. Tuch, E. Tamm, J. Heinrich, J. Heyder, P. Brand, Ch. Roth, H. E. Wichmann, J. Pekkanen and W. G. Kreyling, “Comparison of Two Particle-Size Spectrometers for Ambient Aerosol Measurements,” Atmospheric Environment, Vol. 34, No. 1, 2000, pp. 139-149. doi:10.1016/S1352-2310(99)00248-4
- L. Moraswka, G. Johnson, Z. D. Ristovski and V. Agranovski, “Relation between Particle Mass and Number for Submicrometer Airborne Particles,” Atmospheric Environment, Vol. 33, No. 13, 1999, pp. 1983-1990. doi:10.1016/S1352-2310(98)00433-6
- J. Burkart, G. Steiner, G. Reischel, H. Moshammer, M. Neuberger and R. Hitzenberger, “Characterizing the Performance of Two Optical Particle Counters (Grimm OPC1.108 and OPC1.109) under Urban Aerosol Conditions,” Journal of Aerosol Science, Vol. 41, No. 10, 2010, pp. 953-962. doi:10.1016/j.jaerosci.2010.07.007