Atmospheric and Climate Sciences
Vol. 2 No. 1 (2012) , Article ID: 17126 , 11 pages DOI:10.4236/acs.2012.21006
Using a Parafoil Kite for Measurement of Variations in Particulate Matter—A Kite-Based Dust Profiling Approach
1Institute of Soil Landscape Research, Leibniz-Centre for Agricultural Landscape Research (ZALF), Müncheberg, Germany
2Institute of Agricultural Environment and Sustainable Development,
Chinese Academy of Agricultural Science (CAAS), Beijing, China
3Institute of Earth and Environmental Science, University of Potsdam (UP), Potsdam, Germany
Email: *matthias.reiche@zalf.de
Received November 25, 2011; revised December 6, 2011; accepted December 17, 2011
Keywords: Grassland; Wind Erosion; Particular Matter; PM1; PM2.5; PM10; PM-Ratio
ABSTRACT
This paper reports on the use of a kite-based system for measuring low-altitude particulate matter (PM) concentrations over grassland in Inner Mongolia. The motivation came from PM-concentration measurements at heights below 3 m over non-erodible surfaces which showed constant concentrations and made flux calculations relatively uncertain. One aim was the quantification of wind-driven matter fluxes across ecosystem boundaries, where the relevant layer can be assumed at heights below 100 m. Compared to other measurement techniques (e.g. LIDAR, towers and airborne systems) kite-based systems represent an inexpensive, highly flexible research tool which is well-suited for application in remote sites. The basis of the introduced system is a 4 m2 Parafoil kite which has enough lifting capacity to carry equipment of about 6 kg at wind velocities between 3 ms–1 to nearly 20 ms–1. A self-adjusting platform was constructed to balance moves and to carry a portable Environmental Dust Monitor (EDM), anemometer and a GPS receiver. So, all parameters necessary for a vertical profile of dust fluxes could be measured. In the first flights the applied kite-based dust profiling system (KIDS) was examined according to general technical application problems. Firstly, the influence of diverse surface characteristics, the flying condition and height-stability was tested. The result suggests that surface characteristics in general have a higher influence than the optimal wind velocity, which ranged from 9 ms–1 to 17 ms–1. Secondly, uncertainties in the measured data were quantified and assessed. The uncertainties in wind velocity measurements due to motion in horizontal and vertical direction were not higher than 0.45% - 0.65% and 1.8% - 2.2% during the kite ascent. The outcome of the study illustrates the suitable application of KIDS for low-altitude measurements in remote sites.
1. Introduction
Wind erosion is the main process of dust emission in arid and semi-arid environments [1]. Major source regions which are significant for the global dust budged are located in northern Africa (Sahara desert) [2] and around the Arabian Sea [3]. In Central and East Asia, the Taklimakan desert and the Gobi desert are major sources which gradually expanded during the last decades because of increasing desertification [4,5]. In the recent past, large regions of temperate grasslands were also affected by wind erosion. China’s Inner Mongolia grassland steppe has been a natural sink for dust from far away from sources for centuries [6], but the use of the grassland steppe and the increasing human population led to effects of land degradation and severe reduction of the grassland coverage [7,8] and consequently, an increase of desertification processes. As a result, parts of the temperate steppe grassland changed from a sink to a source area for dust [9].
The high atmospheric dust load transported out of source regions is linked to climate and environmental influences and potential health risks [10]. These impacts are not limited to the dust source and its surroundings, but spread out over large distances. Dust storms and strong winds over Central and East Asia carry huge masses of particulate matter eastward to southern parts of China and Taiwan [11,12], to Korea [13,14], Japan [15] or overseas, e.g. to Canada [16]. Bearing in mind the considerable impact of current global dust mobilization influencing vast inhabited regions, it becomes increasingly important to investigate dust composition and transport at different heights (mixing zone).
So far, particulate matter emissions caused by wind erosion were primarily observed near ground by flux or deposition measurements. Methods of aeolian sediment measurements include wind aspirated dust samplers like Modified Wilson and Cook (MWAC) [9] and Big Spring Number Eight (BSNE) [17]. Furthermore, capyr (capteur pyramidia) samplers [18], pans filled by glass marbles [9] and the Frisbee method [19] are additional techniques for wind erosion measurements. But these measurements observed near ground are not always able to distinguish local from regional or supra-regional dust transport, since changing topographical conditions may cause a fall out of particles before they reach higher altitudes, leading to deposition. Therefore, measurements near the ground can (significantly) vary compared to measurements in the higher atmosphere. It is important to determine which particles are actually transported over large distances or even remain in the atmosphere due to their specific mass size to settle velocity relation.
In recent years, new measurement techniques or established dust measurement devices combined with new tools allowed the quantification of particulate matter fluxes in the higher atmosphere. The light detection and ranging technology (Lidar) [20,21] is quite expensive to purchase and rather inflexible due to design, construction and size. Lidar is also limited by high dust concentrations since these can prevent that the laser beam goes through the whole filled dust atmospheric layer. This difficulty is compounded by the fact that even with newer Lidar devices the functional range begins at about 100 m. The previously-used masts or towers can reach some decameters of height, but are even more inflexible [22]. Besides these measurement techniques and tools the use of kites represents an excellent research tool for kite-based dust profiling due to a variety of benefits compared to the above-mentioned techniques.
Kite-based experiments have a long history in atmospheric research [23-25]. Initially, the application of kites focused on vertical profiling of meteorological variables like temperature, pressure or humidity. By its dependence on (sufficient) wind and the development of new technologies (zeppelins, aircrafts, balloons) the importance of kite-based measurements decreased from the early 1930s onwards. But the practical application of kites has recently regained importance by the invention of new kite-types [26]. These kites (e.g. sled kites) have decisive advantages over other measurement techniques. Kite design and material have constantly been improved making the kites extremely sophisticated, light and resistant. Furthermore, the use of kites as carrier for measurement devices is comparatively cost efficient, as kites are highly mobile, easy to handle, and flexible with regard to the research assignment. Reference [27] also provides a detailed comparison of atmospheric sampling techniques (kites, balloons, aircrafts and towers)—their advantages and disadvantages in terms of sampling height, system costs, weather dependency, payload, vertical profiling, and required wind conditions.
Due to these beneficial characteristics kites are increasingly used in various research fields. As a new research tool kite-based aerial photography [28,29] was applied in geomorphology and archaeology [30,31]. In biology, kites were used for trapping insects [32] or to investigate the transport of fungal spores over long distances in large plumes of smokes from biomass fires [33]. New applications in meteorology can be found in [27, 34,35], who used kites to construct vertical profiles of temperature, humidity and atmospheric ozone abundance from the lower atmospheric boundary layer (LABL) up to several kilometers in the free atmosphere or to investigate the thermodynamic characteristics and their temporal variation of alpine lake breezes [36].
In the last decade, kites became also relevant in aeolian research. The use of kites in wind erosion research seems appropriate, because there is always sufficient wind and problems may arise rather by to high wind velocities. One of the first studies was published by [37,38] who has taken vertical dust profiles to determine dust concentration. The results were used to calibrate satellite products. Altogether, kite studies concerned with dust composition measurements in the lower atmospheric boundary layer (LABL) are still rare, but due to the beneficial characteristics of kites and ongoing technical developments of dust measuring devices (lightweight and portable Environmental Dust Monitor) the application of kites as research tool becomes even more attractive.
The main objective of this study was testing the application of a Parafoil kite as carrier of an investigation system (KIDS = kite-based investigation dust profiling system) for dust measurements and characteristics, to investigate vertical dust profiles at landscape level. This includes 1) optimizing the flight of KIDS, 2) testing the height-stability of the kite influenced by turbulence over different surface conditions (topography), 3) quantifying uncertainties resulting from horizontal and vertical movements of the kite system and 4) comparing the benefits of kite usage in aeolian research to other advanced measurement tools. Finally, 5) a first measurement result of a low-altitude dust profile will be presented to demonstrate the applicability of KIDS to determine particulate matter concentration and composition at different average heights up to 50 m.
2. Method and Material
2.1. Experimental Site
The study was carried out as part of the Sino-German project Matter fluxes in Grassland of Inner Mongolia as influenced by stocking rate (MAGIM). The experimental sites are located 50 km around the Inner Mongolia Grassland Ecosystem Research Station (IMGERS, 43˚33'N, 116˚40'E) in the Xilingol steppe grassland, 450 km north of Beijing and 70 km south of Xilinhot, the autonomous province of Inner Mongolia. The semi-arid steppe grassland is a transition zone and predominantly a sink for huge amounts of dust transported by strong winds from sources several hundred kilometers wind-ward of the grassland (e.g. Gobi desert). The grassland increasingly becomes a source region for atmospheric dust through high grazing intensity and the ongoing transformation into arable land. Advantages of the location which make the region well-suited for KIDS are the steady wind velocities ranging from 5 ms–1 up to 20 ms–1 and the occurrence of strong winds and dust storms (<20 ms–1) during the months of March to May. In the area for the kite flights, there are no shrubs and trees and it ranges from hilly (test site) to open and mostly flat landscape without significant topographical interruptions which experience a relatively undisturbed wind field on ground (profile data capture). Also, the experimental site has a poor infrastructure and thus the anthropogenic influence (dust emission by car traffic) is relatively low.
2.2. Specification of KIDS and Experimental Design
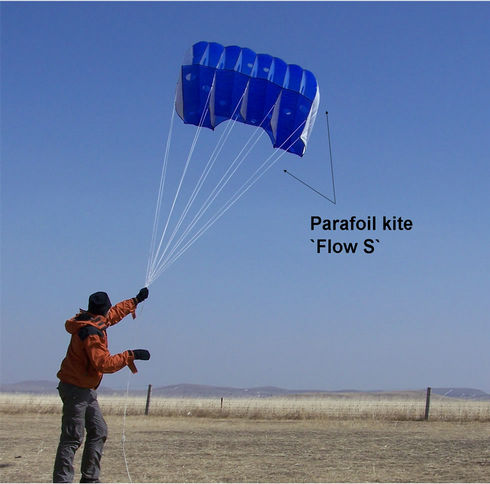
Parafoil kites are available in different sizes with a sufficient spectrum between lifting capacity and safe and easy handling. The kite type used in this study is a sled kite, named Flow S (“Kite n Art” Company, Rastede, Germany). It is 160 cm × 120 cm in size and has an effective kite-surface of about 4 m2 (Figure 1(a)). A system of eight contiguous cells provides steady flight conditions. The kite-sail material is standard rip stop spinnaker nylon, the tension line material is polyester (braided) with a line diameter of 3 mm. The breaking strain is denoted with 330 kg (maximum safety of tension line). Fundamentals of kite performances and dynamics, i.e. the major forces which act on the flying kite, are described by [39-41].
The measuring platform was constructed to keep and protect the technical equipment (Figure 1(b)). It combines minimum weight and high stability and is made of an aluminum box (25 cm × 13 cm × 8 cm) to cover the Environmental Dust Monitor (EDM). The box has four short curved legs for shock prevention and double-sided arms where micro-anemometers with loggers are mounted. On the top of the box a metal cross of 50 cm × 50 cm is attached to connect the box with the tension line over a flexibility suspension system. The kite platform is fixed by an ingenious flexible suspension system to the tension line to ensure a stable horizontal position for accurate dust and wind measurements at any time regardless of gusts, small deviation of the main wind direction or changes in the angle of inclination of the tension line. The total KIDS weight in use is 5.7 kg including the kite (0.48 kg), tension line (100 m = 1 kg), lightweight aluminum platform with legs and arms (1.2 kg), EDM including battery and sensor (2.57 kg), GPS (0.21 kg) and two anemometers with data logger (each 0.14 kg).
The tension force of the kite makes safety instructions for successful operation necessary. From wind speeds above 5 ms–1 it is nearly impossible to pull the line, but pressing down the line for landing the kite is comparatively easy.
 (a)
(a)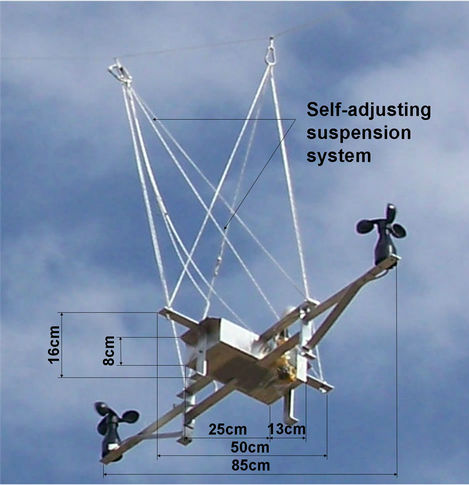 (b)
(b)
Figure 1. Parafoil kite (a) in starting position and (b) platform connected by a self-adjusting suspension system to the tension line.
A sketch of the experimental setup is illustrated in Figure 2. Along the main wind direction four anchors of 50 cm in length are fixed in the ground. The kite line (tension line) is fastened at the upwind anchor, laid out with its maximum length and fixed at all other anchors by snap-hooks. The distances between the anchors determine the later average height steps. The kite system is launched by unlocking the tension line from the snaphooks.
2.3. Data Acquisition and Quantification of Uncertainties
To determine the influence of the topographic effects on the height-stability of the kite, wind velocity and height were measured during the kite flight. Two ultra-light cup anemometers (Thies Climate Company, Göttingen, Germany), each with a micro data logger (ESYS Company— irDAN®pulse, Berlin, Germany), recorded the wind velocity at a time-interval of 10 seconds. Both anemometers were installed at a distance of 40 cm from the centre of the platform (Figure 1(b)) to prevent disturbance of the wind velocity measurements by the aluminum house. At the same interval of 10 seconds, kite height and moves were measured by the global position system receiver (GPS, GPS 60TM, GARMIN Ltd., USA) and stored in a track-file.
Dust was measured with a portable Environmental Dust Monitor (EDM 107, GRIMM Aerosol Company, Ainring, Germany). The system allows simultaneous monitoring of three particulate matter classes. Its compact size (23 cm × 11 cm × 6 cm), low weight and shock resistance make it suitable for kite experiments. The EDM continuously analyses air samples at a rate of 1.2 liters per minute with a flow controlled pump. An induction pipe arranged that the sampled air is concentrically sucked in. Particles in the sampled air pass a laser light in front of a high resolution optical cell where they are classified into 31 different size classes ranging from 0.25 µm to 32 µm. The particle counts are grouped into three

Figure 2. Sketch of experimental setup for KIDS.
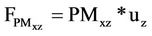
particulate matter classes: PM1, PM2.5, and PM10 as mass per volume (µg·m–3) at different time intervals which are predefined by the manufacture (6 seconds, 1 minute or 5 minutes). During the application of KIDS, the time interval of 6 seconds was selected for each measurement series (0.3 m) and both, height level 1 (~25 m) and level 2 (~50 m). The data are used to calculate the horizontal particulate matter flux FPMx (µg·m–2·s–1) with:
 (1)
(1)
where PMxz (µg·m–3) is the average particulate matter concentration of elements sized <1 µm (PM1), 2.5 µm
(PM2.5) and 10 µm (PM10) and uz (ms–1) refers to the average wind velocity at each measurement height.
Additionally, the efficiency of the EDM was tested under field conditions at high wind velocities up to 23 ms–1. It was installed on a car and tested at different driving speeds, with samples at 6 second intervals. According to the producer’s declaration, the loss of particulate matter is smaller than 10% at wind velocities up to 12 ms–1. Due to the weather conditions in the catchment area with wind velocities of more than 20 ms–1 there are disagreements in the measured particulate matter concentration which are considered in the final data analysis. In practice at wind velocities up to 12 ms–1, the sampling efficiency of particulate matter has no significant variance (producer’s declaration). As can be seen from tests before the measurement device was used, the wind velocities between 12 to 17 ms–1 show an underestimation of 16% (±0.9) and velocities up to 23 ms–1 a value of 21% (±3.8).
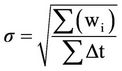
A crucial point of this study was to quantify the absolute uncertainties of measured wind data in the wind velocity and height position measurements. During the measurements with KIDS, the system is permanently in motion. These motions are ups and downs resulting from turbulences caused by surface characteristics (e.g. flat to hilly terrain) or smooth changes in the wind direction. Uncertainties by motion of applied KIDS can be divided in vertical and horizontal uncertainty of wind velocity (uver and uhor). Position changes were recorded by the GPS receiver. Firstly, the absolute uncertainty of the wind velocity was calculated by neglecting the kite-system motion. It is assumed that the system position is stable. The standard deviation of horizontal and vertical moves based on the use of the square root of weighted sample variance which is calculated as follows:
 (2)
(2)
where t (s) is the time interval recorded by the GPS receiver and data logger and wi describes both, the weighted standard deviation of wind velocity (wuSD) and height (wzSD). In this case wuSD is calculated by:
 (3)
(3)
and wzSD is:
 (4)
(4)
where xy (m) is the square root of added differences in Gauss Krueger Coordinates (GKR² and GKH²), t (s) is the time interval, u (ms–1), z (m) the wind velocity and flying height in each interval and zav (m) is the average height of KIDS in level 1 and level 2 (~25 m and 50 m).
Secondly, at the same time upand downward motions also have to be taken into consideration. This leads to absolute uncertainties in wind velocity (uver) due to fluctuations in the altitude. The wind velocity and flying height of the kite-system were measured and can be described as uz by an average logarithmic wind profile, which is defined as:
 (5)
(5)
where u (ms–1) is the wind velocity at height (z in m) according to GPS and k is the von Kármán constant of 0.41. In addition, the equation also allowed the calculation of the friction velocity u star (ms–1) and the roughness length (z0 in m). The average absolute error of wind velocity uncertainty (SDu in ms–1) due to fluctuations in the vertical (uver) at measurement level 1 and 2 were calculated by the undisturbed logarithmic wind profile each subtracted by logarithmic wind profile (z – σWzSD) and logarithmic wind profile (z + σWzSD), added and divided by 2.
Thirdly, assuming that σ in Equation (1) is the absolute uncertainty in wind velocity by neglecting the moves of the kite system, the magnitude of horizontal wind (uhor) scaled with the uncertainty. So, the relative uncertainty in %-values for uhor is the result of Equation 2 divided by the average wind velocity (uav). Contemporaneously, the relative uncertainty for uver arises from the result of Equation 5 divided by the average wind velocity (uav) for both measured levels in ~25 m and ~50 m height.
3. Results
3.1. Optimization of the Kite System
First test flights were undertaken with a dummy load with the same weight as the platform, in order to test the flight characteristics of the Parafoil kite. The main focus was set on the interaction between wind velocity, height stability of the kite and arrangement of the load. The dummy load was later replaced by the KIDS construction. It was essential to test the flight characteristics for a successful operation of KIDS.
The test results revealed that fast reactions of the kite corpus on fluctuations in wind velocity and direction and the inertia effect of the load influence each other in increasing horizontal movements. In order to stabilize the platform and decrease vibrations, the platform was constructed in a way that the system always remains in horizontal position relative to the ground. This was achieved by a self-adjusted suspension system fixed on four points on each end of the metal cross (Figure 1(b)). The suspension system joins the tension line at two fixation points. As a result, the platform is held constantly in horizontal position (no rotation, swing or twisting) regardless of ups and downs, changing direction or the angle of the tension line.
Reference [42] simultaneously determined both, the sensitivity and the inclined flow of a cup anemometer. It shows that an angle of attack up to 10 degrees and emerging turbulence caused measuring errors of up to 10%. This 10 degree threshold was not exceeded due to the use of a self-adjusting suspension system.
Furthermore, the testing and calibration showed that the distance between the bridle point of the kite and the fixation point of the load (Figure 3) influences the vertical movements at a relatively steady wind velocity. The inclination of the kite (angle α) decreased if the distance was too short. This influenced the relationship of the aerodynamic forces in that the kite surface area flattens and higher wind pressure is necessary for upward lifting. Test flights further confirmed that an insufficient fixation of the payload restrains a trigger for possible horizontal
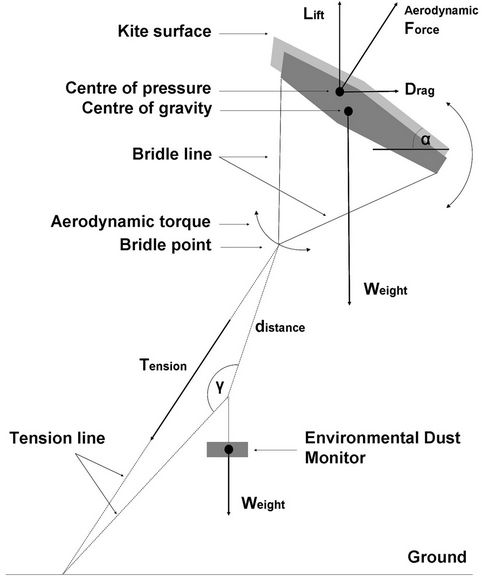
Figure 3. Simplified sketch of main forces acting on the kite including payload.
movements through the weight-related inertia. An optimal relation between the distance and weight load reduces the bend in the tension line, defined as angle (γ) between ground and platform fixation, and from the platform fixation to the bridle point of the kite (Figure 3). In this study, the optimal distance between bridle point and platform fixation was between 7 m to 9 m with a load of approximately 6 kg.
3.2. Topographic Situations and Their Effects on the Kite Lifting
The atmospheric surface layer is dominated by mechanical and/or convective turbulences which are responsible for stable or unstable layer properties. Figure 4 shows the turbulence intensity (ti) as the quotient of the standard deviation of the wind velocity (σu) and the mean wind velocity of height (uz).
The turbulence intensity decreased with increasing height in smooth hilly terrain (profile 2, Table 1) by similar average wind conditions (uav = 11.6 ms–1 (~32 m), 9.9 ms–1 (~45 m) to 10 ms–1 (~65 m)) in selected height levels. In flat terrain (test site = profile 1 as well as were KIDS was applied = profile 3, Table 1) the turbulence intensity was less widely scattered and remained almost constant over the height in comparison to profile 2 over hilly terrain. With regard to height stability turbulence intensity had a significant influence on vertical movements of the kite system. Differences in σz showed that the height stability is also influenced by varying terrain roughness (Table 1). High σz between 5.6 m (level 1) up to 11.8 m (level 3) for the smooth hilly terrain test site and lower σz between 1.8 m to 4.4 m in flat terrain was obtained for a flight height of about 50 m. Beyond (<80 m in profile 1) σz has also increased up to 10.1 m. In contrast, σuav almost always decreased with increasing flying height above all surface properties.
3.3. KIDS—First Data Presentation and Accuracy Assessment
The KIDS is always in motion. This has an effect on the data uncertainty (wind velocity) compared to fixed ground measurements. A comparison of the wind velocity data by the two used anemometers has been carried out. It was shown that the overall standard deviation in wind velocity (σu) was low with 0.4 ms–1 ranging from 2 ms–1 to 17 ms–1. Also, the absolute mean difference between both anemometers was higher at lower wind velocities (<10 ms–1) and vice versa (>10 ms–1). The uncertainties during the KIDS meassurements are shown in Table 2. By neglecting the kite movement, an absolute uncertainty of 1 sigma = 0.06 ms–1 in both measurement cycles at a flying height of ~25 m and 1 sigma = 0.09 ms–1 in ~50 m height was observed. With regard to this
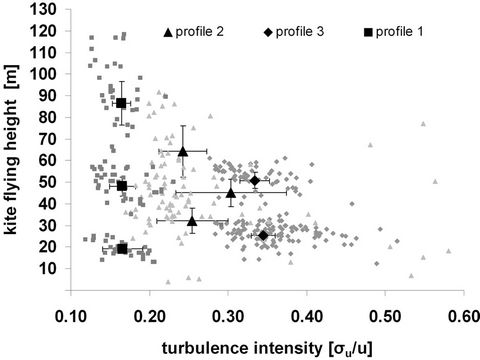
Figure 4. Profiles of turbulence intensity above flat and hilly terrain.
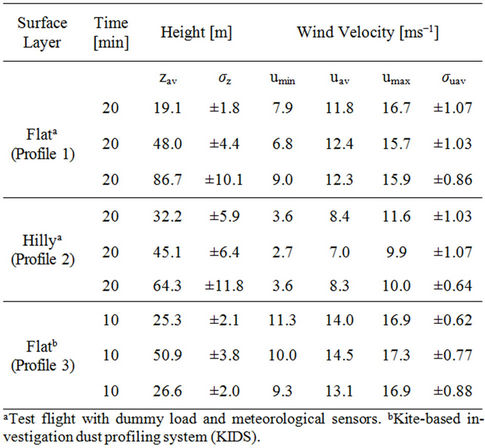
Table 1. Wind velocity with stability as standard deviation of height.
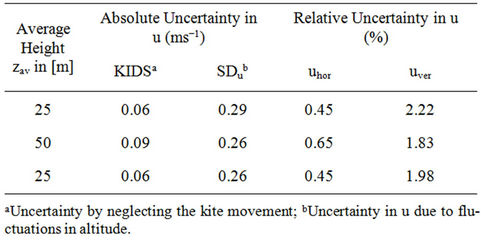
Table 2. Quantification of uncertainties of wind velocity at flying height.
absolute uncertainty the anemometer reacts to both horizontal (uhor) and vertical (uver) kite movements. The relative uncertainty in the wind velocity due to horizontal movements (uhor) shows values less than 1% and is quite similar in both selected flying heights. Contemporaneously, fluctuations in the wind velocity caused by vertical movements (uver) calculated over SDu showed generally higher values. However, these uncertainties around 2% are usually relatively small by a sigma in vertical movement of 4.02 m and 3.58 m at ~25 m and 7.26 m at ~50 m height (Table 2).
3.4. Measurement of Particle Size Composition
The investigation of particulate matter (concentration and composition) in different heights is important to determine upwardor downward-orientated dust fluxes and examine whether the emitted particles are transported in suspension or are on the way to deposition. The PM1, PM2.5 and PM10 concentrations and PM-ratio illustrated in Figure 5 are a first result of the application of KIDS. The temporal order of the results is equal to the chronology of the measuring cycles consisting of three measurements at ground level (starting position, 0.3 m)—two measurements at about 25 m (level 1) and one at about 50 m (level 2) height. During the monitoring period the particulate matter increased and the wind velocity decreased. This was observed in all three average measurement heights. The ratio between PM1 to PM10 (PM1:PM10) increased at measurement level 1 and 2. According to the data, the PM1 to PM10-ratio with an average of 0.12 at ground level, which are constant over the time at all three measurement cycles, increased to 0.29 in measurement level 1, and further relatively constant to level 2. The same applies for the PM2.5 to PM10-ratio.
The horizontal particulate matter flux of height (Fz), a function of dust concentration (µg·m−3) and wind velocity of height (uz), was calculated for each measurement cycle. During the operation of KIDS the concentration of PM10 varied (Figure 5). PM10 increased at ground level by 18%, whereas the wind velocity decreased from about ~8 ms–1 to ~5 ms–1. This is important to understand the big
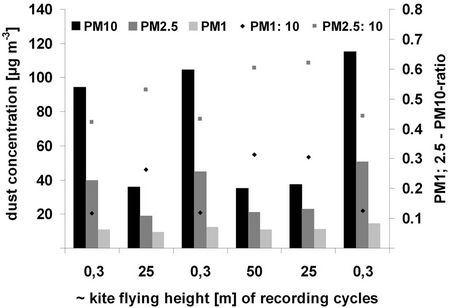
Figure 5. Dust concentration and trends in PM-ratios at low-altitude profiling.
differences in Fz at ground level from 720 (±55) µg·m–2·s–1, 583 (±43) µg·m–2·s–1 to 316 (±28) µg·m–2·s–1 from the beginning to the end of the kite ascent. However, higher above ground (level 1 and 2) Fz remained nearly constant with about 500 µg·m–2·s–1 (503 (±28), 498 (±24) on ~25 m and 512 (±28) on ~50 m) regardless of the transport intensity close to the ground. The standard deviation σF shows a decrease with increasing height.
4. Discussion
4.1. Advantages and Disadvantages
Decisive advantages of the application of kites are their easy handling, uncomplicated and flexible use, high mobility, and quick assembly and disassembly. Kites can be used in a wide range of wind velocities up to 20 ms−1 and higher, depending on the kite size and type and load to carry. In addition to highly sophisticated dust measurement techniques and aids like towers [8,22] or LIDAR [20,21], kites represent an alternative in remote areas and for short-term measurements since they are less expensive but offer similar effectiveness. The overall costs of the kite-based dust profiling system (KIDS) presented in the study were less than 200 Euros including both, kite and tension line as well as costs for material to construct the platform and anchors (measurement devices excluded). New kite designs (form, size and material) have enhanced the lifting capacity and improved the aerodynamic characteristics. In particular, the congestion-sled kite (e.g. Parafoils) has an efficient lifting surface and can carry a considerable payload relative to its size.
In this study, a Parafoil kite with a lifting surface of only 4 m–2 was used to carry a payload of about 6 kg. Tests of aerodynamic properties [32,35] showed that the Parafoil kite-type generally provides the best lifting capacity/coefficient. Despite their small size (pack size) they possess a large surface area which makes them suited for use in remote areas (e.g. large steppes and wasteland areas). In contrast to kites, monitoring towers are limited to the sampling area and in flexibility. Other measurement techniques like LIDAR are flexible, but require additional transport opportunities and supporting equipment. Further, they are limited to rather low dust concentrations. Kites are neither limited to one place, nor do they require further transport capacities. They enable quick and easy dust profile measurements at different locations with little effort and in a short period of time. This is particularly interesting for our study, since currently an increasing number of hotspots are developing due to the high grazing intensity. In our experiment it took less than 30 minutes to assemble and disassemble the whole kite system and carry it to another measurement site. There is practically always sufficient wind. The last advantage of kite measurements is the uncomplicated kite-navigation which requires only a small amount of manpower.
Apart from the above-mentioned advantages, there are also some drawbacks of kite-based approaches. As reference [27] states, kites are not all-weather systems. They are highly wind-dependent and require a minimum wind velocity to carry the payload. At the same time however, extreme wind conditions, e.g. strong (dust) storms or convective air flow hinder optimal kite flying. Another drawback is that the exact altitude cannot be precisely controlled over a relief surface that alternates in its structure. Tests show that the flight behavior is directly linked to the surface layer. The hilly area caused strong air turbulence which influenced the flying of the kite and lead to altitude fluctuations. Also, the net weight of the platform and the measurement devices influenced flight behavior and changed the operation of forces acting on the kite surface (Figure 3).
Altogether, kites as a tool to carry measuring equipment have been promoted. In combination with the measurement devices as presented in this study, KIDS offers individual and attractive opportunities for further development and applications. Strong arguments are the low price of the kite as a tool as well as the flexibility of one-man handling. In addition, it guarantees rapid data sampling in different places in less time. More practice is necessary if the air flow pressure is too strong than is found during wind velocities higher than 20 ms–1. In this case the kite was pressed down already in starting position and it took great effort to launch or it was not even possible to launch it.
4.2. Uncertainty Assessment
The most important factor to launch a kite is an adequate wind velocity of the air flow. Consequently, rotations and oscillations of the kite and KIDS and their influence on the detected wind data and dust collection cannot be completely excluded. The interaction between grounds (topography), wind field layer, and kite flying characteristics cause measurement uncertainties. In this context, the cup anemometers installed on the kite platform constitute an uncertainty factor. Their high sensitivity to even the slightest horizontal deviations in position can lead to measurement errors [26,43]. But the use of small anemometers with cup diameters of 4 cm had a positive effect on the mechanical inertia. They reduced over-speeding in ascent and under-speeding in descent. Thereby, measurement errors were minimized.
The results generally show that the uncertainties are still in this study. Turbulence and resulting eddies close to the ground, especially the low-altitude kite profiling, induce upand downward movements during the kite flying. From this it follows that the kite altitude can vary up to one decameter and higher even above undulating surface, as is shown in Table 1. The sketched turbulence (Figure 4) shows that they have a greater influence on height stability than differences in the wind velocity. It indicates the influence of the surface characteristics and helps to demonstrate where KIDS can be securely applied. Optimal kite flying characteristics, including high stability of kite movements, were measured over flat, grass-covered topography up to ~50 m height at wind velocities between 8 ms–1 and 17 ms–1 (Table 1). Additionally, the smaller version of the kite used in this study (4 m2) will work better (more conveniently) in low altitudes and guarantee an increased height-stability.
The whole KIDS moves constantly in both the horizontal and vertical direction. This fact, and the uncertainty in the determination of the correct kite-position through the GPS receiver, leads to an uncertainty in wind velocity less than 1% in the horizontal and around 2% in both heights in the vertical (Table 2).
4.3. Low-Altitude Dust Profiling—A First Result
The study provides a first result of the quantitative assessment in the lower atmospheric boundary layer (LABL) over grassland steppe in Inner Mongolia in windy spring season. The dust concentrations decrease with height, whereas the PM1,2.5: PM10-ratio increase (Figure 5). Under the given conditions we expected to find a higher concentration of greater and heavier PM10 particles near ground (in the first few meters). Despite the decreasing turbulence intensity (ti, Figure 4) with height the relationship between PM1: PM10-ratio of 1:3 between measurement level 1 and level 2 was nearly constant. This example clarifies that the particles which have reached a certain height remain there. Finally, it could be possible that the fine dust particles (PM1) are transported from far away. The steady state conditions (no change in surface characteristics and vegetation roughness length) and an exact determination in u, and u star at the moment of the measurement demonstrate that the particles stay in emission for a long period of time. This can also be obvious from the calculated matter flux with the flying height. The particulate matter flux above ~25 m and ~50 m shows the same average values. Underneath, the dust layer is well mixed (less PM1: PM10-ratio) influenced directly by the ground. In this case the measured matter fluxes near ground indicate a dry deposition at the sampling site during the experiment.
Moreover, the proportion of PM1: PM10 can be used to distinguish dust events from non-dust events [44]. In the vertical the PM1: PM10-ratio shows, that a separation of PM1 and PM10 takes place which is demonstrated by the ratio at ground level with a stronger mix of suspended particulate matter in both, level 1 and level 2. These measurements also suggest that the particle size of the emitted dust particles and their gravitational settling velocity in the air correspond with u star [45]. Also, it is possible to quantify the particulate matter flux. The calculation of dust fluxes requires information about the dust concentration and the wind velocity for a given average height range. Starting with 1.7 ms–1 directly above ground (0.3 m, starting position) over measurement level 1 (~25 m height) the wind velocity followed the logarithmic increase curve up to a maximum wind velocity of 17.3 ms–1 on measurement level 2 (~50 m height).
5. Summary and Conclusions
The use of kites has a long history in scientific research. Decisive factors for the renaissance of this tool are innovations in design and kite technology. Kites possess advantages over other dust profiling techniques and devices. They are highly flexible, cost-effective, compact in size, portable and easy to handle with a minimum of manpower. Kites do not require time-consuming assembly and disassembly and can therefore be used to measure dust profiles in different places in a short period of time without any extra costs for transport. Due to these benefits, kites, in combination with the latest dust measurement techniques (e.g. EDM 107 by Grimm techniques), are well-suited for dust profiling in remote areas without heavy air traffic.
This paper presents the test of a small-size Parafoil kite. The study closes a gap of low-cost methods to perform low-altitude dust profiles in the lower atmospheric boundary layer (LABL). Apart from a large number of beneficial characteristics, the experiment also revealed possible drawbacks and uncertainties of the applied kite system (KIDS). A priority existed in the uncertain assessment during the kite flight and its influence on the sampled data. Although the analysis suggests that the uncertainties are small, they have to be considered in the final data evaluation.
Reducing uncertainties of data capture, especially in wind velocity is an interesting issue for further studies. Alternatively, the application of other wind velocity measurement devices (e.g. a speed sensor) which are used in paragliding can be directly connected to the Environmental dust monitor. The modification of sensors offers the potential to reduce uncertainties in wind velocity measurements with anemometer usages, whereby a horizontal position of the kite-based platform no longer has to be guaranteed. Further experimental studies are necessary to find out more about the mass-size distribution influenced by wind velocities near ground level compared to low-altitudes and further higher layers in the LABL. Dry dust deposition or the possibility of the PM-particles to staying in the atmosphere for a long time has to undergo further examination. This is also of particular interest in defining the particulate matter composition, distribution or its separation from local emissions and emissions far away from the sampling site.
6. Acknowledgements
This study was funded by the DFG (Deutsche Forschungsgemeinschaft, research group 536) and is part of the Sino-German research project MAGIM: Matter fluxes in Grassland of Inner Mongolia as influenced by stocking rate. We are grateful to Susann Richter and Stephan Metzger for helping comments.
REFERENCES
- R. Arimoto, “Eolian Dust and Climate: Relationships to Sources, Tropospheric Chemistry, Transport and Deposition,” Earth-Science Reviews, Vol. 54, No. 1, 2001, pp. 29-42. doi:10.1016/S0012-8252(01)00040-X
- D. Yaalon, “Comments on the Source, Transportation and Deposition of Saharan Dust to Southern Europe,” Journal of Arid Environments, Vol. 36, No. 1, 1997, pp. 193-196. doi:10.1006/jare.1996.0231
- P. Pease, P. Vatche, N. Tchakerian and N. Tindale, “Aerosols over the Arabian Sea: Geochemistry and Source Areas for Aeolian Desert Dust,” Journal of Arid Environments, Vol. 39, No. 3, 1998, pp. 477-496. doi:10.1006/jare.1997.0368
- J. Lim and Y. Chun, “The Characteristics of Asian Dust Events in Northern Asia during the Springtime from 1993 to 2004,” Global and Planetary Change, Vol. 52, 2006, pp. 231-247. doi:10.1016/j.gloplacha.2006.02.010
- T. Y. Tanaka and M. A. Chiba, “A Numerical Study of Contributions of Dust Source Regions to the Global Dust Budget,” Global and Planetary Change, Vol. 52, No. 1-4, 2006, pp. 88-104. doi:10.1016/j.gloplacha.2006.02.002
- W. Yanfen, H. Zuozhong, H. Dehua and H. Jianmei, “Study on Dust Deposition in Xilin River Basin,” Acta Phytoecologica Sinica, Vol. 24, No. 6, 2004, pp. 693-696.
- B. Li, “Grassland Degradation and Its Prevention Measures in China’s North Area,” Science Press, Beijing, 1999, pp. 383-391.
- X. Zhao, H. Zhao, X. Zuo, Y. Luo, S. Wang, Z. Kou and H. Qu, “Restoration of Desertified Grassland and Challenges in Northern China for the Possibility of Sustained Desertification Reversion,” Multifunctional Grassland in a Changing World, Guangdong People’s Publishing House, Guangzhou, Vol. 1, 2008, pp. 720-724.
- C. Hoffmann, R. Funk, R. Wieland, Y. Li and M. Sommer, “Effects of Grazing and Topography on Dust Flux and Deposition in the Xilingele Grassland, Inner Mongolia,” Journal of Arid Environments, Vol. 72, No. 5, 2008, pp. 792-807. doi:10.1016/j.jaridenv.2007.09.004
- T. Sandstrom and B. Forsberg, “Desert Dust and Unrecognized Source of Dangerous Air Pollution?” Epidemiology, Vol. 19, No. 6, 2008, pp. 808-809. doi:10.1097/EDE.0b013e31818809e0
- J. Cao, S. Lee, X. Zheng, X. Ho, X. Zhang, H. Guo, J. C. Chow and H. Wang, “Characterization of Dust Storms to Hong Kong in April 1998,” Water, Air, and Soil Pollution, Vol. 3, No. 2, 2003, pp. 213-229. doi:10.1023/A:1023202926292
- C. Liu, C. Young and Y. Lee, “Influence of Asian Dust Storm on Air Quality in Taiwan,” Science of Total Environment, Vol. 388, No. 2-3, 2006, pp. 884-897. doi:10.1016/j.scitotenv.2006.03.039
- H. In and S. Park, “A Simulation of Long-Range Transport of Yellow Sand Observed in April 1998 in Korea,” Atmospheric Environment, Vol. 36, No. 26, 2008, pp. 4173-4187. doi:10.1016/S1352-2310(02)00361-8
- B. Lee, H. Lee and N. Jun, “Analysis of Regional and Temporal Characteristics of PM10 during an Asian Dust Episode in Korea,” Chemosphere, Vol. 63, No. 7, 2006, pp. 1106-1115. doi:10.1016/j.chemosphere.2005.09.001
- H. Lee, T. Tanaka, M. Chiba and Y. Igarashi, “Long Range Transport of Asian Dust from Dust Storms and Its Impact on Japan,” Water, Air, and Soil Pollution, Vol. 3, No. 2, 2003, pp. 231-343. doi:10.1023/A:1023254910362
- C. Zdanowicz, G. Hall, J. Vaive, Y. Amelin, J. Percival, I. Girand, P. Biscaye and A. Bory, “Asian Dust Fall in the St. Elias Mountains, Yukon, Canada,” Geochimica et Cosmochimica Acta, Vol. 70, No. 14, 2006, pp. 3493-3507. doi:10.1016/j.gca.2006.05.005
- D. W. Fryrear, “A Field Dust Sampler,” Journal of Soil and Water Conservation, Vol. 41, No. 2, 1986, pp. 117- 120.
- J.-L. Rajot, “Wind Blown Sediment Mass Budget of Sahelian Village Land Units in Niger,” Bulletin de la Société Géologique de France, Vol. 172, 2001, pp. 523-531. doi:10.2113/172.5.523
- M. Sow, D. Goossens and J.-L. Rajot, “Calibration of the MDCO Dust Collector and of Four Versions of the Inverted Frisbee Dust Deposition Sampler,” Geomorphology, Vol. 82, No. 3-4, 2006, pp. 360-375. doi:10.1016/j.geomorph.2006.05.013
- C. Mückel, N. Eresmaa, J. Räsänen and A. Karppinen, “Retrieval of Mixing Height and Dust Concentration with Lidar Ceilometer,” Boundary Layer Meteorology, Vol. 124, No. 1, 2007, pp. 117-128. doi:10.1007/s10546-006-9103-3
- D. Van der Kamp, I. G. McKendry, M. Wong and R. Stull, “Lidar Ceilometer Observation and Modelling of a Fireworks Plume in Vancouver, British Columbia,” Atmospheric Environment, Vol. 42, No. 30, 2008, pp. 7174- 7178. doi:10.1016/j.atmosenv.2008.06.047
- Z. Dong, D. Man, W. Luo, G. Qian, J. Wang, M. Zhao, S. Liu, G. Zhu and Z. Zhu, “Horizontal Aeolian Sediment Flux in the Minqin Area, a Major Source of Chinese Dust Storm,” Geomorphology, Vol. 116, No. 1, 2010, pp. 58- 66. doi:10.1016/j.geomorph.2009.10.008
- B. B. Balsley, J. B. Williams, G. W. Tyrrell and C. L. Balsley, “Atmospheric Research Using Kites: Here We Go Again!,” Bulletin American Meteorological Society, Vol. 73, No. 1, 1992, pp. 17-30. doi:10.1175/1520-0477(1992)073<0017:ARUKHW>2.0.CO;2
- C. Hart, “Kites: An Historical Survey,” 2nd Edition, Mount Vernon, New York, 1982.
- G. J. Jenkins, “Kite Meteorology,” Weather, Vol. 26, 1981, pp. 294-301.
- A. S. Smedman, K. Lundin, H. Bergström and U. Högstrom, “A Precision Kite or Balloon-Borne Mini-Sonde for Wind and Turbulence Measurements,” Boundary-Layer Meteorology, Vol. 56, No. 3, 1991, pp. 295-307. doi:10.1007/BF00120425
- B. B. Balsley, M. L. Jensen and R. G. Frehlich, “The Use of State-of-Art Kites for Profiling the Lower Atmosphere,” Boundary-Layer Meteorology, Vol. 87, No. 1, 1998, pp. 1-25. doi:10.1023/A:1000812511429
- S. Haefner, “Kite Aerial Photography,” 2003. http://scotthaefner.com/kap/equipment/ ?page=rig
- S. M. Smith, J. Chandler and J. Rose, “High Spatial Resolution Data Acquisition for the Geosciences: Kite Aerial Photography,” Earth Surface Processes and Landforms, Vol. 34, No. 1, 2008, pp. 155-161. doi:10.1002/esp.1702
- J. Boike and K. Yoshikawa, “Mapping of Periglacial Geomorphology Using Kite/Balloon Aerial Photography,” Permafrost and Periglacial Processes, Vol. 14, No. 1, 2003, pp. 81-85. doi:10.1002/ppp.437
- B. Owen, “An Archaeologist Uses Kite Aerial Photography,” 2006. http://bruceowen.com/kap/kap.htm
- R. A. Farrow and J. E. Dowes, “Method of Using Kites to Carry Tow Nets in Upper Air for Sampling Migrating Insects and Its Application to Radar Entomology,” Bulletin Environment Research, Vol. 74, 1984, pp. 87-95. doi:10.1017/S0007485300009950
- S. A. Mims and F. M. Mims, “Fungal Spores Are Transported Long Distances in Smoke from Biomass Fires,” Atmospheric Environment, Vol. 38, No. 5, 2004, pp. 651- 655. doi:10.1016/j.atmosenv.2003.10.043
- M. J. Varley, “The Use of Kites to Investigate Boundary Layer Meteorology,” Meteorology Application, Vol. 4, 1997, pp. 151-159. doi:10.1017/S1350482797000431
- B. B. Balsley, J. W. Birks, M. L. Jensen and K. G. Knapp, “Vertical Profiling of the Atmosphere Using High-Tech Kites,” Environmental Science and Technology, Vol. 28, No. 9, 1994, pp. 422-427. doi:10.1021/es00058a002
- H. A. McGowan, I. F. Owens and A. P. Sturman, “Thermal and Dynamic Characteristics of Alpine Lake Breezes, Lake Tekapo, New Zealand,” Boundary-Layer Meteorology, Vol. 76, No. 1, 1994, pp. 3-24. doi:10.1007/BF00710888
- G. McTanish, G. Y. Chan, H. A. McGowan, J. Leys and K. Tews, “The 23rd October 2002 Dust Storm in Eastern Australia: Characteristics and Meteorological Conditions,” Atmospheric Environment, Vol. 39, No. 7, 2005, pp. 1227-1236. doi:10.1016/j.atmosenv.2004.10.016
- H. A. McGowan and A. Clark, “A Vertical Profile of PM10 Dust Concentration Measured during a Regional Dust Event Identified by MODIS Terra Western Queensland, Australia,” Journal of Geophysical Research, Vol. 113, No. 2, 2003, Article ID: F02S03.
- NASA (National Aerodynamics and Space Administration), “Kites,” 2011. http://www.grc. nasa.gov/www/k-12/airplane/ kit1.html
- G. Sànchez, “Dynamics and Control of Single-Line Kites,” The Aeronautical Journal, Vol. 9, 2006, pp. 615-621.
- J. Stevenson, K. Alexander and P. Lynn, “Kite Performance Testing by Flying in a Circle,” The Aeronautical Journal, Vol. 9, 2006, pp. 605-614.
- O. Deiss, F. Lackmann, C. Hilling and F. Kameier, “Influence of Turbulence in Wind Measurement,” 2001. http://ifs.muv.fh-duesseldorf.de/Veroeffentlichungen/veroeffentlichung_lackmann_deiss.pdf
- E. I. Kaganov and A. M. Yaglom, “Errors in Wind-Speed Measurements by Rotation Anemometers,” Boundary- Layer Meteorology, Vol. 10, 1976, pp. 10-34. doi:10.1007/BF00218722
- C. Hoffmann, R. Funk, M. Sommer and Y. Li, “Temporal Variations in PM10 and Particle Size Distribution during Asian Dust Storms in Inner Mongolia,” Atmospheric Environment, Vol. 42, No. 36, 2008, pp. 8422-8431. doi:10.1016/j.atmosenv.2008.08.014
- L. J. Hagen, S. VanPelt, T. M. Zobeck and A. Retta, “Dust Deposition Near an Eroding Source Field,” Earth Surface Processes and Landforms, Vol. 32, No. 2, 2007, pp. 281-289. doi:10.1002/esp.1386
NOTES
*Corresponding author.