Journal of Diabetes Mellitus
Vol. 2 No. 4 (2012) , Article ID: 24602 , 9 pages DOI:10.4236/jdm.2012.24061
Comparison of the fatty acid composition of the serum phospholipids of controls, prediabetics and adults with type 2 diabetes*
![]()
1Department of Biotechnology, Yuanpei University, Hsinchu, Taiwan
2Department of Biochemistry and Molecular Biology, University of New Mexico, Albuquerque, USA; #Corresponding Author: vshah@salud.unm.edu
3Department of Internal Medicine, School of Medicine, University of New Mexico, Albuquerque, USA
4Department of Pharmacy Practice and Administrative Sciences, College of Pharmacy, University of New Mexico, Albuquerque, USA
Received 14 July 2012; revised 12 August 2012; accepted 22 August 2012
Keywords: Pre-Diabetes; Type 2 Diabetes; Fatty Acids; Phospholipids; Fluidity
ABSTRACT
Objective: Although abnormalities in the fatty acid composition of serum and red cell membrane phospholipids of patients with type 2 diabetes are well-documented, lacking are studies of this issue in prediabetic individuals. Materials/Methods: For this cross-sectional study, we recruited 180 subjects (30 - 80 years), 56 of whom were normal with regard to glucose control (HbA1c, <5.7%), 61 who had prediabetes (HbA1c, 5.7% - 6.4%) and 59 who had type 2 diabetes (HbA1c, >6.5%). Serum phospholipids were isolated and analyzed for fatty acids. Results: Most importantly, the fatty acid compositions of the controls and prediabetic subjects were not different for 19 fatty acids. However, the fatty acid profile of the phospholipids of the patients with diabetes differed from the other two groups; the 14 to 18-carbon saturated fatty acids were decreased by 12% - 26% whereas the unsaturated fatty acids 16:1n-7, 18:1n-9, 18:2n-6, 20:3n-6 and 20:4n-6 were increased by 45% - 64%. Of note, the docosahexaenoic acid (DHA) status of individuals in all three study groups was remarkably low compared with international values, as indicated by DHA proportions in the 1.62% - 2.07% range, and there were no differences between groups. The mean melting point of the phospholipid fatty acids of the diabetic patients (32.2˚C) was significantly lower (p < 0.001) than that of the prediabetic subjects (38.1˚C) and the controls (39.9˚C) which were not different from each other. Conclusion: These observations indicate that the fatty acid changes associated with type 2 diabetes follow the onset of the disease as opposed to being a causative factor of poor glucose control and insulin insensitivity.
1. INTRODUCTION
The incidence of type 2 diabetes mellitus has increased markedly over the past several decades in most regions of the world, but nowhere has this increase been greater than among populations living in the US Southwest [1], especially American Indians. There is growing interest in the metabolic changes that occur in prediabetes which is the intermediate condition between normal glucose homeostasis and the hyperglycemia of type 2 diabetes [2]. The main characteristics of prediabetes are elevated fasting blood glucose and impaired glucose tolerance which is strong risk factor for type 2 diabetes. Prediabetes has a strong association with the metabolic syndrome and thus is presumed to be a risk factor for heart disease and mortality [3]. It is important to identify prediabetes so that measures such as modest weight loss, increased physical activity and dietary changes can be taken to reduce the risk of developing type 2 diabetes.
The fatty acids that comprise the phospholipids of cellular membranes are important determinants of the structure, properties and functions of those membranes, including hormone binding, intracellular signaling, enzyme activity and solute transport. Alterations in the fatty acid composition of serum and membrane phospholipids have been reported in individuals with type 2 diabetes [4-8]. For example, Patel and coworkers [4] observed strong positive associations between the proportions of myristic acid, palmitic acid (16:0), palmitoleic acid (16:1n-7) and dihomo-gamma linolenic acid in plasma phospholipids of patients with type 2 diabetes [4-8]. In contrast, these same investigators found negative associations between these same two parameters were noted for vaccenic acid (18:1n-7), linoleic acid (18:2n-6) and DHA (22:6n-3). Pelikanova and associates [5] found increased proportions of arachidonic acid (20:4n-6) but decreases in γ-linolenic acid in the serum phospholipids of patients with type 2 diabetes. Hodge and colleagues [7] observed positive associations between stearic acid in plasma phospholipids and type 2 diabetes but an inverse association for γ-linolenic acid.
The fatty acid composition of serum phospholipids is determined in large measure by dietary intake and hepatic synthesis [9]. Furthermore, the fatty acid composition of serum phospholipids reflects qualitative fatty acid intake over the past several months and is considered a valuable means of assessing habitual qualitative dietary intake [4]. It is widely believed that informed control of the fatty acid content of the diet dietary composition could play a significant role in improving insulin sensitivity and reducing the risk and complications of type 2 diabetes [10-12]. In 1993, Borkman and associates [13] demonstrated that in healthy adult males an increase in the proportion of polyunsaturated fatty acids in muscle membrane phospholipids was associated with an increase in insulin sensitivity. In contrast, the fasting serum insulin concentration, which is a measure of insulin resistance, was negatively correlated with the percentage of individual long-chain polyunsaturated fatty acids (e.g., arachidonic acid, 22:5n-6, 22:5n-3) in the phospholipid fraction of muscle of normal males and patients with coronary disease.
A remarkable aspect of the nutrition of populations in New Mexico, not only American Indians but Hispanics and Non-Hispanic whites (NHW) as well, is their low intake of seafood that is rich in very long-chain omega-3 polyunsaturated fatty acids such as eicosapentaenoic acid (EPA, 20:5n-3) and docosahexaenoic acid (DHA, 22:6n- 3). This assertion rests on several observations: first, the median daily intake of DHA by women in New Mexico is just 30 mg, which is much below the 200 - 300 mg/day recommended for women [14,15]. Furthermore, the proportion of DHA in the milk of American Indian, Hispanics and NHW women in New Mexico [14,16] is only about one-fourth that recommended by several international expert panels [17]. In addition, the percentage of DHA in the serum phospholipids of newborns (i.e., cord blood) and mothers at the time of delivery is at the low end of the range of values reported for mother-baby pairs elsewhere in the world [18].
Adequate intake of EPA and DHA and other very long-chain, highly unsaturated fatty acids has been associated with numerous health benefits in humans [19]. These include enhanced cognition in infants and young children [20,21], and a reduction in the risk of cancer and cardiovascular disease [22,23]. However, studies of the proportion of DHA in the serum, red cell membranes or liver of individuals with type 2 diabetes versus healthy controls have not found significant differences in the proportion of DHA between these two groups [24-29].
The aims of the present study were two-fold. First, we wanted to know if the marginal DHA status of the inhabitants of New Mexico might lead to alterations in the proportions of DHA in the serum phospholipids of patients with type 2 diabetes in our community. Our second aim was to investigate relations between fatty acid status, as assessed by the fatty acid composition of serum phospholipids, and various parameters related to insulin function and glucose metabolism in healthy adults (HbA1c < 5.7%) versus individuals who are pre-diabetic (HbA1c, 5.7% - 6.4%) or who have had long-standing type 2 diabetes (HbA1c ≥ 6.5%). We hypothesized that if abnormalities in the fatty acid composition of the serum phospholipids of insulin-sensitive tissues were a cause rather than a consequence of diabetes, then the fatty acid composition of the serum phospholipids of prediabetics with an elevated fasting plasma glucose concentration and HbA1c value in the 5.7% - 6.4% range should differ from that of the control group.
One way to address these possibilities is to compare the serum fatty acids of phospholipids of healthy adults and individuals who are prediabetic. To our knowledge, while the literature is replete with reports of the relations between fatty acid nutrition and type 2 diabetes, there are few fatty acid-related studies that have involved individuals who were in the prediabetic state according to the guidelines of the American Diabetes Association [30].
2. MATERIALS AND METHODS
2.1. Methods
2.1.1. Description of Subjects
The protocol was approved by the Human Subject Research Review Committee of the University of New Mexico Health Sciences Center. Informed written consent was obtained from all volunteers. Volunteers between 30 and 80 years of age were recruited from established patients attending a primary care clinic of the University of New Mexico Health Sciences Center, Albuquerque, NM after reviewing the clinic medical charts of individuals who had previously visited the clinic. HbA1c values were used to classify subjects as controls (<5.7%), prediabetics (5.7% - 6.4%) or type 2 diabetics (>6.5%). Subjects in the prediabetes category had no previous diagnosis of prediabetes or type 2 diabetes and had never been treated with insulin or oral agents for diabetes. Subjects included in the type 2 diabetes category had an established diagnosis of type 2 diabeteswere treated with oral agents and/or insulin, and had no history of ketoacidosis.
Information regarding pertinent medical history, demographics, current medications, and alcohol and tobacco use was obtained by means of a questionnaire administered by a member of the research team. A blood sample was obtained from each subject by venipuncture and collected in a serum-separating tube for the determination of HbA1c, glucose, creatinine, albumin, total protein, uric acid, and lipids. The subjects also provided a urine sample for the measurement of creatinine and microalbumin. Height, weight and blood pressure were also measured. Clinical chemistry measurements were performed at the Tricore Reference Laboratories, Albuquerque, NM using clinical diagnostic assays certified by the Clinical Laboratory Improvement Amendments (CLIA) of the Centers for Medicare and Medicaid Services.
2.1.2. Fatty Acid Analyses
An aliquot (0.10 mL) of serum was extracted using chloroform/methanol (2:1, v/v) according to the method of Folch et al. [31]. The extracted lipid residue was dried at 50˚C under a stream of nitrogen. The total phospholipids of serum were isolated by silicic acid thin-layer chromatography [32]. After scraping the phospholipid fraction from the plate, fatty acids were transesterified to produce methyl esters using 14% (w/v) boron trifluoride in methanol and heating at 95˚C for 20 min [32]. Triheptadecanoin (Sigma, St. Louis, MO, USA) was added prior to methylation and served as the internal standard.
Fatty acid methyl esters were quantified using a gas chromatograph (6890N, Agilent Technologies, Sunnyvale, CA) equipped with an auto injector, a split/split less capillary injection system, a flame ionization detector, and a fused silica column (Omegawax; 30 m × 0.32 mm, i.d., film thickness 0.25 um, Supelco, Bellefonte, PA, USA) as described elsewhere [33]. A commercial fatty acid mixture consisting of methyl ester standards, including AA and DHA, (Nu-Check Prep, Elysian, MN, USA) was used to identify peaks and determine response factors for integration with a Chem DataStation (Agilent Technologies, Sunnyvale, CA).
2.1.3. Mean Melting Point Calculation
MMP was calculated according to the method described by Holman et al. [34,35] and Jensen and Patton [36]. Briefly, the individual melting point fractions (MPF) were calculated by multiplying the mol% by each fatty acid’s melting point plus 100 (MP = 100). The sum of the MPF minus 100 yields the MMP of the fatty acid mixture. The MMP was calculated using only the following major serum phospholipid fatty acids and the melting points indicated in parentheses: 16:0 (63˚C), 18:0 (69˚C), 18: 1n-9 (13˚C), 18:2n-6 (−5˚C), 20:3n-6 (−40˚C), 20:4n-6 (−49˚C), 22:0 (80˚C), and 22:6n-3(−44˚C).
2.2. Statistics
Data are presented as the mean ± 1 standard deviation except for variables with a non-normal distribution that are presented as the median (minimum-maximum). Descriptive statistics, group comparisons and correlation analyses were carried out using NCSS (NCSS version 2006, Statistical System for Windows, Kaysville UT). Data for male and female subjects were pooled because no significant differences were found between the two groups for the percentages of plasma phospholipids. A p value ≤ 0.05 was considered as significant.
3. RESULTS
3.1. Comments regarding the Study’s Participants
A total of 176 subjects were enrolled in the study: 56 subjects were in the control group; 61 in the prediabetes group and 59 in the type 2 diabetes group. Of all the participants in the study, 70% were female, 51% white, 40% Hispanic, and 9% other. In the control group, 68% were white, 29% Hispanic and 2% Asian. Sixty-one percent of individuals with prediabetes were white, 26% Hispanic, 2% American Indian and 10% Asian. Of the patients with type 2 diabetes, 31% were white, 58% Hispanic 5% American Indian and 8% Asian.
With regard to controls versus the prediabetic group, there were significant differences between the groups in systolic blood pressure, p = 0.005, but no differences in BMI, triglycerides, total cholesterol or HDL (Table 1). On the other hand, there were significant differences in BMI (p < 0.001), systolic blood pressure (p = 0.001), triglycerides (p = 0.007) and HDL (p < 0.001) between the control subjects and patients with type 2 diabetes; however, there were no differences in total cholesterol or LDL-cholesterol.
3.2. Fatty Acid Composition of Serum Phospholipids
The most important result of the present study was the observation that the fatty acid composition of the serum phospholipids of prediabetic individuals who were classified as such on the grounds of an elevated HbA1c value and abnormal fasting plasma glucose concentration was not statistically different from that of the controls (Table 2); the percentage of none of the 19 fatty acids was different between the controls and prediabetic subjects. In
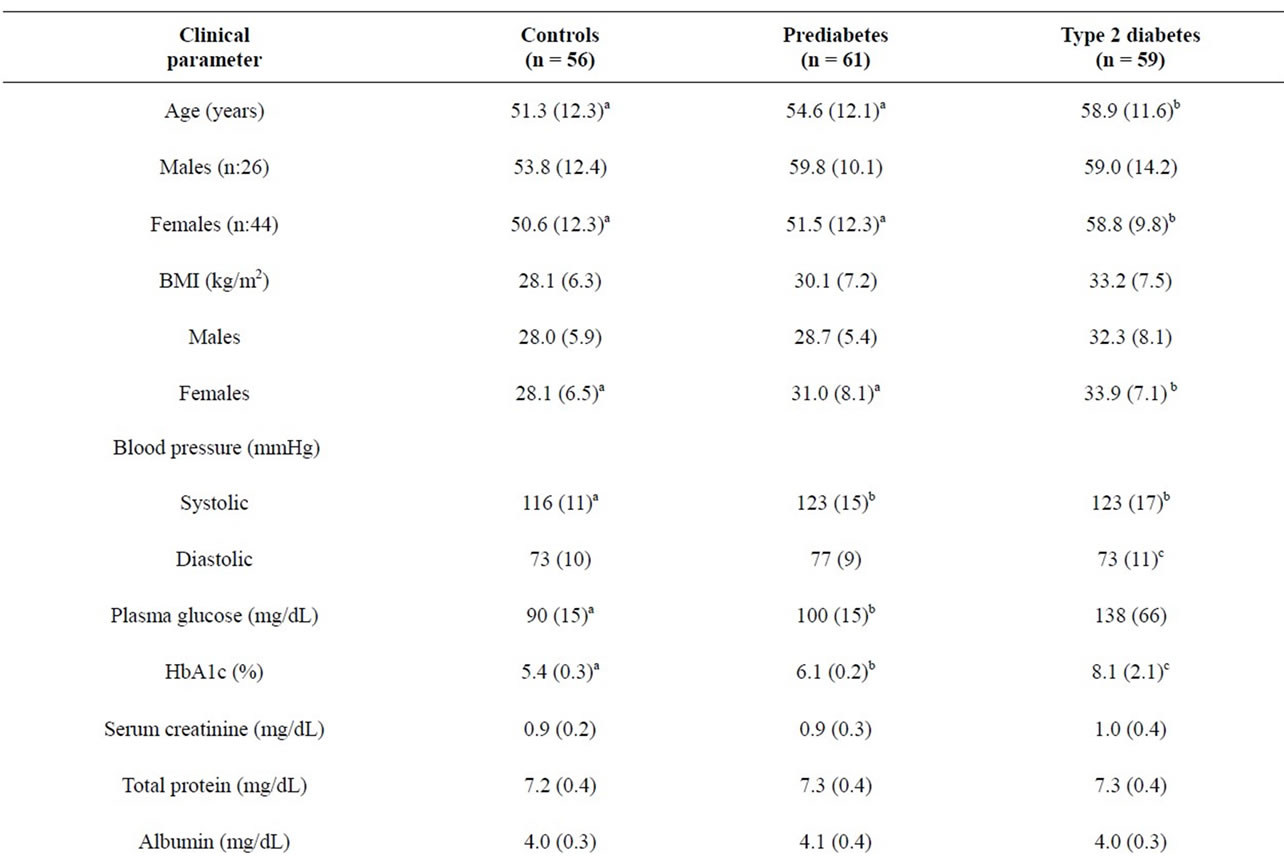
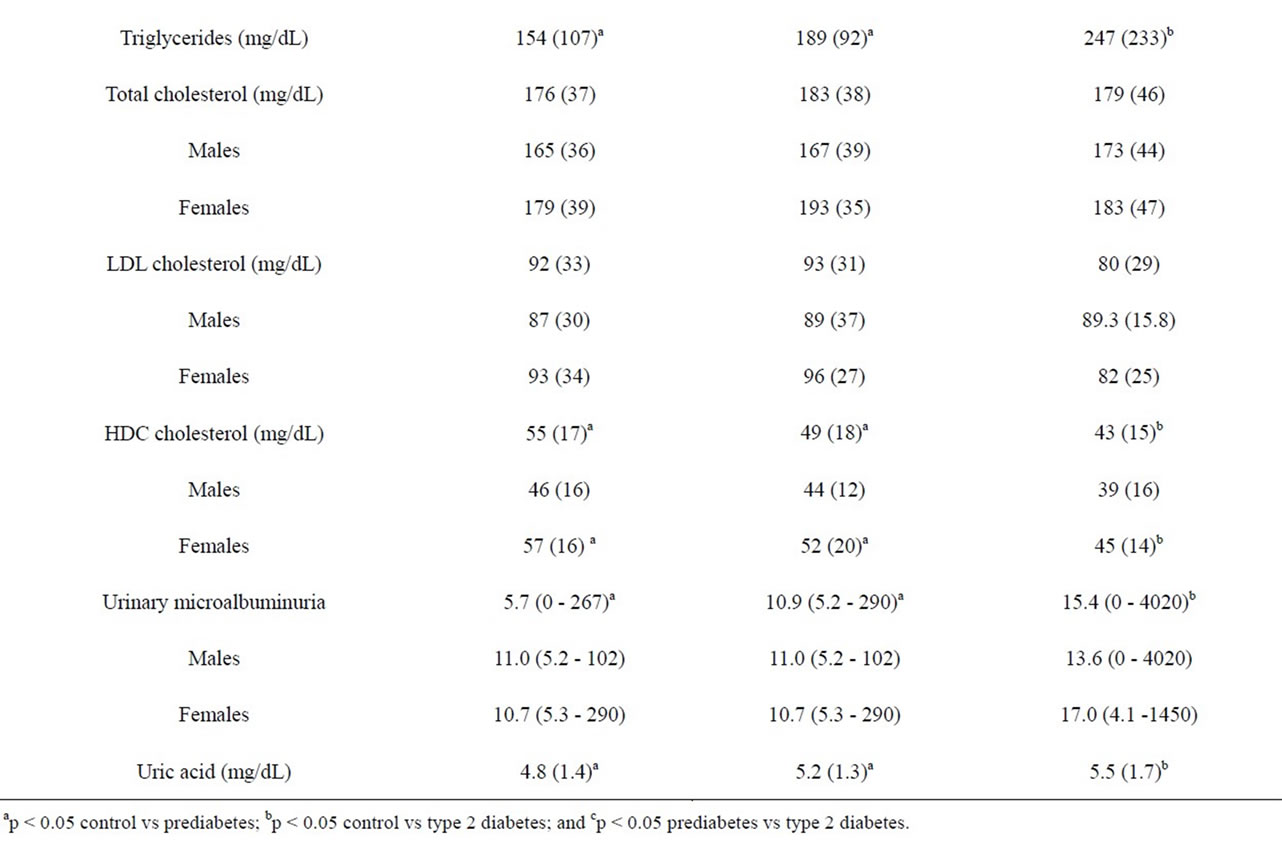
Table 1. Clinical characteristics of study participants-Mean (± SD) or median (min-max).
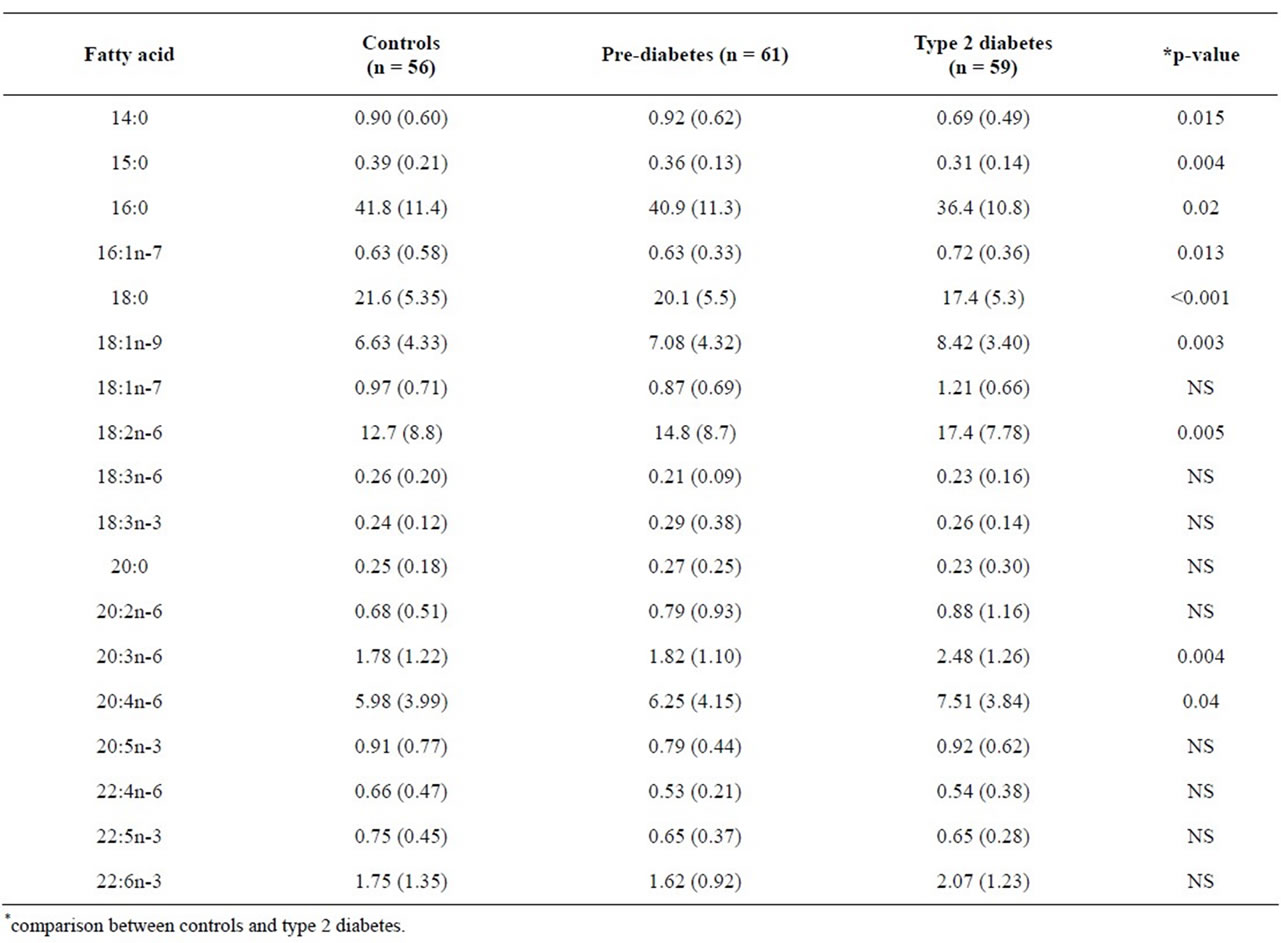
Table 2. Fatty acid composition (weight %) of total serum phospholipids-Mean (± SD).
contrast, the proportions of nine fatty acids in the serum phospholipids of the controls and patients with type 2 diabetes were different; in general, the saturated fatty acids comprised of 14 to 18-carbon atoms were decreased 12% - 26% relative to the controls and the prediabetic group whereas cis-vaccenic acid (16:1n-7), oleic acid (18:1n-9) and the long-chain polyunsaturated fatty acids dihomo-gamma-linolenic acid (20:3n-6) and arachidonic acid (20:4n-6) were increased by 47%, 50%, 64% and 52%, respectively. Noteworthy are the relatively low percentages of arachidonic acid in the serum phospholipids of the controls (5.98%), prediabetic subjects (6.25%) and patients with type 2 diabetes (7.51%) (Table 2) relatives to values reported for healthy adults in most studies which are in the 9% - 13% range [7,18].
3.3. Mean Melting Points
The magnitude of the shift from saturated fatty acids to more unsaturated fatty acids became evident when mean melting points of the of the phospholipids of the three groups were calculated using the melting points and mole percentages of the fatty acids. The small difference in MMPs between the controls (39.9˚C) and prediabetic subjects (38.1˚C) did not reach statistical significance; however, the MMP for the patients with type 2 diabetes (32.2˚C) did differ significantly from the MMP values of both the controls and prediabetic subjects (p < 0.001).
4. DISCUSSION
Borkman and colleagues [13] reported that the proportion of 20- and 22-carbon fatty acids in skeletal-muscle phospholipids was inversely correlated with hyperinsulinemia and insulin resistance. Specifically, they found that in patients with coronary artery disease and normal males the level of arachidonic acid, 22:4n-6, 22:5n-6 and 22:5n-3 correlated inversely with the fasting serum insulin concentration and positively with an index of insulin sensitivity derived from glucose-clamp measurements. Borkman and colleagues [13] acknowledged that the fatty acid differences they observed between insulinsensitive and insensitive subjects may be a marker for the effect of some unidentified factor that modulates insulin function and that the fatty acid changes could have been caused by insulin resistance.
The main finding of this study was the observation that the fatty acid composition of the serum phospholipids of the prediabetic group was statistically indistinguishable from the control group (Table 2). By comparison, the fatty acid composition of the serum phospholipids of the patients with type 2 diabetes differed significantly from that of the control group and the prediabetic group in 9 of 19 fatty acids. Other investigators have reported abnormalities in the fatty acid composition of serum or plasma phospholipids in type 2 diabetes [4,7,8].
However, although fatty acid abnormalities in phospholipid fatty acids have been associated with diabetes, there is disagreement regarding which fatty acids are underrepresented versus overrepresented relative to controls. For example, Patel and associates [4] in their study conducted in England found increases in the percentages of myristic acid (14:0), palmitic acid (16:0), alpha-linolenic acid (18:3n-3) and 20:3n-6 and decreases in linoleic acid (18:2n-6), 20:2n-6 and DHA (22:6n-3) in patients with type 2 diabetes. In contrast, however, we found myristic acid and palmitic acid to be decreased in the patients with diabetes. On the other hand, we and Patel and his associates are in accord with regard to differences in the percentages of palmitoleic acid (16:1n-7) and oleic acid (18:1n-9) which we both found to be increased in patients with type 2 diabetes. In a study conducted in Minnesota, Wang and coworkers [8] reported positive associations between diabetes and the percentages of palmitic acid, stearic acid and palmitoleic acid in plasma phospholipids and negative correlations for oleic acid, linoleic acid and α-linolenic acid. In a study carried out in Melbourne, Australia, Hodge and associates [7] reported increases in most fatty acids including stearic acid, palmitoleic acid, oleic acid, 20:3n-6, arachidonic acid, eicosapentaenoic acid (20:5n-3) and DHA in the plasma phospholipid fraction of patients with type 2 diabetes, with decreased percentages in only 15:0 pentadecylic acid and linoleic acid.
Since the fatty acid composition of a diet is a strong determinant of the fatty acid composition of tissues, red cell membranes and serum phospholipids, the apparent discrepancies among studies by investigators in different parts of the world could be due to the very different diets and baseline fatty acid status of the individuals in those studies. Illustrative of this point are the differences in the percentages of linoleic acid (11.8% versus 24.2%) and DHA (1.39% versus 4.63%) in the serum phospholipids of the control subjects in our study and that of Patel and colleagues [4], respectively. In light of the wide geographic and cultural differences in the fatty acid composition of the serum phospholipids of populations, it seems unlikely investigators will identify a particular fatty acid or constellation of fatty acids that will provide a marker for diabetes across diverse populations. However, our finding of significant increases in the percentages of 16:1n-7 and 20:3n-6 in the diabetes subgroup relative to the controls (Table 2) are in accord with data reported by Hodges and colleagues [7], and support there assertion that these fatty acids may be predictive of diabetes.
While the proportions of arachidonic acid we report for the serum phospholipids of the three subgroups in the present study are low, they are somewhat higher than the average arachidonic acid percentage of 5% we observed in a recent study, also conducted in New Mexico, of healthy pregnant women at delivery [18]. Our confidence in these relatively low arachidonic acid values rests on the fact that the fatty acid analyses in the present study were conducted by the same individual (L-TC) using the same analytical method employed in two other studies in which the arachidonic acid percentages were in the 11% - 13% range [37,38]. The relatively low arachidonic status of healthy adults in New Mexico may be explained in part at least by the unusual dietary habits of the population. Lacking in the literature are reference standards for serum long-chain polyunsaturated fatty acids.
Since the fatty acid composition of serum phospholipids reflect that of tissue phospholipids [34,39], our finding of a 7˚C difference between the mean melting point of the serum phospholipids of the controls and patients with type 2 diabetes in the present study indicates that the fluid characteristic of the cellular membranes of tissues in the diabetic subjects were abnormal. Such a large inferred change in the fluid properties of the membranes of the type 2 diabetic patients could adversely impact a variety of membrane-dependent physiologic processes, including insulin binding and signaling and the activities of membrane-associated transport proteins and enzymes.
Our study had several limitations. First, our experimental design was cross-sectional as opposed to the preferred longitudinal cohort study in which each individual serves as his or her own control. Second, we did not collect dietary data on the individuals we studied. Finally, we recognize and appreciate the fact that inter-individual variations in ethnicity, diet, medication use, exercise (lifestyle), smoking and other environmental exposures can influence the fatty acid composition of an individual’s serum phospholipids.
With regard to future studies, since there is considerable ethnic and cultural diversity in New Mexico and because the dietary habits and activity levels of these different groups vary widely, it will be useful to repeat this kind of study with well-defined, relatively homogeneous sub-populations in our region of the US employing a long-term longitudinal paradigm in which dietary information is secured. We also plan to extend our study to include the indigent population of Native Americans, including adolescents in the age range 12 - 18 years. Currently, one of the authors of the present report (VOS) is involved in a study (The Zuni Health Initiative) of community-based educational interventions in prediabetes. Zuni Indians are genetically an endogamous population in northwest New Mexico and one of the goals of that study is to evaluate longitudinally the levels of phospholipids in prediabetes in this population.
In conclusion, our finding suggest that the abnormalities in the fatty acid composition of serum phospholipids in type 2 diabetes are more likely to be the result of metabolic disturbances due to compromised insulin function rather than the cause of the metabolic dysfunction in individuals with this endocrine disorder.
5. ACKNOWLEDGEMENTS
This project was supported in part by an Innovative Pilot Grant from the National Center for Research Resources and the National Center for Advancing Translational Sciences of the National Institutes of Health (8UL1TR000041) and the University of New Mexico (UNM) Clinical and Translational Science Center. We also acknowledge support from grants from the National Center for Research Resources (5P20RR016480- 12) and the National Institute of General Medical Sciences (8P20GM103451- 12) of the NIH. The cost for clinical phenotyping and payments to participants was supported under a UNM Health Sciences Center-based Cardiovascular and Metabolic Diseases Signature Program. We are grateful for the assistance of Thomas VanderJagt, Quynh-Anh Bui, Joan Goldsworthy, Katharine Juarez and Anju Shah at UNMHSC who recruited participants and processed blood and urine specimens.
6. AUTHORS’ CONTRIBUTIONS
Chuang L.-T., PhD (Phospholipid methods and analytic laboratory work and writing the paper); Glew RH, PhD (Study design and writing the paper); Li C.-C., BS (Phospholipid methods and analytic laboratory work); VanderJagt D.J., PhD (Statistical analysis and writing the paper); Broyles JS, MD (Patient recruitment and clinical data and sample collections); Ray G.M., PharmD (Patient recruitment and clinical data and sample collections); and Shah V.O. (Study design, sample processing and archiving and clinical data analysis and writing the paper).
REFERENCES
- Centers for Disease Control and Prevention (2011) National diabetes fact sheet: National estimates and general information on diabetes and prediabetes in the United States. US Department of Health and Human Services, Atlanta. http://www.cdc.gov/diabetes/pubs/ pdf/ndfs_2011.pdf
- Grundy, S.M. (2012) Pre-diabetes, metabolic syndrome and Cardiovascular risk. Journal of the American College of Cardiology, 59, 635-643. doi:10.1016/j.jacc.2011.08.080
- Barr, E.L., Zimmet, P.Z., Welborn, T.A., et al. (2007) Risk of cardiovascular and all-cause mortality in individuals with diabetes mellitus, impaired fasting glucose, and impaired glucose tolerance: The australian diabetes, obesity, and lifestyle study (AusDiab). Circulation, 116, 151-157. doi:10.1161/CIRCULATIONAHA.106.685628
- Patel, P.S., Sharp, S.J., Jansen, E., et al. (2010) Fatty acids measured in plasma and erythrocyte-membrane phospholipids and derived by food-frequency questionnaire and the risk of new-onset type 2 diabetes: A pilot study in the European Prospective Investigation into Cancer and Nutrition (EPIC)-Norfolk cohort. American Journal of Clinical Nutrition, 92, 1214-1222. doi:10.3945/ajcn.2010.29182
- Pelikanova, T., Kazdova, L., Chvojkova, S. and Base, J. (2001) Serum phospholipids fatty acid composition and insulin action in type 2 diabetic patients. Metabolism, 50, 1472-1478. doi:10.1053/meta.2001.27195
- Perassolo, M.S., Almeida, J.C., Pra, R.L., et al. (2003) Fatty acid composition of serum lipid fractions in type 2 diabetic patients with microalbuminuria. Diabetes Care, 26, 613-618. doi:10.2337/diacare.26.3.613
- Hodge, A.M., English, D.R., O’Dea, K., et al. (2007) Plasma phospholipid and dietary fatty acids as predictors of type 2 diabetes: Interpreting the role of linoleic acid. The American Journal of Clinical Nutrition, 8, 189-197.
- Wang, L., Folsom, A.R., Zheng Z.J., Pankow J.S. and Exkfeldt, J.H. (2003) ARIC Study Investigators. Plasma fatty acid composition and incidence of diabetes in middle-aged adults: The Atherosclerosis Risk in Communities (ARIC) study. American Journal of Clinical Nutrition, 78, 91-98.
- Zeleniuch-Jacquotte, A., Chajes, V., Van Kappel, A.L., Riboli, E. and Toniolo, P. (2000) Reliability of fatty acid composition in human serum phospholipids. European Journal of Clinical Nutrition, 54, 367-372. doi:10.1038/sj.ejcn.1600964
- Riserus, U., Willett, W.C. and Hu, F.B. (2009) Dietary fats and prevention of type 2 diabetes. Progress in Lipid Research, 48, 44-51. doi:10.1016/j.plipres.2008.10.002
- Mann, J.I. (2006) Nutrition recommendations for treatment and prevention of type 2 diabetes and the metabolic syndrome: An evidence-based review. Nutrition Reviews, 64, 422-427. doi:10.1111/j.1753-4887.2006.tb00227.x
- Vessby, B., Tengblad, S. and Lithell, H. (1994) Insulin sensitivity is related to the fatty acid composition of serum lipids and skeletal muscle phospholipids in 70-yearold men. Diabetetologia, 37, 1044-1050. doi:10.1007/BF00400468
- Borkman, M., Storlien, L.H., Pan, D.A., Jenkins, A.B., Chisolm, D.J. and Cambell, L.V. (1999) The relation between insulin sensitivity and the fatty-acid composition of skeletal-muscle phospholipids. New England Journal of Medicine, 328, 238-244. doi:10.1056/NEJM199301283280404
- Glew, R.H., Wold, R.S., Corl, B., Calvin, C.D. and VanderJagt, D.J. (2011) Low docosahexaenoic acid in the diet and milk of American Indian women in New Mexico. Journal of the American Dietetic Association, 111, 744- 748. doi:10.1016/j.jada.2011.02.001
- Bergmann, R.L., Haschke-Becher, E., Klassen-Wigger, P., et al. (2008) Supplementation with 200 mg/day docosahexaenoic acid from mid-pregnancy through lactation improves the docosahexaenoic acid status of mothers with a habitually low fish intake and of their infants. Annals of Nutrition and Metabolism, 52,157-166. doi:10.1159/000129651
- Glew, R.H., Wold, R.S., Herbein, J.H., Wark, W.A., Martinez, M.A. and VanderJagt, D.J. (2008) Low docosahexaenoic acid in the diet and milk of women in New Mexico. Journal of the American Dietetic Association, 108, 1693-1699. doi:10.1016/j.jada.2008.07.006
- Smit, E.N., Martini, I.A., Kemperman, R.F., Schaafsma, A., Muskiet, F.A. and Boersma, E.R. (2003) Fatty acids in formulae for term infants: Compliance of present recommendations with the actual human milk fatty acid composition of geographically different populations. Acta Paediatrica, 92, 790-796. doi:10.1111/j.1651-2227.2003.tb02534.x
- Wolfe, M.D., Chuang, L.T., Rayburn, W.F., Wen, P.C., VanderJagt, D.J. and Glew, R.H. (2011) Low fatty acid concentrations in neonatal cord serum correlate with maternal serum. Journal of Maternal-Fetal Neonatal Medicine, 102, 10510-10517.
- Sahena, F., Zaidul, I.S.M., Jinap, S., Saari, N., Jahurul, H.A., Abbas, K.A. and Norulaini (2009) PUFAs in fish extraction, fractionation and importance in health. Comprehensive Reviews of Food Science and Food Safety, 8, 59-74. doi:10.1111/j.1541-4337.2009.00069.x
- Helland, I.B., Smith, L., Saarem, K., Saugstad, O.D. and Drevon, C.A. (2003) Maternal supplementation with verylong-chain n-3 fatty acids during pregnancy and lactation augments children’s IQ at 4 years of age. Pediatrics, 111, e39-e44. doi:10.1542/peds.111.1.e39
- Benatti, P., Peluso, G., Nicolai, R. and Calvani, M. (2004) Polyunsaturated fatty acids: Biochemical, nutritional and epigenetic properties. Journal of the American College of Nutrition, 23, 281-302.
- Balk, E.M., Lichtenstein, A.H., Chung, M., et al. (2006) Effects of omega-3 fatty acids on serum markers of cardiovascular disease risk: A systematic review. Atherosclerosis, 189, 19-30. doi:10.1016/j.atherosclerosis.2006.02.012
- Daniel, C.R., McCullough, M.L., Patel, R.C., et al. (2009) Dietary intake of omega-6 and omega-3 fatty acids and risk of colorectal cancer in a prospective cohort of US men and women. Cancer Epidemiology, Biomarkers & Prevention, 18, 516-525. doi:10.1158/1055-9965.EPI-08-0750
- Nkondjock, A. and Receveur, O. (2003) Fish-seafood consumption, obesity, and risk of type 2 diabetes: An ecological study. Diabetes and Metabolism, 29, 635-642. doi:10.1016/S1262-3636(07)70080-0
- Ruidavets, J.B., Bongard, V., Dallongeville, J., et al. (2007) High consumptions of grain, fish, dairy products and combinations of these are associated with a low prevalence of metabolic syndrome. Journal of Epidemiology and Human Health, 61, 810-817. doi:10.1136/jech.2006.052126
- Harding, A.H., Day, N.E., Khaw, K.T., Bingham, S.A., Luben, R.N., Welsh, A. and Wareham, N.J. (2004) Habitual fish consumption and glycated hemoglobin: The EPIC-Norfolk study. European Journal of Clinical Nutrition, 58, 277-284. doi:10.1038/sj.ejcn.1601779
- Adler, A.I., Boyko, E.J., Schraer, C.D. and Murphy, N.J. (1994) Lower prevalence of impaired glucose tolerance and diabetes associated with daily seal oil or salmon consumption among Alaska Natives. Diabetes Care, 17, 1498-1501. doi:10.2337/diacare.17.12.1498
- Feskins, E.J., Bowles, C.H. and Mulvad, G. (1991) Inverse association between fish intake and risk of glucose intolerance in normoglycemic elderly men and women. Diabetes Care, 14, 935-941. doi:10.2337/diacare.14.11.935
- Feskins, E.J., Virtanen, S.M., Rasanen, L., Tuomilehto, J., Stengard, J., Pekkanen, J., Nissinen, A. and Kromhout, D. (1995) Dietary factors determining diabetes and impaired glucose tolerance. A 20-year follow-up of the Finnish and Duthc cohorts of the seven countries study. Diabetes Care, 18, 1104-1112. doi:10.2337/diacare.18.8.1104
- Buysschaert, M. and Bergman, M. (2011) Definition of prediabetes. Medical Clinics of North America, 95, 289- 297. doi:10.1016/j.mcna.2010.11.002
- Folch, J., Lees, M. and Sloane-Stanley, G.H. (1957) A simple method for the isolation and purification of total lipids from animal tissues. The Journal of Biological Chemistry, 226, 497-509.
- Huang, Y.-S., Huang, W.C., Li, C.-W. and Chuang, L.-T. (2011) Eicosadienoic acid differentially modulates proinflammatory modulators in murine macrophages. Molecular and Cellular Biochemistry, 358, 85-94. doi:10.1007/s11010-011-0924-0
- Chuang, L.-T., Tsai, P.-J., Lee, C.-L. and Huang, Y.-S. (2009) Uptake and incorporation of pinolenic acid reduces n-6 polyunsaturated fatty acid and downstream prostaglandin formation in murine macrophages. Lipids, 44, 217-224. doi:10.1007/s11745-008-3276-0
- Holman, R.T., Johnson, S.B. and Kokmen, E. (1989) Deficiencies of polyunsaturated fatty acids and replacement by nonessential fatty acids in plasma lipids in multiple sclerosis. Proceedings of the National Academy of Sciences USA, 86, 4720-4724. doi:10.1073/pnas.86.12.4720
- Holman, R.T., Johnson, S.B. and Ogburn, P.L. (1991) Deficiency of essential fatty acids and membrane fluidity during pregnancy and lactation. Proceedings of the National Academy of Sciences USA, 88, 4835-4839. doi:10.1073/pnas.88.11.4835
- Jensen, R. and Patton, S. (2000) The effects of maternal diets on the mean melting points of human milk fatty acids. Lipids, 35, 1159-1161. doi:10.1007/s11745-000-0632-9
- Glew, R.H., Okolie, H., Huang, Y.S., Chuang, L.T., Suberu, O., Crossey, M. and VanderJagt, D.J. (2004) Abnormalities in the fatty-acid composition of the serum phospholipids of stroke patients. Journal of the National Medical Association, 96, 826-832.
- VanderJagt, D.J., Arndt, C.D., Okolo, S.N., Huang, Y.S., Chuang, L.T. and Glew, R.H. (2000) Fatty acid composition of the milk lipids of Fulani women and the serum phospholipids of their exclusively breast-fed infants. Early Human Development, 60, 73-87. doi:10.1016/S0378-3782(00)00111-0
- Holman, R.T. (1971) Essential fatty acid deficiency. In: Holman, R.T., Ed., Progress in the Chemistry of Fats and Other Lipids, 9th Edition, Pergamon Press, New York, 275-348.
ABBREVIATIONS
HbA1c: Glycated Hemoglobin A1c;
DHA: Docosahexaenoic Avid;
NHW: Non-Hispanic White;
EPA: Eicosapentaenoic Acid;
CLIA: Clinical Laboratory Improvement Amendments;
MPF: Melting Point Fractions;
BMI: Body Mass Index;
HDL: High Density Lipoprotein;
LDL: Low Density Lipoprotein.
We have included tables in this paper with conventional and system international (SI) units and conversion factors for melting points.
NOTES
*Conflict-of-interest/financial disclosure statement: none of the authors listed has any conflict of interest.