Advances in Chemical Engineering and Science
Vol.07 No.02(2017), Article ID:74670,16 pages
10.4236/aces.2017.72013
Lignocellulosic-Based Activated Carbon Prepared by a Chemical Impregnation Method as Electrode Materials for Double Layer Capacitor
Dipu Borah1*, Diganta Kumar Bharali2, Michael A. Morris1#
1AMBER Centre and CRANN, Trinity College Dublin, Dublin 2, Ireland
2Department of Chemistry, Biswanath College, Bishwanath Charali, Assam, India

Copyright © 2017 by authors and Scientific Research Publishing Inc.
This work is licensed under the Creative Commons Attribution International License (CC BY 4.0).
http://creativecommons.org/licenses/by/4.0/


Received: January 13, 2017; Accepted: March 10, 2017; Published: March 13, 2017
ABSTRACT
Activated carbons (ACs) were prepared from a lignocellulosic-based waste material by a chemical impregnation method using KOH, NaOH or CaCl2 as the activating agent. These ACs were characterized by different techniques such as N2 adsorption, FTIR, XRD and SEM. Electrostatic properties viz. pH and pHpzc of AC suspensions in aqueous media were measured. The concentration of surface oxygenated functional groups of the ACs was estimated following the Boehm titration method. Cyclic voltammetry was conducted in H2SO4 after fabricating two-electrode capacitor cells of the ACs. The correlation of AC surface chemistry and morphology with electrochemical performance (capacitance) of powdered electrodes is analyzed and discussed.
Keywords:
Activated Carbon, Chemical Impregnation, Characterization, Capacitor

1. Introduction
Electrochemical double layer capacitors (EDLCs) also known as supercapacitors are promising high power energy sources for many different applications where high power density, high cycle efficiency and long cycle life is needed [1] [2] [3] [4] [5] . In electrochemical capacitors, the electrical energy is stored based on the separation of opposite charges in a double layer across the electrode/electrolyte interface. Activated carbons (ACs) have been widely used as electrode materials for EDLCs because of their superior physicochemical stability, high surface area and well-developed pore systems [1] [2] [6] - [14] . The double layer capacitance is partly determined by the morphological properties of the porous electrodes, essentially, the surface area and pore size distribution of the carbon [15] . Further, the electrochemical behavior of carbon electrodes is associated both with surface roughness and the presence of oxygenated surface functional groups [4] , [6] , [16] , [17] . The surface morphology of ACs depends on both the activation process and the nature of the precursor [1] , [18] [19] [20] [21] . Considerable effort has been extended to find suitable precursor materials and activation processes for ACs possessing the essential characteristics needed for EDLC applications [1] , [2] , [5] , [7] , [13] .
ACs are generally prepared by either physical or chemical activation methods from a wide range of precursor materials [1] , [18] [19] [20] [21] . The physical activation process involves carbonization of the material followed by gasification with activating agents such as CO2, steam or a combination of both [18] [19] [20] [21] . The chemical activation method involves impregnation of the precursor with a chemical agent such as H3PO4, ZnCl2, NaOH, KOH, etc. and then activated at a comparatively high temperature [19] [20] [21] . The chemical activation method is advantageous for producing very high surface area AC [19] [20] [21] .
The principal objective of the present work is to explore the feasibility of using lignocellulosic-based ACs as an electrode material for EDLC application. The ACs are prepared following a chemical impregnation method from the testas of Mesua ferrea oil seed, extensively grown in the North Eastern part of India and considered as waste material in biodiesel production [22] . Surface morphology of the ACs is studied using various characterization techniques. Electrochemical performance of the ACs as electrode materials in EDLCs is evaluated.
2. Materials and Methods
2.1. Preparation of AC
The precursor for production of porous carbon was waste material of the testa of an oil seed, Mesua ferrea used in the production of biodiesel. Scheme 1 shows a
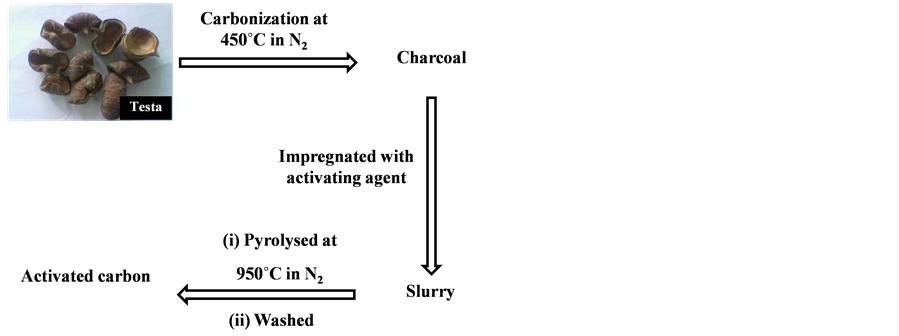
Scheme 1. Schematic representation of the preparation of activated carbon from Mesua ferrea testa.
photograph of the testa and the detailed scheme of the preparation of activated carbon. The precursor material was first washed with distilled water to remove water-soluble impurities and surface adhered particles and then dried at 60˚C to remove moisture and other volatile impurities. The dried material was cut into small pieces. Prior to activation, the precursor was carbonized at 450˚C for 30 min under a nitrogen flow rate of 100 cm3∙min−1. The rate of heating and cooling was 5˚C min−1. The charcoal was ground and sieved to particle size range of 20 - 30 BS (British Standard). This step was intended to produce a dense carbonized material prior to impregnation and activation. ACs were prepared by chemical activation using KOH, NaOH or CaCl2 (activating agent, CAK, CAN and CAC respectively) following an impregnation procedure. 4 g of charcoal was well mixed by stirring with a solution that contained 20 ml water and 16 g of the activating agent for 2 h at 70˚C. The resulting slurry was dried at 110˚C for 24 h in an oven under air atmosphere. Activation was carried out in a vertical furnace by heating (15˚C min−1) from 27˚C to the final activation temperature (950˚C for 30 min) under a flow of nitrogen (100 cm3∙min−1) before cooling at the same rate and environment.
The product was washed with hot deionized water several times. This was followed by refluxing with 25% HNO3 for 2 h at ~100˚C before filtering and washing with hot deionized water for a number of times until the pH of the filtrate is neutral (and free from chloride in case of CaCl2 activation). Finally, the samples were washed with methanol and dried at 110˚C for 48 h in an oven. The samples were preserved in a desiccator. The yield of ACs was in the range of 30% - 35%. The proximate and ultimate analysis of the precursor and the ACs are given in Table 1. Proximate analysis was carried out following standard methods. Ultimate analysis of C, H, N, S, and O (by difference) was performed on a Perkin Elmer 2400 Series II CHNS/O Analyzer.

Table 1. Proximate and ultimate analysis of precursor and activated carbons.
*dry basis; †dry and ash free.
2.2. Characterization of AC
Surface area of the ACs were estimated by physical adsorption of N2 gas measured at 77 K with a Sorptomatic 1900 (Carlo Erba) using the BET model. Prior to the experiments, the samples were outgassed at 250˚C under vacuum for 24 h. Total pore volumes were calculated using the Horvath-Kawazoe (HK) approach [23] . Micropore and mesopore volumes of the ACs were calculated using the Dubinin-Radushkevich (DR) [24] and Barrett-Joyner-Halenda (BJH) [25] methods, respectively.
Fourier transformed infrared (FTIR) spectra were acquired using a Perkin Elmer FTIR 1600 Spectrophotometer. The samples were mixed with KBr and a mixture containing 0.1 wt. % materials was pressed into pellets. Spectra were obtained by averaging 100 scans in the 4000 - 400 cm−1 spectral range at a resolution of 4 cm−1. Surface morphology of the ACs was observed using a FEI Inspect F Scanning Electron Micrograph (SEM) operating at an accelerating voltage of 10 kV.
The ACs were characterized by the pH of their aqueous suspension measured under standardized conditions [26] , [27] . The point of zero charge (pHpzc) was measured to investigate the total surface charge of the ACs in accordance to the standard method [28] . At a solution pH lower than pHpzc, the total surface charge is positive on average, whereas at the higher solution pH it is negative [29] , [30] . The admixture of 100 mg of AC and 50 ml of 0.1 M KNO3 solution was agitated for 24 h at 27˚C to allow it to reach the equilibrium state. The initial pH of KNO3 solution was changed from 2 to 10 using 0.1 M HNO3 and 0.1 M KOH. When the equilibrium pH did not change with increasing the initial pH, the constant pH value was considered as the point of zero charge for the AC. The equilibrium solution pH was measured by a Thermo Scientific ORION 4 STAR digital pH meter.
Boehm titration method was used to determine the oxygenated functional groups of the ACs [31] [32] [33] . In this method, the following assumptions were made to distinguish the surface-oxygen functional groups based on their acidity: C2H5ONa neutralizes carboxylic, lactonic, phenolic and carbonyl groups; NaOH neutralizes carboxylic, lactonic and phenolic groups; Na2CO3 neutralizes carboxylic and lactonic groups and NaHCO3 only neutralizes carboxylic groups [34] [35] [36] . 1 g of AC was separately mixed with 15 ml of the above-men- tioned basic solutions and agitated at 150 rpm for 48 h to complete the neutralization. From the remaining basic solution, 5 ml was separated and back titration was performed with 0.1 M HCl using methyl red as a colour change pH indicator.
2.3. Electrochemical Studies of AC
To prepare the electrodes, a slurry of AC and polytetrafluoroethylene (PTFE) binder (20:1 weight ratio) was pressed on a stainless-steel-foil current collector of 2 cm2 and subsequently dried at 100˚C for 12 h under vacuum. A two-elec- trode capacitor cell was fabricated to examine the electrochemical performance of the AC electrodes in a capacitor. The cell was assembled with two facing AC electrodes, sandwiching a piece of filter paper as separator. Cyclic voltammetric measurements were conducted between −1.0 and 1.0 V at different sweep rates in 1 M H2SO4. The capacitance of the AC electrodes were calculated from integration of the voltammogram within the potential range applied.
3. Results and Discussion
3.1. Material Characterization
The N2 adsorption isotherms at 77 K were used to assess the pore characteristics of the ACs and are presented in Figure 1. This set of isotherms allows us to observe the effect of the activating agents during the pyrolysis step. All isotherms exhibit Type I profile typical of microporous materials according to BET classification systems [37] and show an increase in the adsorption at low P/P˚ (0.0 to 0.05), an indistinct inflection (P/P˚ = 0.1 to 0.3) and a long plateau extending to P/P˚ ~1.0. The adsorption isotherms provide further information on the pore size distribution and the dependence on the nature of the activating agents. The overall shape of the isotherms suggests that the ACs possess uniform pore size and the contribution of mesoporosity being considerably low (from the magnitude of the inflation). These observations are in agreement with the porous texture results listed in Table 2. The results further indicate that activation with KOH produced the best quality AC with regards to porous texture.

Figure 1. N2 adsorption isotherm at 77 K of CAK, CAN and CAC carbons.
Table 2. Specific surface area and pore structure parameters of activated carbons.
The pore size distribution graphs of the ACs are presented in Figure 2. The Hovarth-Kawazoe (HK) methodology [23] is used for the micropore size distribution data (Figure 2(a)) whereas mesopore size distribution diagrams are obtained from the Barret-Joyner-Halenda (BJH) methodology [25] (Figure 2(b) and Figure 2(c) and Figure 2(d)). From Figure 2(a), it can be concluded that the micropores have a narrow size distribution with a mean pore diameter of 12.5 - 13.5 A˚. The mesopore size distribution diagrams of the ACs as displayed in Figure 2(b) and Figure 2(c) and Figure 2(d). The curves show multiple peaks demonstrating a heterogeneous distribution of pores sizes. It is seen that CAC carbon has a broad mesopore size distribution.
SEM was used to determine the morphology of the lignocellulosic derived ACs. Clearly, the distribution and sizes of the pores is critical in determining the applicability of ACs [38] . The plan view SEM images of the three ACs presented in Figure 3 show that these carbons have an irregular and highly macroporous
 (a) (b)
 (c) (d)
Figure 2. (a) Differential micropore pore size distribution based on the Horvath-(HK) methodology, and (b), (c), (d) differential mesopore size distribution based on the Barrett-Joyner-Halenda (BJH) methodology of CAK, CAN and CAC carbons.
 (a) (b) (c)
Figure 3. Plan view SEM images of (a) CAK; (b) CAN and (c) CAC carbons.
cell-like structure (note that a sizeable fraction of pores belongs to the macro domain (<30%)) but a range of pores of different sizes and shapes could be observed. The reason for the development of cavities is not clear but the range of porosities in these materials from the sub nm range through to micron sized pores is probably highly advantageous in terms of material transport. The cell- like structures may have arisen from the evaporation of the activating agent during activation leaving the large void structures observed here. As well as this, the activation temperature is relatively high (950˚C) and caking and agglomera- tion could have occurred on the char structure resulting in the formation of char with an intact external surface. The images further reveal that the surface morphology of the three carbons is different. Pores are well developed and relatively higher in CAK and CAN carbons. It appears that the porous texture characteristics are governed by the nature of the activating agent used in the chemical activation process.
FTIR spectroscopy provides valuable information on the chemical structures of the ACs. Figure 4 shows the FTIR spectra of the three ACs. A broad absor- ption band can be identified for all materials at 3600 - 3200 cm−1 and can be assigned to the O-H stretching mode of hydroxyl/adsorbed water. The position and asymmetry of this band at lower wave numbers indicates the presence of strong hydrogen bonds [39] . Further, a weak but sharp peak was observed at 3729 cm−1 in all the ACs indicating the presence of isolated O-H groups.
The FTIR spectra of the ACs show absorption bands due to aliphatic C-H in −CH2− (2924 cm−1 and 2857 cm−1) and −CH2− deformation (1450 cm−1). Bands due to the C-H stretching mode (3045 cm−1 and 3025 cm−1) and out-of-plane deformation mode (886 cm−1 and 800 cm−1) of aromatic structures are identified in the spectra. The out-of-plane deformation modes derive from variously substituted benzene rings. The intensity of these bands is low and suggests the elimination of a large fraction of C-H bonds during pyrolysis and the formation

Figure 4. FTIR spectra of CAK, CAN and CAC carbons.
of the carbon network. This observation is in concordance with the results of elemental analysis (Table 1) which indicated low hydrogen contents. The spectra also show a weak band in the region of 1600 - 1580 cm−1. This absorption band is due to C=C stretching vibrations in aromatic ring structures. The spectra also show a strong peak at ~1720 cm−1. This band is usually assigned to C=O stretching vibrations of ketones, aldehydes, lactones or carboxyl groups. Broad bands at 1300 - 1000 cm−1 have been attributed to the C-O stretching in acids, alcohols, phenols, ethers and esters [39] , [40] . Moreover, a new strong band centering at ~1557 cm−1 and another weak band at ~1280 cm−1 are observed in the spectra of all the three ACs. These peaks are attributed to the symmetric and asymmetric vibrations of −NO2 groups [41] . The presence of this group probably arises from the washing stage and the HNO3 reflux used. The various carbon-oxygen groups are probably due to oxidation of the carbons by HNO3. Elemental analysis further supports this suggestion (Table 1).
The acid-base properties of AC are important when this class of material is used as electrode material/adsorbents. The pH of carbon suspension in de-ionized water is highly acidic as is evident from the results of Table 3. There are however, variations in the pH of the carbon suspensions. This is obviously due to the effect of the activating agents used in the preparation stage. AC prepared using NaOH produced the most acidic carbon suspension. The point of zero charge (pHpzc) values listed in Table 3 were obtained from Figure 5 where the equilibrium solution pH was plotted against the initial solution pH for all the three ACs. The constant equilibrium solution pH exhibits the point of zero charge (pHpzc). The pHpzc values of the three ACs fall in a narrow range of 6.7-7.5 which is promising for use as aqueous phase adsorbents [42] . There is a minor variation in pHpzc for the materials due to the chemicals used in the activation process. Table 3/Figure 5 indicate that pH and pHpzc are on the acidic side of

Figure 5. Relationship of equilibrium solution pH (pHfinal) and initial solution pH (pHinitial) for the determination of pHpzc of AC suspensions.
Table 3. Electrostatic (acid-base) properties of activated carbons.
the pH scale for CAN and CAC carbons. This is consistent with the variation in the level of acidic surface functional groups (Table 3). Of the four types of acidic functional groups present carboxylic and phenolic groups are primarily responsible for the acidic properties observed. These two functional groups dissociate readily in water to generate H+ when compared to lactonic and carbonylic groups. The overall amount of carboxylic and phenolic groups are highest for the CAN and CAC carbons and explains their acidity.
3.2. Electrochemical Investigations
The electrochemical properties of the ACs as electrode materials for EDLCs/su- percapacitors were evaluated using cyclic voltammetry (CV) measurements. The CVs of the AC electrodes are shown in Figure 6 with different voltage sweep rates from 5 to 50 mV∙s−1. For all ACs, the low voltage sweep rate (5 and 10 mV∙s−1) CVs are almost rectangular in shape suggesting the unrestricted motion of electrolytes into the pores at this slow rate of double layer formation. However, the distortion of the voltammograms increases with increasing voltage sweep rate for all the materials. This indicates that these ACs are not suitable for quick charge-discharge operations. Thus, at high sweep rates, the ohmic resistance of electrolyte motion in the pores has affected the double layer formation mechanism which is important for the charge storage [43] , [44] . This may arise from increased induced current with higher sweep rates. This induced current can increase the potential difference between the mouth and bottom of the pores thereby resulting in the delayed current response [13] . However, the situation for CAK carbon is different to a certain extent. The voltammogram of this AC is less tilted at higher sweep rates in comparison to the other two AC electrodes. This indicates somewhat superior capacitive behaviour of the AC even in quick charge-discharge operations. This could be due to better accessibility of the ions to the electrochemically active surface at high voltage sweep rates.
The specific capacitance value (expressed in Farad (F)) of the electrode materials is calculated from the cyclic voltammograms and the results at different sweep rates are listed in Table 4. It is evident that there is little variation in the specific capacitance of the ACs. CAN carbon shows the highest capacitance value of 183.8 F∙g−1 at a slow sweep rate of 5 mV s whereas CAC carbon shows the lowest capacitance value of 15.3 F∙g−1 at a high sweep rate of 50 mV∙s−1. The relationship between the retained capacitance ratios (i.e., capacitance decay) and voltage sweep rate is plotted in Figure 7(a). Here, the specific capacitance values

Figure 6. The two-electrode cyclic voltammograms sweep between −1.0 and 1.0 V at voltage sweep rates of (a) 5 mV/s; (b) 10 mV/s; (c) 20 mV/s and (d) 50 mV/s in 1 M H2SO4 for CAK, CAN and CAC electrodes.
 (a) (b)
Figure 7. Plots of (a) capacitance decay against voltage sweep rate and (b) capacitance against reciprocal voltage sweep rate for CAK, CAN and CAC carbons.
Table 4. Capacitance of activated carbons at different voltage sweep rates.
decrease with the increase of sweep rate for the three ACs. Further, it indicates that there is always less electrochemically active surface area of pores being utilized at higher voltage sweep rate. The CAK carbon retained the highest of their initial capacitance even at the highest sweep rate of 50 mV∙s−1 amongst all the ACs. The relationship of capacitance verses the reciprocal of the sweep rate is shown in Figure 7(b). The linearity of these dependences and lines starting at point (0, 0) confirm almost purely Coulombic character of the process tested.
The ability for charge accumulation depends upon the specific surface area of AC. A direct relationship between capacitance and surface area exists and is given by:

where, ε is permittivity of the electrolyte, S is surface area of the electrode-elec- trolyte interface, and d is distance between the polarized AC surface and the maximum charge density of solvated ions [45] , [46] . Generally, the higher the specific surface area of the AC, the higher the ability for charge storage. The specific surface area of CAN carbon is low in comparison to CAK carbon (Table 2), but it shows the highest capacitance value. This could be due to the fact that at slow sweep rate the ions have enough time to diffuse into the micropore surface of CAN carbon (72.7% micropore fraction). Comparatively, both CAK and CAC carbons possess less capacitance at slow sweep rate of 5 mV/s; however, CAK carbon can maintain most of their capacitance at high voltage sweep rate (Figure 7(a)). This AC has the highest surface area and mesopore fraction amongst all the ACs investigated, which explains this behaviour. The solvated ions can diffuse fast enough into the mesopores of CAK carbon even at high voltage sweep rate of 50 mV/s. However, it is difficult to establish a direct relationship between surface area and capacitance of the ACs investigated. This observation is well documented in Figure 8, which depicts the relation between surface area and capacitance of the ACs.
The functional groups may import an additive enhancement of the specific capacitance of polarizable electrode. The surface oxygen-containing moieties such as carbonyl, hydroxyl, etc. are electrochemically active in both the capaci- tive and Faradic sense. These Faradically active surface groups can contribute to the measured charge and consequently to the capacitance values (i.e., a pseudocapacitance) [16] , [47] , [48] . Interestingly, features due to pseudocapacitive processes are not observed in the voltammograms. This does not necessarily ascribe the zero contribution of pseudocapacitance to the total capacitance of the electrode systems. The functional groups on AC surface can be attractable for the solvated electrolyte ions [49] , [50] . The process is due to physical adsorption, by electrostatic forces between the AC surface and electrolyte ions. Further, the increase in oxygenated functional groups content may improve the wettability of the AC surface in the electrolyte resulting in a corresponding increase of the real area of the built-up double layer [50] . There are reports that higher capacitance can be achieved through the attachment of a variety of functional groups using thermal, chemical and electrochemical treatments [51] , [52] . The relationship between total acidic functional groups verses capacitance as shown in Figure 9,

Figure 8. Dependence of capacitance (at voltage sweep rate, 5 mV/s) on specific surface area of CAK, CAN and CAC carbons.

Figure 9. Dependence of capacitance (at voltage sweep rate, 5 mV/s) on total acidic surface functional groups of CAK, CAN and CAC carbons.
are indicative of the decisive role of surface concentration of oxygenated functional groups in double layer formation and consequently capacitance. Figure 9 clearly demonstrates the reason why CAN carbon possesses the highest capacitance value at slow sweep rate amongst the ACs tested.
4. Conclusion
The ACs prepared here are predominantly microporous with highly developed surface area and porous texture. Further, the carbons possess sufficient oxygenated and acidic surface moieties. EDLCs performances of the ACs have demonstrated the dependence of capacitance on porous texture and concentration of surface oxygen-containing functional groups. There is little variation in the specific capacitance of the ACs with CAN carbon showing the highest capacitance value of 183.8 F∙g−1.
Acknowledgements
The authors wish to acknowledge SFI AMBER Centre Grant 12/RC/2278 for providing financial support to carry out the research.
Cite this paper
Borah, D., Bharali, D.K. and Morris, M.A. (2017) Lignocellulosic-Based Activated Carbon Prepared by a Chemical Impregnation Method as Electrode Materials for Double Layer Capacitor. Advances in Chemical Engineering and Science, 7, 175-190. https://doi.org/10.4236/aces.2017.72013
References
- 1. Faraji, S. and Ani, F.N. (2015) The Development of Supercapacitor from Activated Carbon by Electroless Plating—A Review. Renewable & Sustainable Energy Reviews, 42, 823-834.
https://doi.org/10.1016/j.rser.2014.10.068 - 2. Kim, M.-H., Yang, J.-H., Kang, Y.-M., Park, S.-M., Han, J.T., Kim, K.-B. and Roh, K.C. (2014) Fluorinated Activated Carbon with Superb Kinetics for the Supercapacitor Application in Nonaqueous Electrolyte. Colloids and Surfaces A, 443, 535-539.
https://doi.org/10.1016/j.colsurfa.2013.12.020 - 3. Winter, M. and Brodd, R.J. (2004) What Are Batteries, Fuel Cells, and Supercapacitors? Chemical Reviews, 104, 4245-4270.
https://doi.org/10.1021/cr020730k - 4. Frackowiak, F. and Beguin, F. (2002) Electrochemical Storage of Energy in Carbon Nanotubes and Nanostructured Carbons. Carbon, 40, 1775-1787.
https://doi.org/10.1016/S0008-6223(02)00045-3 - 5. Frackowiak, F. and Beguin, F. (2001) Carbon Materials for the Electrochemical Storage of Energy in Capacitors. Carbon, 39, 937-950.
https://doi.org/10.1016/S0008-6223(00)00183-4 - 6. Cho, M.-Y., Kim, M.-H., Kim, H.-K., Kim, K.-B., Yoon, J.R. and Roh, K.C. (2014) Electrochemical Performance of Hybrid Supercapacitor Fabricated Using Multi-structured Activated Carbon. Electrochemistry Communications, 47, 5-8.
https://doi.org/10.1016/j.elecom.2014.07.012 - 7. Hu, S., Zhang, S., Pan, N. and Hsieh, Y.-L. (2014) High Energy Density Supercapacitors from Lignin Derived Submicron Activated Carbon Fibers in Aqueous Electrolytes. Journal of Power Sources, 270, 106-112.
https://doi.org/10.1016/j.jpowsour.2014.07.063 - 8. Basri, N.H., Deraman, M., Kanwal, S., Talib, I.A., Manjunatha, J.G., Aziz, A.A. and Farma, R. (2013) Supercapacitors Using Binderless Composite Monolith Electrodes from Carbon Nanotubes and Pre-Carbonized Biomass Residues. Biomass and Bioenergy, 59, 370-379.
https://doi.org/10.1016/j.biombioe.2013.08.035 - 9. Liu, X. and Osaka, T. (1997) Properties of Electric Double-Layer Capacitors with Various Polymer Gel Electrolytes. Journal of the Electrochemical Society, 144, 3066-3071.
https://doi.org/10.1149/1.1837960 - 10. Qiao, X., Korai, Y., Mochida, I., Hori, Y. and Maeda, T. (2002) Preparation of an Activated Carbon Artifact: Oxidative Modification of Coconut Shell-Based Carbon to Improve the Strength. Carbon, 40, 351-358.
https://doi.org/10.1016/S0008-6223(01)00110-5 - 11. Lin, Y.-R. and Teng, H. (2003) A Novel Method for Carbon Modification with Minute Polyaniline Deposition to Enhance the Capacitance of Porous Carbon Electrodes. Carbon, 41, 2865-2871.
https://doi.org/10.1016/S0008-6223(03)00424-X - 12. Liang, H., Chen, F., Li, R., Wang, L. and Deng, Z. (2004) Electrochemical Study of Activated Carbon-Semiconducting Oxide Composites as Electrode Materials of Double-Layer Capacitors. Electrochimica Acta, 49, 3463-3467.
https://doi.org/10.1016/j.electacta.2004.03.016 - 13. Lin, H.-Y., Wang, K.-P. and Teng, H. (2005) A Simplified Preparation of Mesoporous Carbon and the Examination of the Carbon Accessibility for Electric Double Layer Formation. Carbon, 43, 559-566.
https://doi.org/10.1016/j.carbon.2004.10.020 - 14. Xing, W., Qiao, S.Z., Ding, R.G., Li, F., Lu, G.Q., Yan, Z.F. and Cheng, H.M. (2006) Superior Electric Double Layer Capacitors Using Ordered Mesoporous Carbons. Carbon, 44, 216-224.
https://doi.org/10.1016/j.carbon.2005.07.029 - 15. Noofeli, A., Hall, P.J. and Rennie, A.J.R. (2014) Ionic Liquid Based EDLCs: Influence of Carbon Porosity on Electrochemical Performance. Faraday Discussions, 172, 163-177.
https://doi.org/10.1039/c4fd00057a - 16. Kinoshita, K. (1988) Carbon: Electrochemical and Physicochemical Properties. John Wiley & Sons, New York.
- 17. Biniak, S., Swiatkowski, A. and Pakula, M. (2001) Electrochemical Studies of Phenomena at Active Carbon-Electrolyte Solution Interfaces. In: Radovic, L.R., Ed., Chemistry and Physics of Carbon, Vol. 27, Dekker, New York, 125-225.
- 18. Hadi, P., Xu, M., Ning, C., Lin, C.S.K. and McKay, G. (2015) A Critical Review on Preparation, Characterization and Utilization of Sludge-Derived Activated Carbons for Wastewater Treatment. Chemical Engineering Journal, 260, 895-906.
https://doi.org/10.1016/j.cej.2014.08.088 - 19. Xu, J., Chen, L., Qu, H., Jiao, Y., Xie, J. and Xing, G. (2014) Preparation and Characterization of Activated Carbon from Reedy Grass Leaves by Chemical Activation with H3PO4. Applied Surface Science, 320, 674-680.
https://doi.org/10.1016/j.apsusc.2014.08.178 - 20. Diasa, J.M., Alvim-Ferraza, C.M.C., Almeidaa, M.F., Utrilla, J.R. and Sanchez-Polo, M. (2007) Waste Materials for Activated Carbon Preparation and Its Use in Aqueous-Phase Treatment: A Review. Journal of Environmental Management, 85, 833-846.
https://doi.org/10.1016/j.jenvman.2007.07.031 - 21. Ioannidou, O. and Zabaniotou, A. (2007) Agricultural Residues as Precursors for Activated Carbon Production—A Review. Renewable & Sustainable Energy Reviews, 11, 1966-2005.
https://doi.org/10.1016/j.rser.2006.03.013 - 22. Sarma, A.K. and Konwer, D. (2005) Feasibility Studies for Conventional Refinery Distillation with a (1:1) w/w of a Biocrude Blend with Petroleum Crude Oil. Energy & Fuels, 19, 1755-1758.
https://doi.org/10.1021/ef0496810 - 23. Horvath, G. and Kawazoe, K. (1983) Method for the Calculation of Effective Pore Size Distribution in Molecular Sieve Carbon. Journal of Chemical Engineering of Japan, 16, 470-475.
https://doi.org/10.1252/jcej.16.470 - 24. Dubinin, M.M. and Radushkevich, L.V. (1947) Equation of the Characteristic Curve of Activated Charcoal. Proceedings of the Academy of Sciences of USSR, 55, 331.
- 25. Barrett, E.P., Joyner, L.G. and Halenda, P.H. (1951) The Determination of Pore Volume and Area Distributions in Porous Substances. I. Computations from Nitrogen Isotherms. Journal of the American Chemical Society, 73, 373-380.
https://doi.org/10.1021/ja01145a126 - 26. Laszlo, K., Tombacz, E. and Josepovits, K. (2001) Effect of Activation on the Surface Chemistry of Carbons from Polymer Precursors. Carbon, 39, 1217-1228.
https://doi.org/10.1016/S0008-6223(00)00245-1 - 27. Tessmer, C.H., Vidic, R.D. and Uranowski, L.J. (1997) Impact of Oxygen-Containing Surface Functional Groups on Activated Carbon Adsorption of Phenols. Environmental Science and Technology, 31, 1872-1878.
https://doi.org/10.1021/es960474r - 28. Smiciklas, I.D., Milonjic, S.K., Pfendt, P. and Raicevic, S. (2000) The Point of Zero Charge and Sorption of Cadmium (II) and Strontium(II) Ions on Synthetic Hydroxyapatite. Separation and Purification Technology, 18, 185-194.
https://doi.org/10.1016/S1383-5866(99)00066-0 - 29. Moreno-Castilla, C. (2004) Adsorption of Organic Molecules from Aqueous Solutions on Carbon Materials. Carbon, 42, 83-94.
https://doi.org/10.1016/j.carbon.2003.09.022 - 30. Menendez, J.A., Illan-Gomez, M.J., Leon, C.A.L. and Radovic, L.R. (1995) On the Difference between the Isoelectric Point and the Point of Zero Charge of Carbons. Carbon, 33, 1655-1657.
https://doi.org/10.1016/0008-6223(95)96817-R - 31. Boehm, H.P. (1990) Surface Oxides on Carbon. High Temperatures-High Pressures, 22, 275-288.
- 32. Boehm, H.P. (1994) Some Aspects of the Surface Chemistry of Carbon Blacks and Other Carbons. Carbon, 32, 759-769.
https://doi.org/10.1016/0008-6223(94)90031-0 - 33. Boehm, H.P. (2002) Surface Oxides on Carbon and Their Analysis: A Critical Assessment. Carbon, 40, 145-149.
https://doi.org/10.1016/S0008-6223(01)00165-8 - 34. Rangel-Mendez, J.R. and Streat, M. (2002) Adsorption of Cadmium by Activated Carbon Cloth: Influence of Surface Oxidation and Solution pH. Water Research, 36, 1244-1252.
https://doi.org/10.1016/S0043-1354(01)00343-8 - 35. Salame, H. and Bandosz, T.J. (2003) Role of Surface Chemistry in Adsorption of Phenol on Activated Carbons. Journal of Colloid and Interface Science, 264, 307-312.
https://doi.org/10.1016/S0021-9797(03)00420-X - 36. Bandosz, T.J., Jagiello, J. and Schwarz, J.A. (1993) Effect of Surface Chemical Groups on Energetic Heterogeneity of Activated Carbons. Langmuir, 9, 2518-2522.
https://doi.org/10.1021/la00034a008 - 37. Brunauer, S., Deming, L.S., Deming, W.E. and Teller, E. (1940) On a Theory of the van der Waals Adsorption of Gases. Journal of the American Chemical Society, 62, 1723-1732.
https://doi.org/10.1021/ja01864a025 - 38. Kobya, M., Demirbas, E., Senturk, E. and Ince, M. (2005) Adsorption of Heavy Metal Ions from Aqueous Solutions by Activated Carbon Prepared from Apricot Stone. Bioresource Technology, 96, 1518-1521.
https://doi.org/10.1016/j.biortech.2004.12.005 - 39. Zawadzki, J. (1989) Infrared Spectroscopy in Surface Chemistry of Carbons. In: Thrower, P.A., Ed., Chemistry and Physics of Carbon, Vol. 21, Marcel Dekker, New York, 147-386.
- 40. Vinke, P., van der Eijk, M., Verbree, M., Voskamp, A.F. and Bekkum, H. (1994) Modification of the Surfaces of a Gas Activated Carbon and a Chemically Activated Carbon with Nitric Acid, Hypochlorite, and Ammonia. Carbon, 32, 675-686.
https://doi.org/10.1016/0008-6223(94)90089-2 - 41. Silverstein, R.M., Bassler, G.C. and Morrill, T.C. (1981) Spectroscopic Identification of Organic Compounds. Wiley, New York.
- 42. Borah, D., Satokawa, S., Kato, S. and Kojima, T. (2009) Sorption of as(V) from Aqueous Solution Using Acid Modified Carbon Black. Journal of Hazardous Materials, 162, 1269-1277.
https://doi.org/10.1016/j.jhazmat.2008.06.015 - 43. De Levie, R. (1963) On Porous Electrodes in Electrolyte Solutions I. Capacitance Effects. Electrochimica Acta, 8, 751-780.
https://doi.org/10.1016/0013-4686(63)80042-0 - 44. Conway, B.E. (1999) Electrochemical Supercapacitors Scientific Fundamentals and Technological Applications. Kluwer/Plenum, New York.
- 45. Shi, H. (1996) Activated Carbons and Double Layer Capacitance. Electrochimica Acta, 41, 1633-1639.
https://doi.org/10.1016/0013-4686(95)00416-5 - 46. Lozano-Castello, D., Cazorla-Amoros, D., Linares-Solano, A., Shiraishi, S., Kurihara, H. and Oya, A. (2003) Influence of Pore Structure and Surface Chemistry on Electric Double Layer Capacitance in Non-aqueous Electrolyte. Carbon, 41, 1765-1775.
https://doi.org/10.1016/S0008-6223(03)00141-6 - 47. Brown, A.P. and Anson, F.C. (1977) Cyclic and Differential Pulse Voltammetric Behavior of Reactants Confined to the Electrode Surface. Analytical Chemistry, 49, 1589-1595.
https://doi.org/10.1021/ac50019a033 - 48. Woodard, F.E., McMackins, D.E. and Jansson, R.E.W. (1986) Electrosorption of Organics on Three Dimensional Carbon Fiber Electrodes. Journal of Electroanalytical Chemistry, 214, 303-330.
https://doi.org/10.1016/0022-0728(86)80105-X - 49. Figueiredo, J.L., Pereira, M.F.R., Fritas, M.M.A. and Orfao, J.J.M. (1999) Modification of the Surface Chemistry of Activated Carbons. Carbon, 37, 1379-1389.
https://doi.org/10.1016/S0008-6223(98)00333-9 - 50. Hsich, C.T. and Teng, H. (2002) Influence of Oxygen Treatment on Electric Double-Layer Capacitance of Activated Carbon Fabrics. Carbon, 40, 667-674.
https://doi.org/10.1016/S0008-6223(01)00182-8 - 51. Momma, T., Liu, X., Osaka, T., Ushio, Y. and Sawada, Y. (1996) Electrochemical Modification of Active Carbon Fiber Electrode and Its Application to Double-Layer Capacitor. Journal of Power Sources, 60, 249-253.
https://doi.org/10.1016/S0378-7753(96)80018-8 - 52. Ma, R.Z., Liang, J., Wei, B.Q., Zhang, B., Xu, C.L. and Xu, D.H. (1999) Study of Electrochemical Capacitors Utilizing Carbon Nanotube Electrodes. Journal of Power Sources, 84, 126-129.
https://doi.org/10.1016/S0378-7753(99)00252-9