Journal of Transportation Technologies
Vol.3 No.2A(2013), Article ID:31834,9 pages DOI:10.4236/jtts.2013.32A006
An Analysis on Efficiency and Equity of Fixed-Time Ramp Metering
1Department of Built Environment, Tokyo Institute of Technology, Tokyo, Japan
2Department of Civil Engineering, Istanbul Technical University, Istanbul, Turkey
Email: *kesten.a.aa@m.titech.ac.jp, ergunmur@itu.edu.tr, tyai@enveng.titech.ac.jp
Copyright © 2013 Ali Sercan Kesten et al. This is an open access article distributed under the Creative Commons Attribution License, which permits unrestricted use, distribution, and reproduction in any medium, provided the original work is properly cited.
Received February 1, 2013; revised March 1, 2013; accepted March 8, 2013
Keywords: Traffic Control Strategies; Traffic Flow Micro-simulation; Equity in Traffic Control; Efficiency and Equity Trade-Off
ABSTRACT
Various traffic management strategies have been developed to alleviate the congestion on freeways. The equity issue has been considered as one of the major challenges for the implementation of some traffic control strategies, especially ramp metering. This paper presents a comparative evaluation of the efficiency and equity performance of a traffic control strategies namely Fixed Time Ramp Metering (FTRM). Instead of focusing on a single equity measure and/or indicator, different approaches to the equity concept are discussed and various equity measures are examined. The equity and efficiency performance of traffic control strategies are compared and evaluated by incorporating them into the simulated corridor. The Bosporus Bridge of Istanbul O-1 Freeway, Turkey is used as a test-bed for the simulation model and the control strategy is employed through microscopic traffic flow simulation software, VISSIM AG. The findings from the simulations show that the equity and efficiency properties of the network vary with the measures and indicators taken into account. The results also suggest that the trade-off between equity and efficiency can be observed for some measures, whereas regarding to other measures the trade-off is not validated.
1. Introduction
Freeways had been commonly recognized as to provide virtually unlimited mobility to road users, without any flow disturbance [1]. The constant increase of traffic demand, however, yields either recurrent congestion which occurs daily during rush hours or non-recurrent congestion which is defined as unexpected or unusual congestion [2]. The congested freeways within and around metropolitan areas degrades infrastructure utilization and causes increase in delays and Green House Gases (GHGs) emissions and decrease in average travel speed and safety [3-5]. The continuously increasing traffic congestion problem has led to application of various control strategies. Basically, these are formed by controlling the number of vehicles entering the freeway and/or by changing the speed limit of designated section along the freeway. Advanced urban traffic networks include both urban roads and freeways utilize control strategies like signal control, ramp metering, variable message signs and route guidance [6].
The efficiency of the traffic control is commonly analyzed through the measures of effectiveness such as; total travel time in hours, total delay time in minutes or hours, number of stops, average speed in km/h and total distance traveled in kilometers. The efficiency of traffic flow is essentially sensitive to demand levels, network topology, link geometry, and number of bottlenecks [7].
In practice mostly the links with higher traffic flows in the network are targeted for control where a maximum efficiency gain in travel time can imply a significant reduction of aggregate delays and generalized travel costs. On the contrary, this may trigger the increase of regional disparities [8].
In traffic control, in some cases it is observed that when efficiency is selected as the single most important measure, the impacts are not consistent with either environmental or social sustainable transportation principles [9]. Therefore, equity issues should be taken into account in traffic management and control. Before integrating equity issues to traffic control the broader definition of equity and specific meaning in traffic control should be put forward. Nevertheless, the definition and measurement of equity is one of the most controversial debates of humankind where a consensus is far over the horizon. There are some recent trials on integration of equity objectives in transportation planning and traffic engineering. The first studies of equity integration in transportation covered the fairness of transportation policies and later, road network design evaluated the equity issues [10]. The most common drawback of these researches is the single measure dependent nature. The authors of this paper believe that, various existing equity measures should be evaluated for the traffic control and the implications should be analyzed critically.
The goal of this paper is to present a brief review of efficiency and equity measures in transportation studies given the emphasis on traffic control and to analyze the efficiency and equity properties of FTRM strategy on a selected urban highway corridor.
The remainder of the paper is organized as fallows. The second section of this paper presents a brief review of efficiency and equity concepts in transportation planning giving a special emphasis on traffic control. FTRM methodology is introduced in Section 3. In Section 4, FTRM is applied in a traffic micro simulation environment a case study where the study site, data, calibration and simulation details are explained in detail. The equity and efficiency performance of FTRM are assessed in Section 5 and the conclusion section provides the implications of the efficiency and equity measures of FTRM control.
2. Efficiency and Equity Concepts
Efficiency can be simply measured as a function of input and output of investments. In traffic control, the efficiency mostly considered as the gain of implementing a facility or a management strategy as the input where a reduction in total travel time, delay, number of stops, fuel consumption, emissions and accidents and/or increase in total traffic volume and speed as an output. In the case of ramp metering, speed management and route guidance, the investment is the cost of the installation of equipment, maintenance and operations. The return on the investment is the overall capacity increase and the indirect reduction in external costs. The significance and importance of measures can be varied in between and among the drivers, traffic authorities and the other peer groups of traffic. Therefore, the cost criterion may not be sufficient enough to draw a conclusion as it is the case in many of the studies in literature.
Equity is a complex idea that is not suitable to explain with simple formulations. It is mostly affected by cultural and societal values, by the specific types of goods i.e. divisible and non-divisible and conditional to given situation. Therefore, for a clear comprehension the contextual details are highly important. Equity has been one of the greatest topics debated as a matter of distribution of the prey. Thus, one of the simplest and shortest definitions attempts of equity could be justice and fairness in distribution of goods or rights ubiquitously. For the distribution among the group, firstly the group should be defined. The horizontal equity considers the group members have the same rights hence they deserve the same portion of distribution.
The concept of equity has been extensively examined in several disciplines e.g., health [11,12], political science [13], sociology [14], and economics [15,16]. Even though there is an increasing interest of utilizing equity concept in policy assessment, there is no solid and widely accepted framework available. There are numerous measures used in the literature, but a general consensus on the best measures to use for a particular case is still far away. Withal, there are also very good examples of equity analyses, one of them is the Peyton’s work on conceptual evaluation of equity [17], and the other one is Cowell’s systematic and delicate work on equity measurement [18]. Another significant review and framework is written by Marsh and Schilling which they analyzed equity measurement in facility location [19].
2.1. Approaches to Equity in Transportation
In the transportation literature, equity issues were generally concentrated on evaluation of the economic impacts of transportation policies. The picture has been changed especially with the studies concerning the distribution of impacts among various social groups in road pricing policies [20,21]. There are many equity analyses examples can be found in literature. Some of them are tabu lated in Table 1.
2.2. Equity Measures and Indicators
The equity of traffic control strategies are one of the biggest concern in practice. There are several indexes used in evaluation of equity issue in traffic control strategies mainly adapted from statistical or socio-economic models (welfare distribution). In this paper, the equity is rather used in the context of horizontal equity where in traffic control the drivers or alternatively cars should be treated equally1.
Statistical measures examine the distribution of any variable in a given population. The most frequent use is the distribution investigation of income. Examples of these are; range, variance, measure of variation, log variance, Gini measure and Theil’s entropy measure. Welfare measures are based on welfare economics and integrate
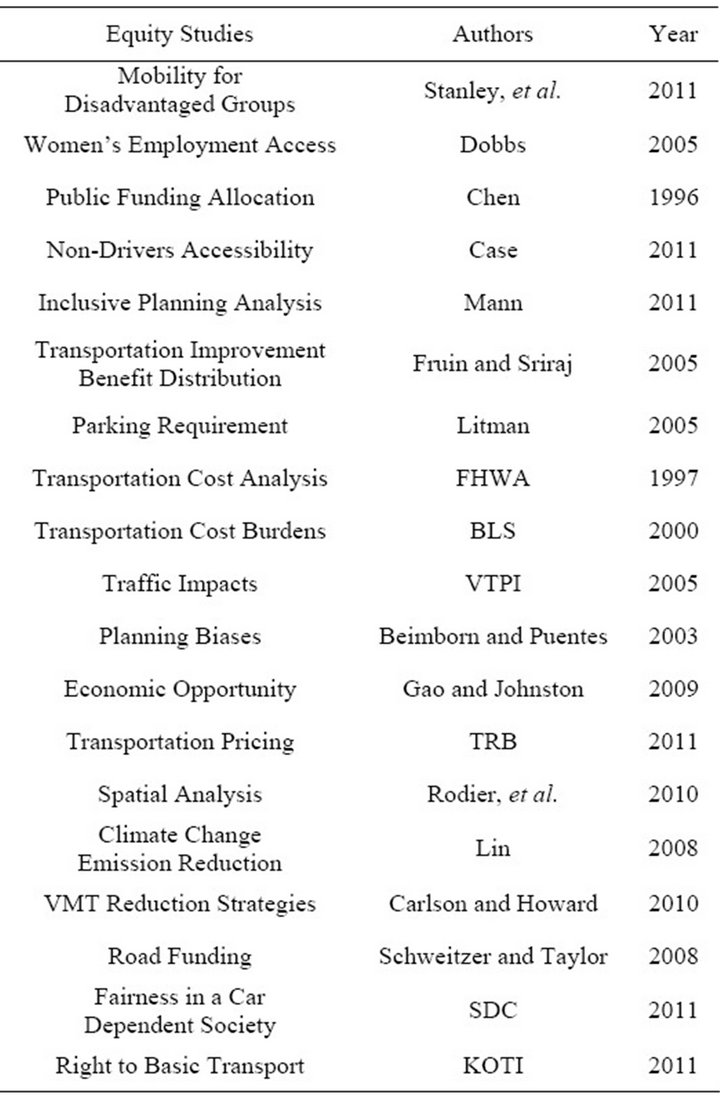
Table 1. Equity studies in transportation literature.
equity concerns into a welfare function. The axiomatic measures can be applied to the evaluation of inequality of any vector or distribution of observations, even to noneconomic data such as the distribution of the dispersion of pollutants or delay on a network. Table 2 shows the measures are examined in this study and summarizes their properties.
In the measures given in Table; Y is a measure of welfare n is the number of observations on welfare  is the mean level of welfare log Y is the mean level of log of welfare ε and α in Atkinson and Kolm measures respectively are the parameters that address inequality aversion.
3. Traffic Control Strategies
Traditional control strategies use advanced technologies and more efficient procedures by integrating into the context of freeway management strategies that seek to manage, operate, and maintain expressways in an efficient and cost-effective manner [22]. The most effective control measures that are typically employed in freeway networks can be classified as ramp metering, speed ma-
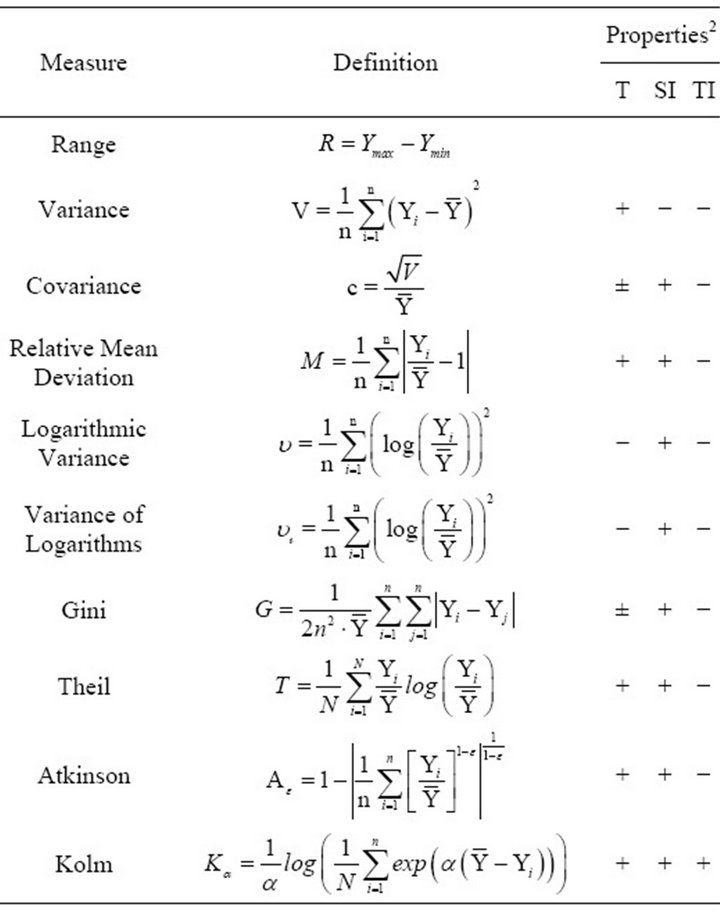
Table 2. A summary of equity indexes.
nagement, route guidance and integrated control.
3.1. Ramp Metering
The use of traffic signals on-ramps to control the merging on freeways is called ramp metering. Ramp meters are installed to control the rate of vehicles moving into to the mainline traffic thus it prevents the critical volume of a freeway in order to control the demand and moreover, breaks the platoon of vehicles entering the freeway upstream of the signal to decrease the weaving phenomenon at the merge area. Ramp metering is projected to relieve or even eliminate congestion, ameliorate traffic flow conditions, safety and air quality, reduce total travel time and improve the performance measures, and regulate the demand in order to establish a stable freeway system [23].
Ramp metering is a well-known technique for freeways. In fact, various techniques of ramp control were used in the late 1950s and through 1970s in Japan and USA. By the early 1990s with the technological advancement both in computing and measurement techniques make more sophisticated ramp metering systems possible to analyze and implement. The specification of the metering which is the specific entrance allowance for vehicles from ramp to the freeway rate draws an important role in control success. An extensive literature reviews found on ramp metering algorithms and comparison of the performances of some of these algorithms are demonstrated in [24-27].
Three different metering operations can be defined according to the control logic as: fixed-time, local traffic responsive and coordinated traffic responsive. A fixedtime ramp-metering control uses historical traffic data and a time-of-day basis [28]. Local traffic responsive ramp-metering strategies use the measurements of traffic flow and the metering rate is based on prevailing traffic conditions in the vicinity of the ramp. The most prominent examples of the local ramp-metering strategies are the demand capacity (DC), the occupancy (OCC) strategies and (ALINEA) strategy [29]. Local traffic responsive metering algorithms regardless of type of controller which can be either linear [30], artificial neural network [31] or Fuzzy-logic [32] are performed well without considering the system wide optimization. The coordinated traffic responsive ramp metering aims optimization of the performance of entire freeway facility. Fixed time and/or local traffic responsive control approaches could be used in concert with the coordinated traffic responsive control approach by predicting the traffic conditions. Coordinated ramp-metering strategies benefits the measurements from the entire network to control all metered ramps. Some studies [33,34] stated that coordinated traffic responsive strategies are more efficient when the demand is extremely high. Contrary in some studies [35,36] coordinated control algorithms are obtained not superior to the local ramp metering strategies. The main drawback of coordinated traffic responsive ramp metering approach is the complex and costly nature to realize.
3.2. Fixed-Time Ramp Metering
Historically, the solution of the conflicts between the multidirectional flows of traffic is sought by considering the allocation of saturation, time or delay among all movements. The use of traffic signal establishes an orderly movement of traffic and increases the capacity and safety of intersections thoroughly. The design process of timing plans for signalized intersections in Highway Capacity Manual [37] treats the traffic merely as static volumes of conflicting movements that require right-ofway alternatively. With a given phase sequence and phase groups, the method can determine how much green time within a cycle will be allocated to each phase, or the green splits. One fundamental difference of these methods is the design logic to allocate green splits; and these logic will affect how efficient and equitable a timing plan can be. Three major logics have been developed are; equal-saturation strategy [38] where the green time is determined in such a way that the phase duration will be proportional to its critical Volume/Capacity (V/C) ratio, delay minimization strategy [39] which is a policy that minimizes the total intersection delay and the capacity maximization policy [40] maximizing the intersection capacity through balancing the traffic pressures of conflicting approaches where the pressure is defined as the product of the approach capacity and its average delay for each approach link.
Likewise traffic lights, ramp metering control utilize traffic signals at freeway on ramps or freeway interchanges to manage the rate of vehicles entering the freeway. However, there is no established method for the specification of optimum cycle time for fixed time ramp metering. Therefore, the traditional analytical models developed for fixed time intersection control are examined and capacity maximization approach is modified for fixed time ramp metering simulation experiment.
Ramp metering algorithms aim to set the allowable ramp flow value r (in veh/h) which can be basically defined as (cr/3600) vehicles where c denotes cycle time in seconds [41]. Traffic lights are operated on the basis of a traffic cycle consisting of a green phase TG, an amber phase TA, a red phase TR, and a red-amber phase TAR which are adjusted in seconds such that:
 (1)
(1)
In this study, the number of vehicles that the signals allow off the ramp is calculated as the difference between the actual demand at the bottleneck, more specifically the sum of the mainline and ramp flows) and the pre-specified capacity of the road. The most critical point is the specification of the bottleneck capacity since it varies over time. Nevertheless, in most cases bottlenecks are also considered as having the same capacity as basic freeway segments which takes values between 1800 and 2200 veh./h/lane. The excess demand (De) would be determined from:
 (2)
(2)
where Da is the actual demand (in veh./h) including ramp and mainline flows and C (in veh./h) is the capacity of the downstream section of the bottleneck. Resulting from (4), the admissible ramp flow value (r) would be:
 (3)
(3)
The translation of the ramp flow value r into a corresponding green phase under a full traffic cycle plan, where the traffic cycle c is always equals to the metering period, would be based on the green ratio (f):
 (4)
(4)
Therefore, the green time leads to:
 (5)
(5)
4. Traffic Micro-Simulation Modeling
The Bosporus Bridge in Istanbul, Turkey, is the first of the two highway crossings connecting Asia and Europe over the Bosporus Strait. In this study the traffic from Asia to Europe direction along O1 route, schematically shown in Figure 1, is selected as the study site.
4.1. Study Site and Data
The corridor investigated has approximately 7 km of length, where there are 6 entrance ramps and 2 exit ramps up to the Bosporus Bridge. There are 4 main junctions entering/exiting to/from O1 Route and the bottlenecks are mostly occurring at around the downstream sections of the junctions (S4, S7, S11 and S13) due to the merging flow. In morning hours, especially weekdays the queue length may reach kilometers long and the average speed on the corridor can decrease down to 5 km/h which indicates a complete hyper-congestion.
The data is collected at the Istanbul Traffic Control Center at 14th of March, 2011. The traffic flow is observed from 6:00 a.m. to 11:30 a.m. through video recordings. Later, manual counts aggregated to 15 min. and inserted to commercial spreadsheet program (Microsoft Excel). The volumes at ramps are high between 6:00 a.m. and 7:00 a.m. especially most of the vehicles are medium type vehicles (minibus or midibus) which are used as service vehicles. Service vehicles could be classified as a special type of car sharing model which is mostly provided by companies free of charge to their employees. The hourly volumes of some ramps (S9, S10 and S12) even have higher volumes per lane than the mainline for a short time period.
The on-ramps have two different geometries as; 5 m width single lane and dual lanes with 3.5 m width. However, a virtual lane occurs at every single ramp during congested hours. The congestion starts at 6:45 m. and the flow decreases down to 400 veh./h/lane at the bottleneck downstream sections. It is observed that, once the breakdown occurs along the O1 Route, the congested flow remains invariant regardless of the time of the day which is verified by Sahin et al. [42].
The speeds are also calculated through the recorded videos despite the measurement is not based on an approved method. The average speed is represented by randomly taken cars (medium, heavy) for a time period. The speed profiles are only used in visual conformity check and not considered for calibration purposes due to possible measurement errors.
However, the results indicate that the speed profiles at ramps are relatively lower than mainline speed. The average mainline speed decreases down to 20 km/h after 6:45 a.m. and oscillates between 30 to 40 km/h for automobiles afterwards. The average ramp speed is around 20 km/h for automobiles and after 9:00 a.m. the speed increases to 30 km/h.
4.2. Calibration and Simulation
There are two ways to evaluate the performance of ramp metering systems: field operational tests and computer simulations. Although field tests provide more realistic results, due to the high costs and time consuming nature, traffic simulation studies are becoming more popular. In this study, widely accepted, discrete, stochastic, time step based microscopic traffic flow simulation software, VISSIM, is employed to test the performance of control strategies and compare their performances.
VISSIM utilizes psychophysical car following models which combines a perceptual driver behavior model with a vehicle dynamic model (1974, 1999) [43-45].
The study corridor is simulated for the morning peak hours which start from 6:30 a.m. to 9:30 a.m. and performance measurement interval is selected as 15 minutes.
The traffic composition and the priorities at the ramp weaving areas are set through the analyses of video recordings. It is observed that the vehicles entering to the mainline are more aggressive than the vehicles cruising on the right most lanes. Therefore the priority is given to the ramp flows over mainline flows in simulation. It is also watched that, if there is an enough gap the drivers tend to change the left most lane within the minimum possible distance. Typically, the drivers are highly aggressive and breaking and acceleration values are taken higher than the default values. Lane changing is also highly strong in Istanbul traffic and drivers are frequently cutting in and overtaking. The car following model is selected as Wiedmann 1999, which has ten driver behavior parameters labeled CC0-CC9. Several driver behavior parameters are reported to have significant impacts on roadway capacity and speed profiles thus, the parameters need to be optimized to attain the visual conformity and numerical correlation between the observation and simulation [46].

Figure 1. Segments of study corridor.
In the model calibration process, model parameters are altered until a qualitative and a quantitative balance between the simulation and the observation is reached. Traditionally, calibration requires several runs based on engineering judgment and experience. A three step calibration procedure is applied in this study, which are; calibration of driving behavior models, OD estimation and model fine-tuning.
The mean target headway and driver reaction time, which are the key user specified parameters in the car-following and lane changing models, can drastically influence overall driver behaviors of the simulation [46]. The calibrated values of the two parameters are 0.6 sec and 1.5 sec in this study. The calibration of ten parameters in car following model could be performed through some optimization techniques in order to achieve the most representative model. However, this is not the focus of this paper. Likewise, the local arterial roads are not included in the studied network hence, route choice is not considered in this calibration process.
In this study, the observations of Chu et al. [47] confirmed that the precise geometry of merging angle and connector link length have an impact of simulation accuracy. Proportion of each vehicle type, vehicle characteristics and performance, such as the acceleration and deceleration rate, driving restrictions, the speed limits and the driving lane restriction, the look back distance at merging and bifurcation weaving area, the priorities and traffic flow bases on conflicting areas also effects the simulation results.
In calibration process GEH index [48] is often used to test the relative difference between observed (Qo) and simulated (Qs) link volumes. GEH formula can be calculated with equation (6).
 (6)
(6)
The simulation model is acceptable for the GEH scores are smaller than 5 in 85% of the links and smaller than 4 for the sum of all link counts. The GEH values are below the limit values thus the simulation model developed is considered as representative.
In order to determine the optimal cycle time and green time for fixed time ramp metering control and examine the cycle time duration effects on network performance, a set of simulation experiments is designed. At each ramp, the green times are calculated for the average flows of entire simulation period by varying the signal cycle time from 5 to 20 seconds.
5. Efficiency and Equity Performance of Traffic Control Strategies
The objective of the freeway traffic control process is to optimize a performance index that mostly consists of efficiency measures. Performance index can be stated to minimize the travel times, delays, number of stops, or some other parameters such as fuel consumption and environmental pollution or in a more social context the optimization temporal and spatial of equity along the network or a more comprehensive objective that considers all the aspects with suitable weighting. However, only the efficiency properties are investigated for each control strategies in this study.
5.1. Efficiency Performance
The first performance measure is selected as total travel time. The Total travel time is calculated in hours for all active and arrived vehicles. In addition to the total travel time, the total delay in hours, the total number of stops and the average speed in km/h are evaluated by averaging values of 15 min. intervals for each simulation run.
Table 3 compares the performance measure of control strategies investigated. It shows that all the traffic control strategies significantly increase the network performance.
According to the results obtained, the best network performance achieved for FTRM control at 15 sec cycle time.
When the 15 sec cycle time control is compared with no control case, it can be seen that the total travel time, the total delay and the number of stops decreased by 32%, 60% and 80% respectively and the actual average speed increase from 29.2 km/h to 44.7 km/h.
5.2. Equity Performance
The results of the equity performances of on-ramps, mainline and the corridor is given for the indicators of spot speed, space mean speed and delay in Table 4.
From the evaluation results of on-ramps, mainline and
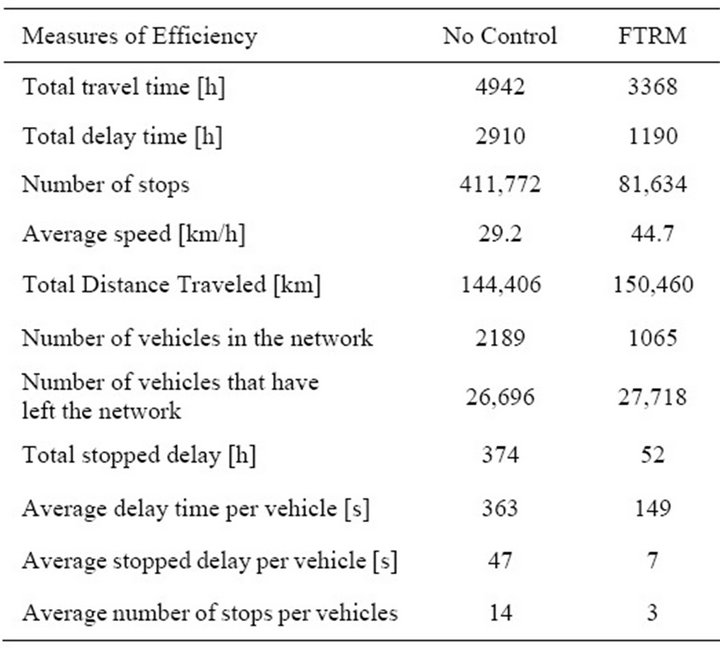
Table 3. Efficiency performance of FTRM.
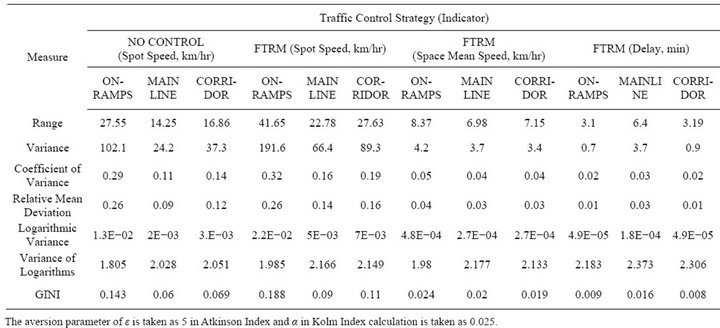
Table 4. Equity performance of FTRM control.
corridor wide performances, it is obvious that the FTRM increased the inequality on ramps when the spot speeds are taken into account. However, when equity of the on-ramps is compared through space mean speed and delay as indicators, the results are dramatically favoring the equity of no-control policy. The possible explanation for this controversy is the measurement methodology of the indicators. The equity measures are basically calculating the distribution of differences from the mean value. The spot speeds are relatively stable in no control case, which actually show the heavy congestion on ramps. With the help of FTRM, the on-ramps have a tendency to fluctuate because of no queue control mechanism which yields sudden spot speed changes on ramps. Therefore, the selection of spot speed detection location gains an extreme importance due to this fluctuating nature of FTRM control. On the other hand, the space mean speed and delay indicators create even more equal tableau than no-control case where the indicator calculations are based on spatial measurements.
6. Conclusions
This study demonstrates the potential of implementing traffic control strategies in alleviating the traffic congestion on an urban freeway. The fixed time ramp metering control is analyzed as a traffic control strategy. The traffic simulation network is modeled in a traffic micro simulation environment and the traffic model is calibrated for the analyses.
The FTRM is successfully increased the effectiveness of the traffic flow referring the total travel time, the total delay, the number of stop and average speed. The prevailed results lead that; there is an optimum cycle time that can be determined for each on ramp considering the bottleneck downstream capacity and flows. The short cycle lengths have a tendency to increase the start-up lost times and limits the merging rate, therefore the delay increases rapidly. Long cycle lengths allows platoon of vehicles entering the mainline which also contributes an increase in delay. The model shows that there is an optimum cycle length obtaining the best performance values for the merging section. The result of study is highly congruent with previous findings on sensitivity of delay to cycle length for intersections exhibited on 16-16 at Highway Capacity Manual [37].
Another important output of this study is the results accord with the existing literature suggesting that the ramp control brings equity concerns for ramp users when the spot speeds are taken into account [49]. From the results, it is also observed that the equity of ramps is worsened with the control strategy when it is compared to the equity of mainline and overall corridor.
Finally, the change in magnitude of equity with respect to the measure and indicator taken into account could be vast. Thus, first the equity indicators and measures should be evaluated carefully and then the performance should be interpreted accordingly to make a conclusive judgment.
As evaluation results indicated the controversial nature of selection and evaluation of efficiency and equity, the future research would be continuing on the examination of other traffic control strategies such as speed management, integrated control as well as dynamic ramp metering control.
7. Acknowledgements
The authors would like to thank PTV Japan for providing the license key of VISSIM and their continual support during the research. Ali Sercan Kesten acknowledges the support of ITU and TiTech, and his PhD research is supported by Ministry of Education, Culture, Sports, Science & Technology of Japan.
REFERENCES
- M. Papageorgiou, C. Diakaki, V. Dinopoulou, A. Kotsialos and Y. Wang, “Review of Road Traffic Control Strategies,” IEEE Proceedings, Vol. 91, No. 12, 2003, pp. 2043-2067.
- M. E. Hallenbeck, J. M. Ishimaru and J. Nee, “Measurement of Recurring versus Non Recurring Congestion,” Washington State Transportation Center, Olympia, 2003.
- J. Kwon, M. Mauch and P. Varaiya, “The Components of Congestion: Delay from Incidents, Special Events, Lane Closures, Weather, Potential Ramp Metering Gain, and Excess Demand,” Proceedings of 85th Annual Meeting of the Transportation Research Board (CD-ROM), Washington DC, 2006.
- M. Barth and K. Boriboonsomsin, “Real-World CO2 Impacts of Traffic Congestion,” Paper for the 87th Annual Meeting of Transportation Research Board, Washington DC, 2008, p. 10
- T. F. Golob, W. W. Recker and V. M. Alvarez, “Freeway Safety as a Function of Traffic Flow,” Accident Analysis and Prevention, Vol. 36, No. 2004, pp. 933-946. doi:10.1016/j.aap.2003.09.006
- G. Pesti, P. Wiles, R. L. Cheu, P. Songchitruksa, J. Shelton and S. Cooner, “Traffic Control Strategies for Congested Freeways and Work Zones,” Final Report FHWA/ TX-08/0-5326-2, Texas Transportation Institute, College Station, 2007.
- J. C. Williams, “Macroscopic Flow Models,” In: N. Gartner, C. J. Messer and A. K. Rathi, Eds., Traffic Flow Theory, Oak Ridge National Laboratory, Oak Ridge, Chapter 6, 1997, pp. 1-31.
- J.-F. Thisse, “How Transport Costs Shape the Spatial Pattern of Economic Activity,” Working Paper, OECD/ ITF, London, 2009.
- D. J. Rosa, “Sustainability and Infrastructure Resource Allocation,” Journal of Business & Economics Research (JBER), Vol. 7, No. 9, 2011, pp. 71-76.
- B. Santos, A. Antunes and E. J. Miller, “Integrating Equity Objectives in a Road Network Design Model,” Transportation Research Record: Journal of the Transportation Research Board, Vol. 2089, No. 1, 2008, pp. 35-42. doi:10.3141/2089-05
- P. Konings, S. Harper, J. Lynch, A. R. Hosseinpoor, D. Berkvens, V. Lorant and N. Speybroeck, “Analysis of Socioeconomic Health Inequalities Using the Concentration Index,” International Journal of Public Health, Vol. 55, No. 1, 2010, pp. 71-74. doi:10.1007/s00038-009-0078-y
- A. Pinto, H. Manson, B. Pauly, J. Thanos, A. Parks and A. Cox, “Equity in Public Health Standards: A Qualitative Document Analysis of Policies from Two Canadian Provinces,” International Journal for Equity in Health, Vol. 11, No. 1, 2012, p. 28. doi:10.1186/1475-9276-11-28
- J. L. Hall “The Distribution of Federal Economic Development Grant Funds: A Consideration of Need and the Urban/Rural Divide,” Economic Development Quarterly, 2010. doi:10.1177/0891242410366562
- J. L. Hall, “The Distribution of Federal Economic Development Grant Funds: A Consideration of Need and the Urban/Rural Divide,” Economic Development Quarterly, 2010. doi:10.1177/0891242410366562
- J. P. Chavas, “Equity Considerations in Economic and Policy Analysis,” American Journal of Agricultural Economics, Vol. 76, No. 5, 1994, pp. 1022-1033.
- B. Hansen, “The Political Economy of Poverty, Equity, and Growth: Egypt and Turkey,” Oxford University Press, Oxford, 1991. doi:10.2307/1243386
- H. P. Young, “Equity: In Theory and Practice,” Princeton University Press, Princeton, 1995.
- F. Cowell, “Measuring Inequality,” Oxford University Press, Oxford, 2011.
- M. T. Marsh and D. A. Schilling, “Equity Measurement in Facility Location Analysis: A Review and Framework,” European Journal of Operational Research, Vol. 74, No. 1, 1994, pp. 1-17. doi:10.1016/0377-2217(94)90200-3
- J. M. Viegas, “Making Urban Road Pricing Acceptable and Effective: Searching for Quality and Equity in Urban Mobility,” Transport Policy, Vol. 8, No. 4, 2001, pp. 289- 294. doi:10.1016/S0967-070X(01)00024-5
- A. Karlström and J. P. Franklin, “Behavioral Adjustments and Equity Effects of Congestion Pricing: Analysis of Morning Commutes during the Stockholm Trial,” Transportation Research Part A: Policy and Practice, Vol. 43, No. 3, 2009, pp. 283-296. doi:10.1016/j.tra.2008.09.008
- L. Jacobson, J. Stribiak, L. Nelson and D. Sallman, “Ramp Management and Control Handbook,” Federal Highway Administration, Washington DC, 2006.
- H. M. Zhang, T. Kim, X. Nie, W. Jin, L. Chu and W. Recker, “Evaluation of On-Ramp Control Algorithms,” California PATH Research Report, University of California, Berkeley, 2001.
- M. Hasan, “Evaluation of Ramp Control Algorithms Using a Microscopic Simulation Laboratory,” Master Thesis, Massachusetts Institute of Technology, Cambridge, 1999.
- J. R. Scariza, “Evaluation of Coordinated and Local Ramp Metering Algorithms Using Microscopic Traffic Simulation,” Master Thesis, Massachusetts Institute of Technology, Cambridge, 2003.
- R. Horowitz, X. Sun, L. Munoz, A. Skabardonis, P. Varaiya, M. Zhang and J. Ma, “Design, Field Implementation and Evaluation of Adaptive Ramp Metering Algorithm: Final Report, California PATH Research Report,” UCB-ITS-PRR-2006-21, 2006.
- K. Bogenberger and A. D. May, “Advanced Coordinated Traffic Responsive Ramp Metering Strategies,” California PATH Working Paper UCB-ITS-PWP-99-19, 1999.
- M. Papageorgiou, and A. Kotsialos, “Freeway Ramp Metering: An Overview,” IEEE Transactions on Intelligent Transportation Systems, Vol. 3, No. 4, 2002, pp. 271- 281.
- M. Papageorgiou, H. Haj-Salem and F. Middelham, “ALINEA Local Ramp Metering: Summary of Field Results,” Transportation Research Record, No. 1603, 1998, pp. 90-98.
- M. Papageorgiou, H. Haj-Salem and J. M. Blosseville, “ALINEA: A Local Feedback Control Law for On-Ramp Metering,” Transportation Research Record, No. 1320, 1991, pp. 58-64.
- H. M. Zhang and S. Ritchie, “Freeway Ramp Metering Using Artificial Neural Networks,” Transportation Research Part C: Emerging Technologies, Vol. 5, No. 5, 1997, pp. 273-286. doi:10.1016/S0968-090X(97)00019-3
- C. Taylor, D. Meldrum and L. Jacobson, “Fuzzy Ramp Metering—Design Overview and Simulation Results,” Transportation Research Record, Vol. 1634, 1998, pp. 10-18. doi:10.3141/1634-02
- C. Taylor and D. Meldrum, “Evaluation of a Fuzzy Logic Ramp Metering Algorithm: A Comparative Study among Three Ramp Metering Algorithms Used in the Greater Seattle Area WSDOT Technical Report WA-RD 481.2,” 2000.
- S. Ahn, R. L. Bertini, B. Auffray, J. H. Ross and O. Eshel, “Evaluating the Benefits of a System-Wide Adaptive Ramp-Metering Strategy in Portland,” Journal of Transportation Research Board, Transportation Research Record, Vol. 2007, No. 1, 2012, pp. 47-56.
- L. Chu, H. X. Liu, W. Recker and H. M. Zhang, “Performance Evaluation of Adaptive Ramp-Metering Algorithms Using Microscopic Traffic Simulation Model,” Journal of Transportation Engineering, Vol. 130, No. 3, 2004, pp. 330-338. doi:10.1061/(ASCE)0733-947X(2004)130:3(330)
- K. Ozbay, I. Yasar and P. Kachroo, “Modeling and PARAMICS Based Evaluation of New Local Freeway Ramp Metering Strategy That Takes into Account Ramp Queues,” Transportation Research Record, No. 1867, 2004, pp. 89-97.
- “Highway Capacity Manual,” Transportation Research Board, Washington DC, 2000.
- F. V. Webster, “Traffic Signal Settings,” Road Research Technique Paper No. 39, Road Research Laboratory, London, 1958.
- R. B. Allsop, “SIGSET: A Computer Program for Calculating Traffic Capacity of Signal-Controlled Road Junctions,” Traffic, Engineering and Control, Vol. 12, No. 2, 1971, pp. 58-60.
- M. Papageorgiou and I. Papamichail, “Handbook of Ramp Metering. Deliverable 7.5,” Report for the European IST Office, Brussels, 2007.
- M. J. Smith and T. Van Vuren, “Traffic Equilibrium with Responsive Traffic Control,” Transportation Science, Vol. 27, No. 2, 1993, pp. 118-132. doi:10.1287/trsc.27.2.118
- I. Sahin and G. Akyildiz, “Bosporus Bridge Toll Plaza in Istanbul, Turkey: Upstream and Downstream Traffic Features,” Transportation Research Record: Journal of the Transportation Research Board, Vol. 1910, No. 1, 2005, pp. 99-107.
- R. Wiedemann, “Simulation des Straßenverkehrsflusses,” Schtifienreihe des Instituts fur Verkehrswesen der Universität Karlsruhe, Heft 8, 1974 (in German).
- R. Wiedemann, “Modeling of RTI-Elements on Multilane Roads,” Advanced Telematics in Road Transport Edited by the Commission of the European Community, Vol. DG XIII, 1991.
- PTV, “VISSIM Version 5.40 User Manual,” PTV Planug Transport Verkehr AG, Stumpfstraße 1 D-76131 Karlsruhe, Germany, 2011.
- N. Lownes and R. Machemehl, “Vissim: A Multiparameter Sensitivity Analysis,” Winter Simulation Conference, Monterey, 3-6 December 2006, pp. 1406-1413.
- L. Chu and X. Yang, “Optimization of the ALINEA Ramp-Metering Control Using Genetic Algorithm with Micro-Simulation,” Transportation Research Board 82nd Annual Meeting, Washington DC, 12-16 January 2003, pp. 22-24.
- K. Chu, L. Yang, R. Saigal and K. Saitou, “Validation of Stochastic Traffic Flow Model with Microscopic Traffic Simulation,” IEEE International Conference on Automantion Science and Engineering, Trieste, 24-27 August 2011, pp. 672-677.
- L. Zhang and D. Levinson, “Ramp Metering and Freeway Bottleneck Capacity,” Transportation Research Part A, Vol. 44, No. 4, 2010, pp. 218-235. doi:10.1016/j.tra.2010.01.004
NOTES
*Corresponding author.
1The priority vehicles such as ambulances and security patrols are not considered within the context of this paper.
2Transfer; SI: Scale Invariance; TI: Translational Invariance.