Agricultural Sciences
Vol.4 No.4(2013), Article ID:30779,3 pages DOI:10.4236/as.2013.44029
Estimation of red tip disease severity in pineapple using a non-contact sensor approach
![]()
1Department of Agriculture Technology, Faculty of Agriculture, Universiti Putra Malaysia, Serdang, Malaysia; *Corresponding Author: siva@putra.upm.edu.my
2Department of Plant Protection, Faculty of Agriculture, Universiti Putra Malaysia, Serdang, Malaysia
3Department of Land Management, Faculty of Agriculture, Universiti Putra Malaysia, Serdang, Malaysia
Copyright © 2013 Siva Kumar Balasundram et al. This is an open access article distributed under the Creative Commons Attribution License, which permits unrestricted use, distribution, and reproduction in any medium, provided the original work is properly cited.
Received 12 February 2013; revised 20 March 2013; accepted 21 April 2013
Keywords: Pineapple; Red Tip Disease; Optical Sensor
ABSTRACT
Red tip disease on pineapple (Ananas comosus) was first recognized about 20 years ago in a commercial pineapple stand located in Simpang Renggam, Johor, Peninsular Malaysia. Since its discovery, there has been no confirmation on the causal agent of red tip disease. The epidemiology of red tip disease is still not fully understood. However, based on disease symptoms and field transmission mode, red tip disease seems to be strongly associated with viral infection. The aim of this work was to assess the feasibility of using an optical sensor to estimate red tip disease severity. This work was performed in a commercial pineapple plantation located in Simpang Renggam, Johor. Four observation plots bearing pineapple variety SR36 were demarcated based on crop growth stage. Each plot comprised a total of eighty corresponding measurements of percent Disease Severity (% DS) and Normalized Difference Vegetation Index (NDVI). Our data showed a strong correlation between % DS and NDVI. The 7- and 11- month plantings registered a correlation coefficient (r) of −0.83 and −0.88, respectively. The negative correlation infers that NDVI increases when disease severity is low. This is expected since healthy leaves reflect more near-infrared light and less visible light which results in a higher NDVI. The regression of NDVI on % DS for the 7-month planting was explained by: % DS = 181.6 - 185.6*NDVI. Meanwhile, the regression of NDVI on % DS for the 11-month planting was explained by: % DS = 213.2 - 219.8*NDVI. The linear fit between measured % DS and estimated % DS from the 7-month and 11-month plantings was relatively strong. This work has demonstrated that NDVI is a reliable predictor of % DS in pineapple.
1. INTRODUCTION
Malaysian pineapple yields have declined by more than 50% over the past 15 years. One of the main causes of pineapple yield decline is disease susceptibility. Several pineapple diseases have been reported in Malaysia, including red tip in Gandul variety. Typical symptoms of red tip disease include reddening of more than 10% of the total leaves per plant, downward curling, tip dieback, stunting, and early ripening of fruits. The epidemiology of red tip disease is still not fully understood. At present, red tip-infected plants can only be determined based on visible symptoms, which occur as early as six months after planting.
Early detection of crop stress will help minimize production losses, especially in large scale plantings. Recent advancement in remote sensing technology offers the potential of early detection of crop stress non-destructively. Remote sensing has been shown to be a powerful tool for monitoring of crop growth [1,2]. The ability to detect crop diseases via remote sensors lies on the premise that there is a fundamental relationship between the electromagnetic spectrum and the biophysical processes within a crop. Crop stress caused by disease will result in metabolic changes that will eventually lead to changes in the way the crop reflects incident radiant energy.
Greenseeker® is a handheld optical sensor that nondestructively captures reflectance energy from target surfaces within the visible and near infra red regions of the electromagnetic spectrum. These regions are known to provide information about plant physiological stress [3].
Normalized Difference Vegetation Index (NDVI) from Greenseeker® has been shown to correlate well with leaf chlorophyll content [4], which provides on-the-go diagnostic capability for Nitrogen (N) management. The utility of Greenseeker® for in-season monitoring of N in crops is well documented [5-8]. Greenseeker® has also been shown to be a suitable tool for cultural monitoring in viticulture [9].
A non-destructive sensor approach of disease detection will potentially save time previously spent on randomly scouting for potential disease problems, and offers valuable quantitative and near real-time information about crop health. This work was aimed at assessing the feasibility of using Greenseeker® to estimate red tip disease severity in pineapple.
2. MATERIALS AND METHODS
2.1. Experimental Site
This work was carried out in July of 2009 in a commercial pineapple plantation located in Simpang Renggam, Johor (1˚50'0" North, 103˚19'0" East), a state located in the south of Peninsular Malaysia. Pineapple in this plantation is cultivated on deep peat (classified as “Saprist”) and its cultivation is based on a biennial cropping cycle, which includes a 6-month fallow period. The peat in this site had a pH of 2.96 - 3.21, a bulk density of 0.2 - 0.3 g cm−3, extractable phosphorus of 20 mg∙kg−1, extractable potassium of 520 mg∙kg−1, extractable calcium of 775 mg∙kg−1 and extractable magnesium of 70 mg∙kg−1.
2.2. Plot Layout
Four 1-ha plots bearing pineapple variety SR36 (a cross between Gandul and Sarawak) were demarcated based on crop growth stage (i.e. 7- and 11-month after planting). Two plots were used for crop sampling followed by model calibration, and two others were used for model validation. A total of eighty points were geo-referenced using a global positioning device (Trimble Pathfinder Pro XR) using a systematic sampling scheme.
2.3. Crop Measurements
Each crop sample was measured for Disease Severity (DS) and NDVI. DS was taken as the percentage of leaves showing red tip disease symptoms (i.e. leaf reddening, tip dieback and downward curling). NDVI, computed as the ratio of measured intensities in the visible and near infra red bands, was obtained in real-time using GreenSeeker® (Model 505; NTech Industries Inc., California, USA). The effective distance between the GreenSeeker® and the crop canopy was set at 20 cm.
Each NDVI record from a crop sample was averaged from ten recordings within the same crop sample. A total of eighty corresponding measurements of % DS and NDVI were obtained from each observation plot. In each plot, % DS and NDVI recordings were taken at every five planting beds, where each bed comprised two randomly selected crop samples as recording points.
2.4. Data Analysis
Correlation and regression analyses were performed using Minitab 14 to determine the relationship between % DS and NDVI.
3. RESULTS AND DISCUSSION
The correlation between NDVI and % DS was strong. The 7- and 11-month plantings registered r values of −0.83 and −0.88, respectively. The negative correlation infers that NDVI increases when disease severity is low. This is expected since healthy leaves reflect more near infra red light and less visible light which results in a higher NDVI.
The regression of NDVI on % DS for the 7-month planting was explained by the following model: % DS = 181.6 - 185.6*NDVI (Figure 1). Meanwhile, the regression of NDVI on % DS for the 11-month planting was explained by the following model: % DS = 213.2 - 219.8*NDVI (Figure 2). The linear fit between measured % DS and estimated % DS from the 7-month and 11-month plantings were relatively strong with an R2 of 0.71 and 0.84, respectively (Figures 3 and 4).
Results clearly show that increased red tip disease severity was associated with the increase in visible light reflectance (from 0.4 to 0.7 µm), and decrease in near infra red reflectance (from 0.7 to 1.1 µm). Stressed vegetation reflects more visible light and less near infra
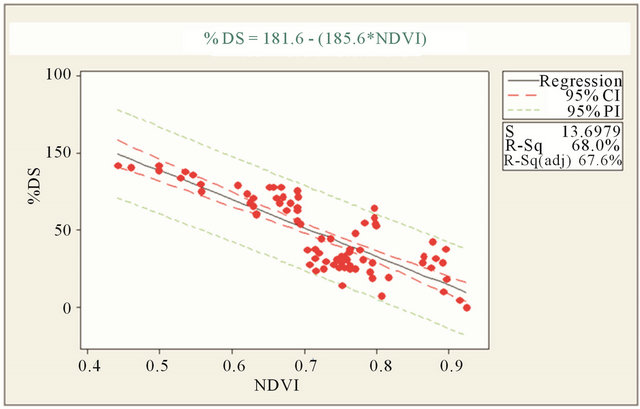
Figure 1. Regression of NDVI on % DS at 7 months after planting.
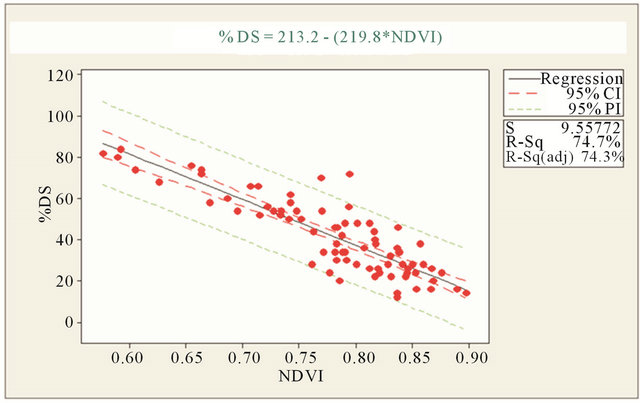
Figure 2. Regression of NDVI on % DS at 11 months after planting.
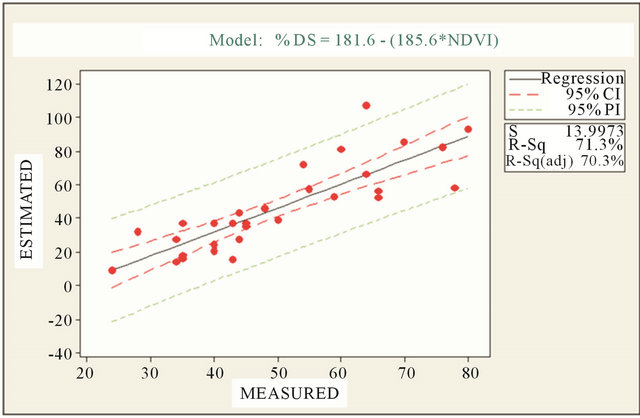
Figure 3. Accuracy of model estimation for 7-month plantings.
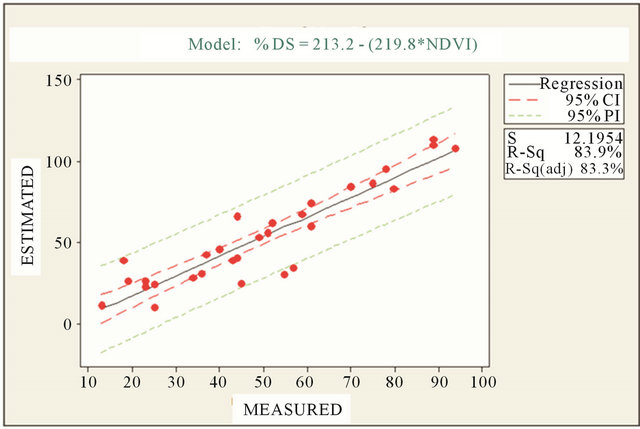
Figure 4. Accuracy of model estimation for 11-month plantings.
red light possibly because of its lower concentration of chlorophyll, which then facilitates expression of other photosynthetic pigments [10]. Stunted pineapple with high red tip disease severity typically displays intense reddening and wilting on 25% - 50% of its leaf surface.
Both regression models give a reasonable estimative ability of red tip disease severity. Thus, NDVI is a reliable estimator of red tip disease severity in pineapple. This work has demonstrated the utility of a remote sensing approach for detection and preliminary screening of crop disease.
4. CONCLUSION
This work suggests that the Greenseeker® is a feasible tool for non-destructive estimation of red tip disease in pineapple.
REFERENCES
- Abou-Ismail, O., Huang, J.F. and Wang, R.C. (2004) Rice yield estimation by integrating remote sensing and rice growth simulation model. Pedosphere, 14, 519-526.
- Zhang, M. and Qin, Z. (2004) Spectral analysis of tomato late blight infection for remote sensing of tomato disease stress in California. IEEE 2004 International Geosciences and Remote Sensing Symposium, Anchorage, 4091-4094.
- Muhammed, H.H. (2005) Hyperspectral crop reflectance data for characterizing and estimating fungal disease severity in wheat. Biosystems Engineering, 91, 9-20. doi:10.1016/j.biosystemseng.2005.02.007
- Lu, Y.L., Bai, Y.L., Yang, L.P. and Wang, L. (2008) Diagnosis on nitrogen status using greenseeker in spring maize. Journal of Maize Sciences, 16, 111-114.
- Shaver, T.M., Khosla, R. and Westfall, D.G. (2011) Evaluation of two crop canopy sensors for nitrogen variability determination in irrigated maize. Precision Agriculture, 12, 892-904. doi:10.1007/s11119-011-9229-2
- Solari, F., Shanahan, J., Ferguson, R., Schepers, J. and Gitelson. A. (2008) Active sensor reflectance measurements of corn nitrogen status and yield potential. Agronomy Journal, 100, 571-579. doi:10.2134/agronj2007.0244
- Singh, I., Srivastava, A.K., Chandna, P. and Gupta, R.K. (2006) Crop sensors for efficient nitrogen management in sugarcane: Potential and constraints. Sugar Technology, 8, 299-302. doi:10.1007/BF02943572
- Inman, D., Khosla, R. and Mayfield, T. (2005) On-the-go active remote sensing for efficient crop nitrogen management. Sensor Review, 25, 209-214. doi:10.1108/02602280510606499
- Mazzetto, F., Calcante, A. and Mena, A. (2009) Comparing commercial optical sensors for crop monitoring tasks in precision viticulture. Journal of Agricultural Engineering, 40, 11-18.
- Chappelle, E.W., Wood, F.M., McMurtrey, J.E. and Newcomb, W.W. (1984) Laser-induced fluorescence of green plants: 1. A technique for the remote detection of plant stress and species differentiation. Applied Optics, 23, 134-138. doi:10.1364/AO.23.000134