Agricultural Sciences
Vol. 4 No. 2 (2013) , Article ID: 28202 , 6 pages DOI:10.4236/as.2013.42014
Effect of closed circuits drip irrigation system and lateral lines length on growth, yield, quality and water use efficiency of soybean crop
![]()
Water Relation and Field Irrigation Department, National Research Center, Giza, Egypt; *Corresponding Author: mansourhani2011@gmail.com
Received 4 December 2012; revised 5 January 2013; accepted 12 January 2013
Keywords: Closed Circuits; Drip Irrigation; Lateral Lines; Soybean; WUE
ABSTRACT
Field experiment was conducted for one growing season (2012) in clay loam soil at the Experimental Farm of Faculty of Agriculture, Southern Illinois University at Carbondale (SIUC), USA on soybean crop to study the effect of: 1) the closed drip irrigation system: closed circuits with one and two a manifolds for lateral lines (CM1DIS; CM2DIS) and traditional drip irrigation system (TDIS) as a control; and 2) lateral lines length (LLL): LLL1, LLL2 and LLL3 (40, 60, 80 m) on soybean growth, yield, oil, protein content and water use efficiency. Plants were drip irrigated every 4 days. N, K2O and P2O5 fertilizers were added via irrigation water. Data obtained could be outlined as follows: 1) According to the mean values of soybean crop growth (leaf area; plant height), yield (grain and straw), both oil and protein content and water use efficiency, the treatment used could be ranked in the following ascending orders: TDIS < CM1DIS < CM2DIS and LLL3 < LLL2 < LLL1; 2) Differences in the means of the studied data among treatments used were significant at the 1% level; 3) The effects of the DIC × LLL on the data obtained were significant at the 1 % level; and 4) The highest values of the obtained data and the lowest ones were achieved in the following interactions: CM2DIS × LLL1; TDIS × LLL3, respectively.
1. INTRODUCTION
Soybean is one of the most important world crops. It is grown for oil and protein [1]. It had been mentioned that the present world production is about 6.2 million tons of seed over 45 million ha. According to [1] the growth periods most sensitive to water deficit of soybean are the last part of the flowering stage and the early part of the yield formation (pod development). When water supply is limited, saving in water can be made by reducing the supply during the vegetative period and near crop maturity. [2] mentioned that irrigation is an important and an increasingly common practice in Georgia and other southeastern states for soybean production, as shown by an expansion in irrigated acreage from almost 9000 ha in 2000 to more than 40,000 in 2008. Soybean yield had been reported as low as 807 kg∙ha−1 in 1980 and as high as 2220 kg∙ha−1 in 2003 [3]. This large difference are mainly due to droughts, evidencing the need for supplemental irrigation in Georgia, despite humid climate. Several studies conducted for a wide range of environments have demonstrated that soybean yield increases with irrigation [4-7].
Closed drip irrigation circuits have used in attempts to overcome the drop in pressure at the end of the lateral line of drip irrigation system. [8-13] carried out laboratory and field experiments to study the effects of: Closed drip irrigation circuit with one manifold for lateral lines (CM1DIS), with two manifolds for lateral lines (CM2- DIS); traditional drip irrigation system as a control (TDIS) and lateral lines and length (LLL) of 40, 60, 80 m (LLL1, LLL2, LLL3) and their interactions on some hydraulic characteristics of the irrigation system, corn yield, water, fertilizer use efficiency per unit of irrigation water and fertilizer used. Their data could be summarized in the following: 1) Relative to TDIS, both CM2DIS and CM1DIS improved the studied hydraulic characteristics (pressure head, friction loss, flow velocity, lateral discharge, uniformity coefficient; coefficient of variation), corn yield and use efficiency of both water and fertilizer; 2) The mean effects of both DIC and LLL treatments on the studied parameters were significant at the 1%; 3) The effect of DIC × LLL on the parameters under investigation were significant at the 1% level; and 4) concerning the improving effect on the investigated parameters, the treatments could be stated in the following increasing orders: TDIS < CM1DIS < CM2DIS and LLL3 < LLL2 < LLL1.
2. MATERIAL AND METHODS
The field experiments design was split in randomized complete block design with three replicates. Laboratory tests carried out using three irrigation lateral lines L1, L2; L3 (40, 60, 80 m) and the following three drip irrigation circuits (DIC): 1) One manifold for lateral lines or closed circuits with one manifold of drip irrigation system (CM1DIS); 2) Closed circuits with two manifolds for lateral lines (CM2DIS); and 3) traditional drip irrigation system (TDIS) as a control.
Tables 1-3 indicated there some (physical and chemical) characteristics of there the location and irrigation water, respectively.
Irrigation networks include the following components are: 1) Control head: It was located at the water source supply. It consists of centrifugal pump 3"/3", driven by electric engine (pump discharge of 80 m3/h and 40 m lift), sand media filter 48" (two tanks), screen filter 2" (120 mesh), back flow prevention device, pressure regulator, pressure gauges, flow-meter, control valves and chemical Injection; 2) Main line: PVC pipes of 75mm in (ID) Ø to convey the water from the source to the main control points in the field; 3) Sub-main lines: PVC pipes of 75 mm in (ID) Ø were connected to with the main line through a control unit consists of a 2" ball valve and pressure gauges; 4) Manifold lines: PVC pipes of 50 mm in (ID) Ø were connected to the sub main line through control valves 1.5"; 5) Lateral lines: PE tubes of 16 mm in (ID) Ø were connected to the manifolds through beginnings stalled on manifolds lines; 6) Emitters: These emitters (GR) built in PE tubes 16 mm in (ID) Ø, emitter discharge of 4 lh-1 at 1 atm, Operating pressure and 30 cm spacing in-between. The components of closed circuits of the drip system include, supply lines, control valves, supply and return manifolds, drip lateral lines, emitters, check valves and air relief valves/vacuum breakers.
2.1. Irrigation Scheduling
Intervals of irrigation (I) in day were calculated using the following equations:
 (1)
(1)
where: d = net water depth applied per each irrigation (mm), and ETc = crop evapotranspiration (mm/day).
Table 1. Some physical properties of the soil*.
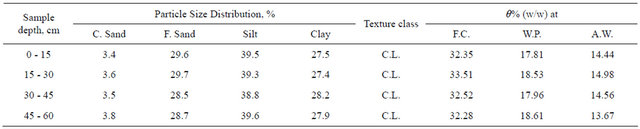
*Particle size distribution after [13] and moisture retention after [14]; C.L.: Clay Loam; F.C.: Field Capacity; W.P.: Wilting Point; A.W.: Available Water.
Table 2. Some chemical properties of the soil (saturated extracted)*.
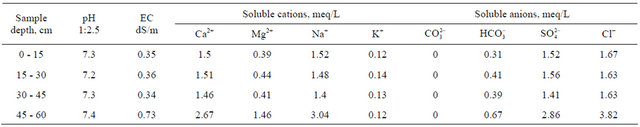
*Chemical properties after [15].
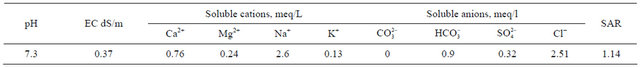
Table 3. Some chemical properties of irrigation water.
 (2)
(2)
where: AMD = allowable soil moisture depletion (%), ASW = available soil water, (mm water/m depth), Rd = effective root zone depth (m), or irrigation depth (m), and p = percentage of soil area wetted (%).
 (3)
(3)
where: B.D. = soil bulk density (gm∙cm−3).
Irrigation Intervals used was 4 days under both closed circuits and traditional drip irrigation systems.
2.2. Measuring the Seasonal Evapotranspiration (ETc)
The (ETc) was computed using the Class Pan evaporation method for estimating (ETo) on daily basis was taken from nearest meteorological station as showing in Table 4.
The modified pan evaporation equation to be used:
ETo = KpEp (4)
where: ETo = reference evapotranspiration [mm∙day−1], Kp = pan coefficient of 0.76 for Class A pan placed in short green cropped and medium wind area. Ep = daily pan evaporation (mm∙day−1), seasonal average is [7.5 mm∙day−1] [16].
The reference evapotranspiration (ETo) is then multiplied by a crop coefficient Kc at particular growth stage to determine crop consumptive use at that particular stage of maize growth.
Etc = EToKc (5)
The reduction factor (Kr) was calculated using Eq.6.
 (6)
(6)
where: GC = ground cover percentage.
Irrigation efficiency (Ea) was calculated by Ea = Ks∙Eu (7)
where: Ea = irrigation efficiency (%), Eu = emission uniformity (%) and Ks = reduction factor of soil wetted.
The gross irrigation water requirements IWRg (mm depth) were calculated according to:
IWRg = IWRn∙Ea + Lr (8)
where: IWRg = the gross irrigation water requirements, IWRn = the net irrigation water requirements and Lr = the extra amount of water needed for leaching.
Soybean seeds were (Glycine max-L, Rils-75) Varity was cultivated on April 15th. The distance between rows was 0.7 m and 0.15 m between plants in the row. Plants densities were 55,500 plants per fed according to (ISU). Each row was irrigated by a single straight lateral line in the closed circuits and traditional drip irrigation plots. Figure 1 shows that the total experimental area was 4536 m2. Under each of the tested drip irrigation circuits, plot areas of Lateral lines lengths were 168, 252 and 336 m2 under LLL1, LLL2 and LLL3, respectively. Soybean was harvested on September 11. Irrigation season of Soybean was ended 10 days before harvest. Fertilization program had been done according to the recommended doses throughout the growing season using fertigation technique. These amounts of fertilizers NPK (20-20-10), were 74.6 kg/fed of N and 33.0 kg/fed of K2O. While 60.5 kg/fed of P2O5. For all plots, weed and pest control applications followed recommendations of Soybean yield.
Table 4. Water requirements for soybean grown at experimental site.
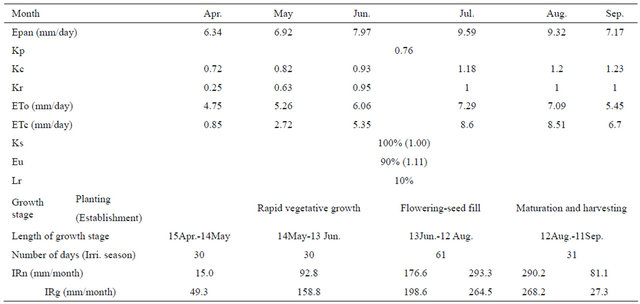

Figure 1. Layout of the field experimental plots: using DIC, (CM2DIS, CM1DIS and TDIS); and (LLL1 = 40 m; LLL2 = 60 m and LLL3 = 80 m) treatments.
2.3. Measurements of Soybean Plant Growth Yield and Quality
Plant measurements and observations were started 21 days after planting, and were terminated on the harvest date. Yield and components including leaf area (cm2) by Plano meter, plant height (cm) by meter measuring, total grain and straw (Kg/fed) by balance; oil and protein (g/kg). Oil and protein determined in Grain Quality Laboratory using near-infrared analysis. All plant samples were dried at 65˚C until constant weight. Grain yield was determined by hand harvesting the 8 m sections of three adjacent center rows in each plot and was adjusted to 15.5% water content. In all treatments plots, the grain yields of individual rows were determined in order to evaluate the yield uniformity among the rows.
MSTATC program (Michigan State University) was used to carry out statistical analysis. Treatments mean were compared using the technique of analysis of variance (ANOVA) and the least significant difference (L.S.D.) between systems at 1% [17].
3. RESULTS AND DISCUSSION
3.1. Leaf Area (cm2) and Plant Height (cm)
Table 5 indicated the effects of DIC and LLL treatments on leaf area and plant height, treatments used could be ranked in following descending orders: CM2DIS ≥ CM1DIS < TDIS and LLL1 < LLL2 < LLL3. Differences in leaf area and plant height between means of the two factors studied were significant at the 1% level except that between CM2DIS and CM1DIS for both leaf area and plant height and between LLL1 and LLL2 for plant height. The effects of DIC × LLL on plant height and leaf area were significant at the 1% level. The superiority of the studied growth parameters under (CM2DIS; CM1DIS relative to TDIS) and (LLL1; LLL2 relative to LLL3) can be noticed. This superiority was due to improving both water and fertilizers distribution uniformity [8-12].
3.2. Grain and Straw Yield (kg/fed)
Table 5 showed the effect of DIC and LLL treatments on grain and straw yield (kg/fed). They could be ranked in following descending order: CM2DIS > CM1DIS > TDIS and LLL1 > LLL2 > LLL3. Differences in grain and straw yield between means of any two treatments were significant at the 1% level except that between CM1DIS and CM2DIS in straw yield. The effects of the DIC × LLL on both grain and straw yield were significant at the 1% level. The highest and lowest values of both grain and straw yield were recorded in the interacttions: CM2DIS × LLL1 and TDIS × LLL3, respectively. This superiority was due to improving both vegetative growth, water and fertilizers distribution uniformity [8-13].
3.3. Oil and Protein (g/kg)
Data in Table 5 indicated the effects of DIC and LLL treatments on Soybean oil and protein production (g/kg), both of them could be ranked in the following ascending orders: TDIS < CM1DIS < CM2DIS and LLL3 < LLL2 < LLL1, respectively. In respect to the main effect of (DIC) on both of oil and protein, one can notice that, the differences in both of oil and protein were significant among all DIC and LLL treatments at the 1% level except that between CM1DIS and CM2DIS in oil. The highest and lowest oil and protein were obtained in the interactions CM2DIS × LLL1 and TDIS × LLL3, respec-
Table 5. Effect of irrigation circuits designs and lateral lines lengths on soybean plants growth yield and quality (operating pressure = 1 atm and slope = 0%).
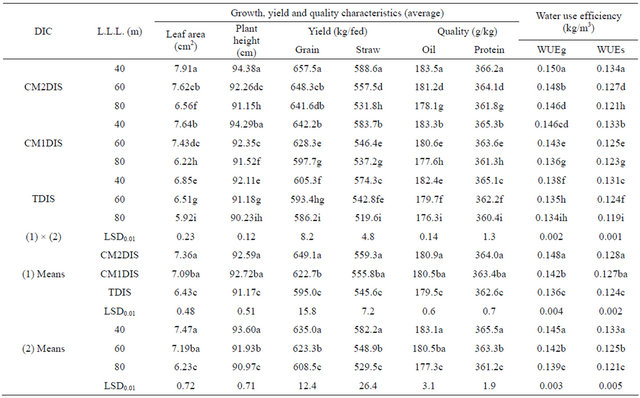
DIC: Irrigation circuit design; L.L.L.: Lateral line length; CM2DIS: Closed circuits with tow manifolds separately; CM1DIS: Closed circuits with one manifold; TDIS: Traditional drip irrigation system.
tively.
3.4. WUEg and WUEs (kg/m3)
Table 5 showed the effects of both DIC and LLL treatments on WUEg and WUEs (kg/m3). We can notice that the changes in WUEg and WUEs took the same trend of growth, grain, straw, parameters and thus took the trend of quality (oil; protein). Concerning the positive effects of DIC and LLL treatments on WUEg and WUEs, they could be ranked in following descending orders: CM2DIS > CM1DIS > TDIS and LLL1 > LLL2 > LLL3, respecttively. Differences in WUEg and WUEs between means of any two treatments were significant at the 1% level except that between CM1DIS and CM2DIS in WUEs. The effect of the DIC × LLL on WUEg and WUEs were significant at 1% level. The highest and lowest values of WUEs were obtained at CM2DIS × LLL1 and TDIS × LLL3, respectively. We can notice that the Soybean WUEg, WUEs oil and protein took the same trend of other vegetative growth and yield parameters, and this finding could be attributed to the close correlation between vegetative growth; grain yield from side and quality of oil and protein production from the other one [8- 12].
4. CONCLUSIONS
Data on hand could be stated in the following:
1) According to the mean values of soybean crop growth (leaf area; plant height), yield (grain and straw), both oil and protein content and water use efficiency, the treatment used could be ranked in the following ascending orders: TDIS < CM1DIS < CM2DIS and LLL3 < LLL2 < LLL1;
2) Differences in the means of the studied data among treatments used were significant at the 1% level;
3) The effects of the DIC × LLL on the data obtained were significant at the 1% level;
4) The highest values of the obtained data and the lowest ones were achieved in the following interactions: CM2DIS × LLL1; TDIS × LLL3, respectively.
REFERENCES
- Fao (1979) Yield response to water. FAO Irrigation and Drainage Paper, 33, 193.
- Harrison, K.A. (2009) Irrigation survey. Cooperative Extension Service, College of Agricultural and Environmental Sciences, The University of Georgia, Tifton. http://www.nespal.org/sirp/agwateruse/facts/survey/.%5C2009.0122.IrrSurvey08%20misc%20pub.pdf
- United States Department of Agriculture—National Agriculture Statistics Service, 2009. http://www.nass.usda.gov/Quick_Stats/
- Dogan, E., Kirnak, H. and Copur, O. (2007) Deficit irrigations during soybean reproductive stages and CROPGRO-soybean simulations under semi-arid climatic conditions. Field Crops Research, 103, 154-159. doi:10.1016/j.fcr.2007.05.009
- Sincik, M., Candogan, B.N., Demirtas, C., Büyükacangaz, H., Yazgan, S. and Goksoy, A.T. (2008) Deficit irrigation of soybean [Glycine max (L.) Merr.] in a sub-humid climate. Journal of Agronmy and Crop Science, 194, 200- 205. doi:10.1111/j.1439-037X.2008.00307.x
- Bajaj, S., Chen, P., Longer, D.E., Shi, A., Hou, A., Ishibashi, T. and Brye, K.R. (2008) Irrigation and planting date effects on seed yield and agronomic traits of earlymaturing soybean. Journal of Crop Improvement, 22, 47- 65. doi:10.1080/15427520802042937
- Gercek, S., Boydak, E., Okant, M. and Dikilitas, M. (2009) Water pillow irrigation compared to furrow irrigation for soybean production in a semi-arid area. Agricultural Water Management, 96, 87-92. doi:10.1016/j.agwat.2008.06.006
- Mansour, H.A. (2012) Design considerations for closed circuits of drip irrigation system. Ph.D. Thesis, Ain Shams University, Cairo.
- Tayel, M.Y., Mansour, H.A. and Lightfoot, D. A. (2012) Effect of different closed circuits and lateral line lengths on pressure head and friction loss. Agriculture Science Journal, 3, 392-399.
- Tayel, M.Y., Mansour, H.A. and Lightfoot, D. A. (2012) Effect of different closed circuits and lateral line lengths on flow velocity and velocity head. Agriculture Science Journal, 3, 531-537.
- Tayel, M.Y., Mansour, H.A. and El-Gindy, A.M. (2012) Effect of different closed circuits and lateral line lengths on dripper and lateral discharge. Journal of Applied Sciences Research, 8, 2725-2731.
- Tayel, M.Y., Mansour, H.A. and El-Gindy, A.M. (2012) Effect of different closed circuits and lateral line lengths on uniformity coefficient and coefficient of variation. Journal of Applied Sciences Research, 8, 2741-2748.
- Gee, G.W. and Bauder, J.W. (1986) Particle-size analysis. In: Klute, I.I., Ed., Methods of Soil Analysis, Soil Science Society of America, Madison, 383-412.
- Klute, A. (1986) Moisture retention. In: Klute, A. Ed., Methods of Soil Analysis, Soil Science Society of America, Madison, 635-662.
- Rebecca, B. (2004) Soil survey laboratory methods manual. Soil Survey Laboratory Investigations Report, No. 42.
- Allen, R.G., Pereira, L.A., Raes, D. and Smith, M. (1998) Crop evapotranspiration. FAO Irrigation and Drainage Paper, 56, 293.
- Steel, R.G.D. and Torrie, J.H. (1980) Principles and procedures of statistics. A biometrical approach. 2nd Edition, McGraw-Hill Book Company, Tokyo.