Low Carbon Economy
Vol.5 No.2(2014), Article
ID:47466,14
pages
DOI:10.4236/lce.2014.52009
Estimation of Carbon Emission Reductions by Managing Dry Mixed Deciduous Forest: Case Study in Popa Mountain Park
Yu Ya Aye1,2*, Savent Pampasit1, Chanin Umponstira1, Kanita Thanacharoenchanaphas1, Nophea Sasaki3
1Department of Natural Resources and Environment, Faculty of Agriculture, Natural Resources and Environment, Naresuan University, Phitsanulok, Thailand
2Forest Research Institute, Forest Department, Ministry of Environmental Conservation and Forestry, Naypyitaw, Myanmar
3Graduate School of Applied Informatics, University of Hyogo, Kobe, Japan
Email:*yuyaaye@gmail.com
Copyright © 2014 by authors and Scientific Research Publishing Inc.
This work is licensed under the Creative Commons Attribution International License (CC BY).
http://creativecommons.org/licenses/by/4.0/


Received 29 April 2014; revised 25 May 2014; accepted 20 June 2014
ABSTRACT
Global efforts in mitigating climate change are increasingly important as more evidence of climate change impact is apparent. Reducing carbon emissions under the United Nations’ reducing emissions from deforestation and forest degradation, conservation of carbon stocks, sustainable management of forests, and enhancement of forest carbon stocks (REDD+) have multiple implications for climate change mitigation and sustainable development. However, implementing REDD+ project requires understanding of the magnitude of emissions in the absence of project activities (baseline) and vice versa (projectline). This study attempted to estimate carbon emission reductions by reducing deforestation in dry mixed deciduous forests in Popa Mountain Park in Myanmar. Baseline deforestation was determined using the 1989-2005 forest cover data, while carbon stocks were derived from forest inventory data. Our results show that about 25% to 63% of forest area in the study site will be lost between 2013 and 2043 if no REDD+ project is implemented. Our study results suggest that managing 4220 ha of dry mixed deciduous forest in Popa Mountain Park could reduce emissions of about 104023.8 - 241991.0 tCO2 over a 30-year project cycle or about 3467 - 8066 tCO2 annually depending on deforestation rates. In terms of carbon revenues, the project would generate about US $349503.3 - $846968.6 per 30 years or US $11650.1 - $28232.3 annually depending on the assumption of carbon price. It is therefore important that carbon financing be made available to protect the forests in the Popa Mountain Park as well as other parts in Myanmar.
Keywords:Baseline Deforestation, Carbon Revenues, Emission Reductions, Deforestation, Forest Degradation, Myanmar

1. Introduction
Forests can be a sink or a source of atmospheric carbon depending on the management regimes designed to achieve one or more objectives [1] . Forests play multiple roles in climate change mitigation because of their ability to absorb and store large quantities of atmospheric carbon through the process of photosynthesis. On the contrary when deforested or degraded, carbon emissions occur [2] . About 52% of the world’s forests are concentrated in the tropics, where high rates of deforestation and land conversion have occurred [3] . Food and Agriculture Organization of the United Nations [4] estimates that 13 million ha of tropical forest are lost annually, contributing 12% - 20% of the anthropogenic global greenhouse gas emissions [5] . Hence, Reducing Deforestation and Degradation in Developing Countries (REDD) is under consideration by United Nations Framework Convention on Climate Change (UNFCCC). At the thirteenth conference of parties (COP13) of the United Nations Framework Convention on Climate Change (UNFCCC) held in 2007 in Bali, world leaders agreed to encourage countries to initiate activities to reduce emissions from deforestation and forest degradation in developing countries, the REDD [6] . Therefore, reducing deforestation and forest degradation is a high-priority mitigation option within tropical regions [7] and the most cost effective way to combat climate change [8] .
The REDD concept is the performance-based financial incentive for mitigating climate change through the reducing of emissions from deforestation and forest degradation, improving forest conservation and sustainable management of forests, and enhancement of carbon stocks. Estimating emission reduction potentials require the understanding of the Reference Emission Level (REL; emission in the absence of project activities or baseline emissions) and the Project Emission Level (PEL; emissions from project implementation) [9] . Likewise, identification of the drivers and management interventions for reducing deforestation and forest degradation and establishment of REL are the fundamental activities for developing REDD+ projects in developing countries [10] . Until recently, developing countries (Non-Annex I countries of the Kyoto Protocol) still lack of information on the emission baseline or REL to enable them to benefit from the REDD+ scheme [11] .
Approximately 47% of Myanmar’s total area is forested. The total area of deciduous forests is 12,157,000 ha (38.3% of the country’s total forests area). According to FAO, Myanmar is one of the ten countries with the largest annual net loss of forest area. Deforestation was 310,000 ha or 0.93% annually between 2000-2010 [4] . Deforestation and forest degradation have also affected the livelihood of local people, agricultural production, and has resulted in loss of highly valuable timber species and biodiversity. Without reducing the current rate of deforestation and forest degradation, Myanmar is likely to face climate-driven food and water shortages and the continued loss of its valuable forests and biodiversity. In Myanmar, only a handful of studies have been carried out to estimate carbon stocks in the natural forest [12] [13] . In addition, no studies have been done to estimate carbon stocks, emissions or emission reductions at project level in Myanmar despite high deforestation rates in recent years. Without such prior estimation it is difficult to initiate the REDD+ project in Myanmar. It is timely that Myanmar develops methods to assess not only the current carbon stocks but also emission baselines for various forest types at project, subnational or national levels in Myanmar. This study aims to estimate carbon stocks, emission reductions and related revenues using raw data of forest inventory and carbon in various pools. The time frame for this study is the 30-year period for the deciduous forest in Popa Mountain Park in Myanmar (PMP). The results could inform a decision-making process leading towards guidance or a decision on reducing emissions from deforestation and forest degradation in Myanmar.
2. Materials and Methods
2.1. Study Area
This study was conducted in dry deciduous forests located in the protected areas, the Popa Mountain Park (PMP) in Myanmar (Figure 1). Total area of PMP is about 10,000 ha. Elevation ranges from about 300 m to 1500 m
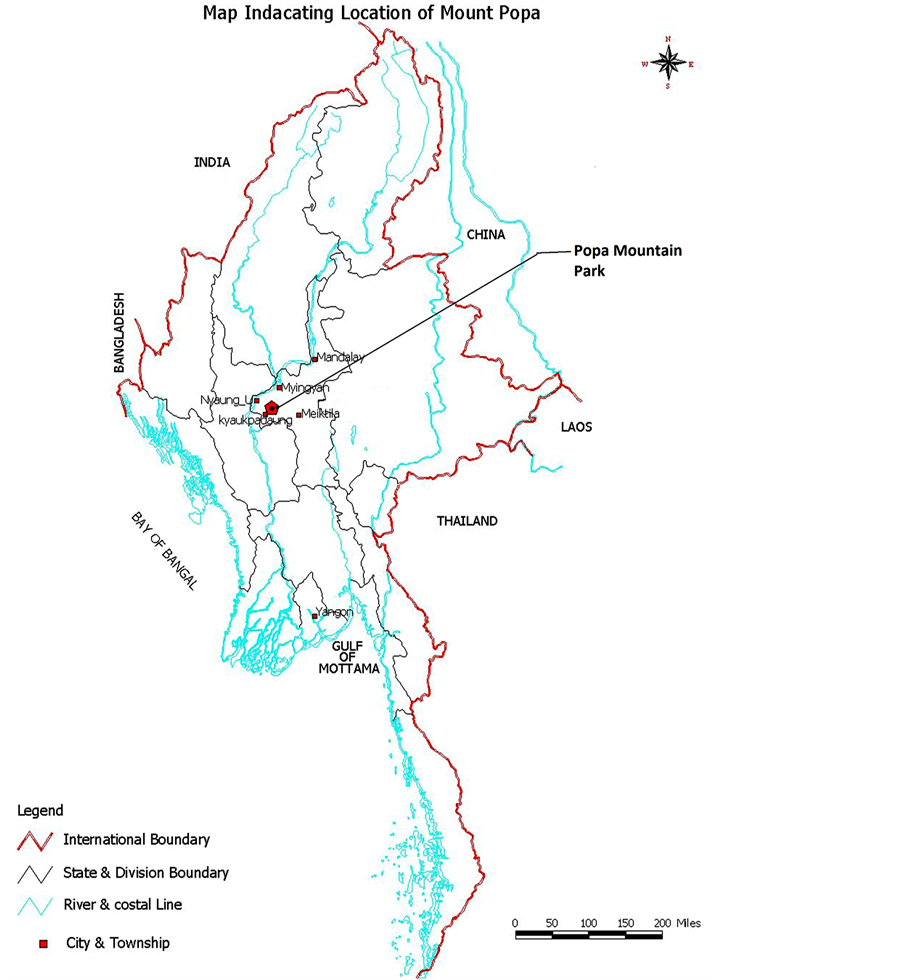
Figure 1.Location of Popa Mountain Park.
above sea level. Mean maximum and minimum monthly temperatures are 31.30˚C and 8.52˚C, respectively, and the mean annual rainfall is about 1170 mm (Popa Forest Department office, 2013, unpublished data). PMP is the only prominent volcano in Myanmar [14] and is famous for high plant diversity and as a source of medicinal plants. Various forest types were found in the area, namely dry hill or dry evergreen forest, dry mixed deciduous forest, dipterocarp forest or scrub indaing and dry forest or than-dahat [15] (Figure 2). Dry mixed deciduous forest (DMDF) is the largest area covering for about 40% of the total area of the park (4220 ha) [15] . In some areas, there are plantations of pine (Pinus insularis), eucalyptus (Eucalyptus camadulensis) and xylia (Xylia xylocarpa). The forests of PMP are second or third regrowth after cutting and clearing for agriculture in the early 20th century [14] . The Popa reserve was proposed as a protected area by the Natural Conservation National Park Project (NCNPP) conducted between 1981 and 1984 and subsequently, PMP was declared in 1989. There are 45 villages of about 50,900 people (in 2005) living on the plains surrounding the
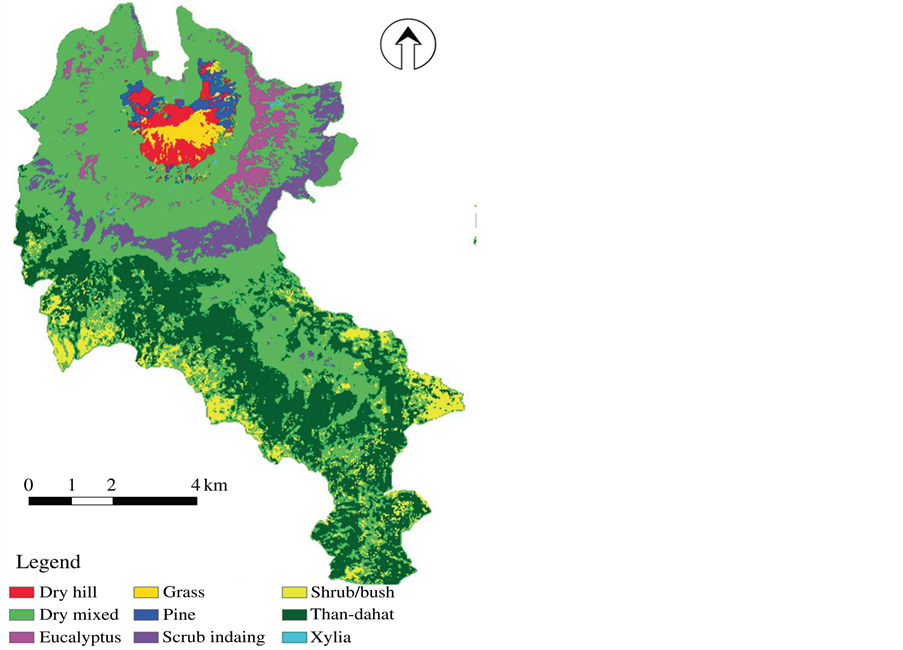
Figure 2.Land cover status map of Popa Mountatin Park.
park and agriculture is the most common source of subsistence for local livelihoods [16] . Villagers collect firewood, forest products and non-timber forest products from the park [17] . Total forest cover was 94.5% in 1989 but decreased to about 89.7% in 2000, and to 88.7% in 2005 [18] .
2.2. Estimation of Carbon Stocks
Although five carbon pools (aboveground, belowground, deadwood, litter, soil) need to be reported according to IPCC guidelines [19] , carbon in soil is not accounted for because soil carbon slowly changes depending on what followed after deforestation. And carbon stored in the aboveground biomass is the most directly impacted by deforestation [20] . Data from 25 sample plots of 400 m2 (20 m × 20 m) each were collected in Dry Mixed Deciduous Forest [21] in Popa Mountain Park. Diameter at breast height (DBH) and height of all trees (DBH ≥ 5 cm) were measured in each plot. Above ground carbon (AGC) (tonne C∙ha−1 or tC hereafter) was estimated using the equation below [22] .
 (1)
(1)
where VOB (m3∙ha−1) is stand volume over bark. WD (Mg∙m−3) is wood density. WD for all tree species were taken from [23] and [24] , using genus level averages where species specific data were not available following Chave et al. [25] and Bryan et al. [26] , and plot level averages for the cases where species could not identified following [27] . Carbon content default value (CC) 0.47 was used [19] . BEF is the biomass expansion factor, determined from [22] .
 (2)
(2)
where BV is the biomass of inventoried volume in ton∙ha−1, calculated as the product of stand VOB (m3∙ha−1) and wood density, WD (WD = 0.57 Mg∙m−3) for tropical forests [22] . The allometric equation developed by Carin et al. [28] , was used to calculate belowground carbon (BGC),
 (3)
(3)
where AGB = aboveground biomass in ton.
For estimation of litter carbon, 4 subplots having a size of 30 cm × 30 cm [21] were randomly established in each plot. Samples of about 200 to 300 g in weight were collected and oven-dried at 80˚C [29] . The biomass was calculated by the ratio of dry and fresh weight of the sample [19] . Deadwood measurements followed Coomes, et al. [30] . Dead wood (dbh > 10 cm) were measured in the 25 square plots (20 m × 20 m) and classified decay stages according to decomposition class by following [30] : 1) Stage I, bark largely intact; 2) Stage II, bark and twig lost, but shape of trunk remaining intact; and 3) Stage III, shape no longer maintained, and trunk sinking into the ground. The C-stock of standing dead trees and coarse wood debris (CWD) was estimated by multiplying the log volume by the dead-wood density (fresh-wood density × decay stage modifier) according to [30] . As it was difficult to identify these logs to species, a mean fresh-wood density (490 kg/m3) and decay stage modifiers: Stage I, 0.82; Stage II, 0.66; Stage III, 0.47 were used [30] . The biomass of all CWD (CWD-B) in the plot was derived using Equation (4) and carbon content of each CWD was calculated as 47% of dry weight (biomass).
 (4)
(4)
where LV is log volume of dead tree (m3), FWD is fresh-wood density (kg∙m−3), DSM is decay-stage modifier (DSM is defined as a dead-wood density as a proportion of fresh-wood density). The volume of each log (LV) was calculated as:
 (5)
(5)
where l is the length of the log, a and b are orthogonal diameters at one end, and c and d at the other.
2.3. Estimation of Carbon Revenues
To estimate carbon revenues from reducing deforestation and forest degradation, we need to understand baseline deforestation and project deforestation (the latter is deforestation when carbon project is implemented) and respective carbon emissions.
2.3.1. Baseline Deforestation
Baseline deforestation was determined using data analyzed by Htun et al. [18] who based their study on remote sensing data in 1989, 2000 and 2005. To provide a range of possible deforestation, three rates of deforestation were used to predict future deforestation, namely low, average, and high rates. Baseline Deforestation (BD) was derived from the forest cover change between Time 2 and Time 1. Forest cover of each forest type in Time t was estimated by
 (6)
(6)
where, FA(t) is the area of forest at time t(ha), k is the rate of deforestation.
 (7)
(7)
where BD(t) is Baseline deforestation of the forest at a year t (deforestation between time t2 and time t1). Htun et al. [18] found that the deforestation rate in PMP (park area and surrounding area, 3 km) is 0.09% to 4.42% based on remote sensing analysis on Landsat image in 1989, 2000 and 2005 [18] . Therefore, 0.09%, 2.25%, and 4.42% were respectively used as low, mean, and high deforestation rates in our analysis.
2.3.2. Project Deforestation
This is the deforestation when forest carbon project is implemented. There are various methods to predict forest cover change once project is implemented. For simplicity, we followed methods developed by Ty et al. [9] to predict the change of forest covers in the PMP,
 (8)
(8)
where, PD(t) is Project deforestation at year t (ha∙yr−1), RPI (t) is the relative impact of all project activities on deforestation at Time t in (%). RPI depends on activities undertaken to reduce the drivers of deforestation and degradation.
Htun et al. [18] identified the deforestation rates by analyzing increments of non-forest areas; individual tree, shrub land, grassland, regeneration, non-vegetative area, agriculture, water bodies and villages. He found that the deforestation rate in PMP is 0.9% to 4.42% (in the Park and the surrounding 3 km). Htun et al. [16] also stated that fuelwood and forest products are illegally collected for income and for producing sugar from palm sap, a major source of income for some people living in the western side of PMP. Likewise, it was personally observed that most of the households harvest wood for fuel in the summer season (March-May) in order to keep for the whole year. Mass extractions of wood for fuel, household and farm materials followed by annual fires lead to deforestation within a few years. Accordingly, we would conclude that the drivers of deforestation and forest degradation in PMP were conversion of agriculture land, conversion to settlement, annual fire, illegal logging, fuelwood collection, extraction of wood for household consumption and use as farm material. Similarly, Ty et al. [9] identified drivers of deforestation and forest degradation in a northern province of Cambodia as conversion to cropland, conversion to settlements and migrant encroachment, forest fire due to land clearing, hunter inducing forest fire, illegal logging for commercial sale and timber harvesting for local use. Therefore, the project activities proposed by Ty et al. [9] could also be introduced to PMP. These project activities include strengthening land-tenure, land-use plans, forest protection, assisted natural regeneration and establish fuelwood plantation, introduction of fuel-efficient stoves, introduction of mosquito nets, agricultural intensification, water resource development projects or maintenance of watershed area, non-wood forest product (NTFP) development and fire prevention. For simplicity, RPI estimated by Ty et al. [9] was also used in our study. It is suggested that this RPI should be revised when more data become available.
2.3.3. Baseline and Project Carbon Emissions
Carbon emissions due to deforestation can be therefore estimated by
 (9)
(9)
 (10)
(10)
where CEbaseline(t) is Baseline emissions or emissions without REDD+ project (tCO2∙yr−1), CEproject(t) is carbon emissions under the project (tCO2∙yr−1), CS is carbon stocks (tC∙ha−1) and 44/12 is the ratio of the molecular weight of CO2 (44) to the molecular weight of carbon (12).
Reduced emissions (tCO2∙yr−1) when REDD+ project is implemented were estimated by [31].
 (11)
(11)
2.3.4. Carbon Credits and Revenues
Carbon credits and carbon revenues at Year t were estimated by
 (12)
(12)
 (13)
(13)
where, CC(t) is Carbon Credits at time t (tCO2∙yr−1), lk is the leakage of carbon emissions outside the project boundary (tCO2∙year−1). Leakage is difficult to estimate, and Murray et al., [32] found that it varies greatly from one location to another. In this study, we assumed 30% leakage (lk = 0.30) following [9] .
CR(t) is carbon revenues at time t (US $ yr−1). The price of US $5 per tCO2 was used because it similar to the current price for forestry offsets in the voluntary market [33] [34] . Price of US $5.00 per tCO2 was used in the bilateral REDD+ agreement between the governments of Guyana and Norway [35] and in the Brazilian Amazon fund [36] .
3. Results and Discussions
3.1. Species Composition in the Study Area
Based on data from 25 sample plots, 74 species belonging to 33 families were recorded in the study area. The mean tree height was 13.8 ± 1.2 m, mean DBH was 17.5 ± 1.8 cm and mean volume was 214.7 m3∙ha−1. Mean stand density was 1061 trees ha−1 and the largest numbers of trees are found in the lower diameter class showing the inverse j-shape pattern (Figure 3). The abundance of lower DBH trees suggested that the study areas have good regeneration. Few trees were found in the large DBH class suggesting that large trees had already been harvested prior to our data collection. Shorea obtuse was the most frequently occurring species and most important species with Important Values Index (IVI) of 8.6% and Relative Density (RD) of 9.71% (Table 1). The second and third important species are Croton roxburghianus (7.3% IVI, 9.4% RD) and Pittosporunnapaulensis (4.8% IVI, 7.2% RD). Therefore, Shorea obtusa is an ecologically important species in the study area. Shorea obtuse also occupied highest basal area (3.8 m2∙ha−1) and volume (29.5 m3∙ha−1) in dry mixed deciduous forest. Hence, carbon storage in Shorea obtuse was the highest (22.8 tCha−1) followed by Terminaliacrenulata (9.7 tCha−1) and Dipterocarpustuberculatus (9.5 tCha−1) (Table 1).
3.2. Carbon Stocks in the Study Area
Total average carbon stocks in the dry mixed deciduous forest were estimated at 180 tC∙ha−1 (aboveground carbon, belowground carbon, deadwood, litters) (Table 2). Our findings of aboveground carbon is in the range of that found in dry dipterocarp forests in Vietnam [37], dipterocarp forests in the Philippines [38] , and some major forest types in India [39] but higher than that in mixed deciduous forests in Thailand [40] (Table 3). This is because stand density of mixed deciduous forests in Thailand are lower than this study. The accumulation of carbon may be related to stand density [22] , wood density [29] and growth pattern of fast and slow growing species. Aboveground carbon found in this study is however lower than deciduous forest in Alaungdaw Kathapa National Park, Myanmar, the natural forests and secondary natural forest in Philippines, and terrestrial carbon storage in tropical forest ecosystems, and watershed areas in New Zealand [13] [30] [41] -[44] . This may be due to different soil type, climate, disturbance regime, succession status, topography and human impacts. And the aboveground carbon stock will be affected by the diameter class distribution throughout the forest [45] .
The carbon stock in the litter layer is higher than in the deciduous forest in Alaungdaw Kathapa National Park, Myanmar, Watershed Area in New Zealand and Natural secondary forest in China [13] [44] [46] . Deadwood carbon stock in this study was within the range of deadwood of the watershed area in New Zealand [44] and in line with South Island forests in New Zealand [30] and indigenous forest in New Zealand [47] . It is because stand age and disturbance history strongly affect the amount of coarse wood debrisin a forest [48] .
3.3. Forest Cover Change
This study used three rates of deforestation and used a retrospective approach (past trend) for projecting future deforestation between 2013 and 2043. Forest area decreased to 1127.3 ha, 2181.1 ha and 3033.9 ha in 2043 from 4095.3 ha, 3974.3 ha and 3742.8 ha in 2013 (forest cover was 4220 ha in 2010 [15] ), losing 1091.6 ha, 1836.3 ha and 2659.7 ha for Low Deforestation Rate (LDR), Average Deforestation Rate (ADR) and High Deforestation Rate (HDR), respectively (Figure 4). Over a 30-year period, the dry deciduous forest in Popa Mountain Park lost about 61.2 ha (36.4 ha for low rate, 88.7 ha for high rate) annually. This deforestation was considered baseline deforestation, upon which baseline emissions or reference emission level were calculated (Figure 5).
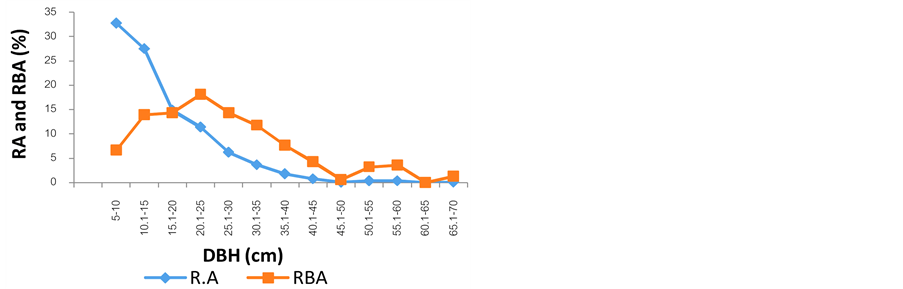
Figure 3. Relative abundance and relative basal area of DMDF according to DBH class.

Table 1.The Stand Density (SD), Basal Area (BA), Volume (V) and Carbon storage (C) of DMDF in PMP.
*RD = Relative Density; CS = Carbon Stocks (aboveground + belowground).
Table 2. Average carbon stocks in respective pools.
Table 3. Comparison of carbon stocks to previous studies.
3.4. Deforestation during the Project Implementation
The REDD+ project is designed to reduce or stop deforestation and forest degradation. As described earlier, various management interventions [9] were introduced in order to reduce drivers of deforestation and forest degradation. Each intervention affects drivers and thus results in reducing deforestation and forest degradation. Total deforestation over this 30-year project timeframe is estimated at 303.7 ha, 529.3 ha and 826.8 ha for LDR,
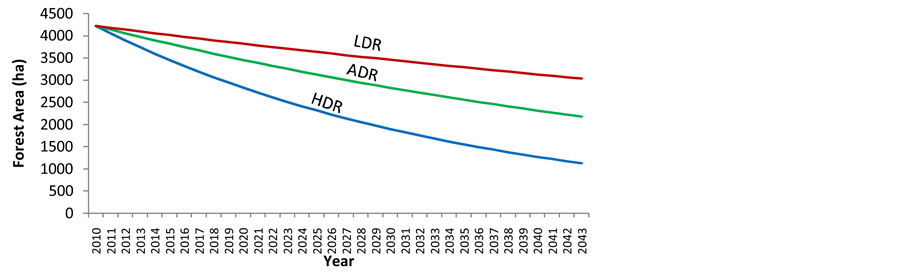
Figure 4. Forest area change without REDD project.
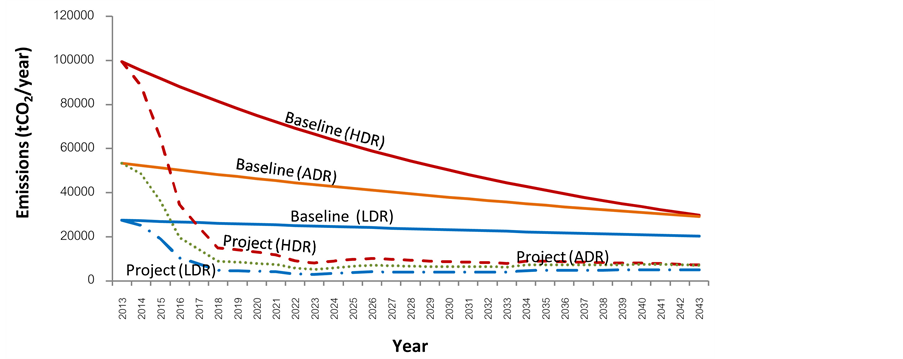
Figure 5. Annual emissions under baseline deforestation and project deforestation. Note: Baseline deforestation is deforestation that occurs in the absence of project while project deforestation is deforestation that occurs when REDD projects is implemented.
ADR and HDR, respectively. About 10.1 ha, 17.6 ha and 27.6 ha were loss annually for LDR, ADR, and HDR, respectively.
3.5. Carbon Emission Reduction, Credits, and Revenues
If the REDD+ project is implemented to reduce deforestation of the dry deciduous forest located in the Popa Mountain Park protected area, 104023.8 tCO2, 172564.8 tCO2 and 241991.0 tCO2 of carbon emissions could be reduced for a 30-year project cycle under the LDR, ADR, HDR, respectively. On an annual basis, a 30-year project could result in reducing 3467.5 tCO2, 5752.2 tCO2 and 8066.4 tCO2 annually, respectively for the three deforestation rates (Figure 6).
The project leads to accumulated carbon credits of about 69828.2 tCO2, 115573.1 tCO2 and 169393.7 tCO2 under LDR, ADR and HDR, respectively. With carbon priced at US $5, the project will result in total carbon revenues US $349503.3, US $577192.4 and US $846968.6 with the respective deforestation rate (Table 4). With carbon priced at US $5, the project could generate carbon revenues of US $349503.3 to US $846968.6 depending on used rates of deforestation. Therefore, reducing carbon emissions from deforestation could potentially provide additional incentives and it is considered a cost-effective option for climate policy [49].
Study findings suggest that reducing deforestation of the dry mixed deciduous forest in Popa Mountain Park could result in huge emission reductions. Carbon revenues from reducing deforestation could bring funds for forest conservation and livelihood improvement. However, carbon revenues in this study are affected by the carbon price and therefore future adjustment of the price would be necessary.
The design of the REDD framework could have a substantial effect on various costs. Costs are directly associated with projects activities to reduce deforestation. The implementation costs include institution and capacity
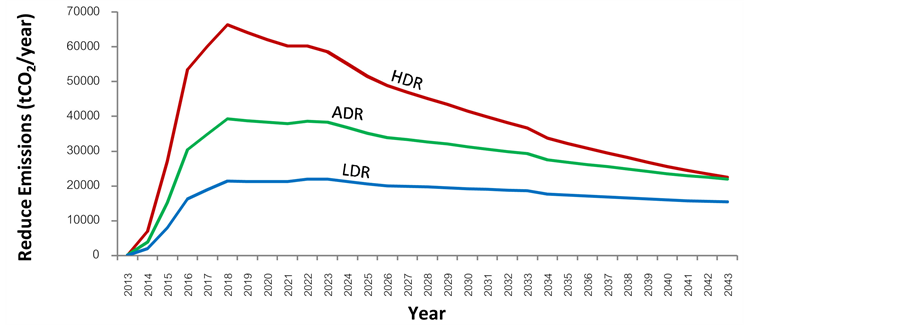
Figure 6. Reduce emissions (avoided emissions) due to REDD project.
Table 4.Carbon credits and carbon revenues from REDD project by deforestation rates.
building activities that are necessary to make the REDD+ program happen. Likewise, the expenses associated with the goods, training, research and political, legal and regulatory process, including consultation and government decision-making processes are needed to be accounted for. Benefit sharing is one of the important issues that need to be addressed in REDD+. There are a variety of issues regarding the impact of REDD+ on the rights of indigenous and other communities living in the forest [50] . The distribution of tenure rights over carbon and access to forests is critical for benefit sharing, and both are likely to be crucial to the ability of local populations to gain benefits from the increased value of carbon [51] . Therefore, further research on the cost and benefits sharing of REDD+ inspired projects are recommended.
3.6. Uncertainty of Baseline and Project Emissions Estimates
Estimation of emission reductions is strongly affected by the assumptions of baseline and effectiveness of project impacts on drivers of deforestation and forest degradation. Trend of forest cover change is important for defining baseline deforestation, against which project deforestation is compared. Two approaches to defining baseline were discussed, namely retrospective and prospective approaches. The former is based on the past trend over a period of time (about 5 - 10 years) to calculate the rate of change in forest cover and make projection linearly or exponentially. In the case of linear projection, two options could be possible, i.e. projection downward or taking average rate of deforestation between at least two points in time and make projection to the future horizontally. Projection downward is not realistic because such projection allows deforestation to continue even if there is no more forest left. Horizontal projection could be acceptable but the rate of change should be revised every 5 to 10 years depending on the actual situation in the location or country in question. In fact, discussions on shifting the baseline once every 10 years have been recently discussed [52] . The problem is that it would be difficult to estimate an acceptable baseline while a REDD+ project is being implemented and verified. In this study, we used exponential projection for the baseline because this approach takes into account the availability of remaining forests. In practice, as forest cover declines, the rate of deforestation relative to forest cover also declines, and deforestation cannot occur when forests are completely cleared.
The latter (prospective baseline) is dependent on national circumstances of individual countries, where rapid economic development was evident after these countries emerged from political instability and isolated economic development. Countries like Myanmar, Cambodia or Laos could adopt this prospective baseline provided that they could provide evidence of past economic growth and governmental reforms. Although we acknowledge that a prospective baseline is important for estimating carbon emissions, estimation of and using this baseline are beyond the scope of this study.
Effectiveness of project activities on drivers of deforestation and forest degradation strongly affects emission reductions and thus carbon revenues. As experience is gained, each driver requires multiple activities while some drivers are not possible to reduce. It is important to understand the scales of drivers before appropriate activities could be introduced. For instance, clearing forest for industrial plantations is global because of the continuous global demands, while illegal logging can occur on a regional scale because of regional (cross-border) demand for timber. Both drivers are difficult to reduce because they require global and regional cooperation. In contrast, such drivers as land speculation and clearing of land by opportunists or land migrants (moving from one province to another) could occur at subnational scale, and they could be somehow reduced through law enforcement. Drivers such as fuelwood consumption, forest fires, clearing forests for small plantations for local needs could occur at local scale, which could be reduced by introducing alternatives for using less wood for fuel (i.e. by introducing efficient cookstoves or providing affordable rural energy, building local infrastructures such as pagoda, school, community clinic, and/or providing environmental education). Worse yet, political conflicts such as war between various factions or countries could also lead to destruction of forests, and yet this kind of drivers cannot be reduced. Therefore, it is not simple to provide accurate estimates of the relative project impact. Relative project impact should be used with great caution until alternative methods are introduced. For simplicity, some carbon project developers assumed a 20% reduction of deforestation in relation to baseline deforestation until around 80% of deforestation is halted [53] . Thereafter, further deforestation could not be reduced unless plantations (enrichment plantings, reforestation or afforestation) are carried out on deforested lands [54] .
4. Conclusion
This study was designed to estimate carbon stocks, carbon emission and reductions and related carbon revenues in the event that REDD+ projects are implemented in the dry mixed deciduous forest in PMP. Forest cover change between 1989 and 2005 was used as past trend of deforestation upon which deforestation rates in PMP were determined. Forest inventory data from 25 sample plots were used to assess tree biodiversity and to estimate carbon stocks in the park. Altogether, 74 tree species were found and Shorea obtuse tree species was dominant and ecologically important. On average, total carbon stocks (aboveground, belowground, litter, deadwood) were 180 tC∙ha−1. Our study suggests that a REDD+ project is likely to reduce carbon emissions 104023.8 - 241991.0 tCO2 over a 30-year project cycle or about 3467 - 8066 tCO2. Using carbon price of US $5 per tCO2, a 30-year project would create carbon revenues of about US $349503.3 to US $846968.6. Our results highlight the contribution of REDD+ project to reducing deforestation and forest degradation, carbon emissions, and generating carbon revenues. Other sources of revenues from each proposed activity to reduce drivers could also be achieved. Appropriate policy inventions are important for reducing the drivers and therefore they could result in huge carbon emission reductions. Further study on identification of drivers of deforestation and forest degradation, and defining future projection of baseline and project line is recommended. Our study provides an important step for estimating carbon emissions and reductions due to deforestation and forest degradation in Myanmar. Where benefits of emission reductions are considered, a decision making based on better-informed information on emission reductions and carbon revenues as done in our study would be useful for the adoption of sound forest conservation and management that could achieve multiple benefits.
Acknowledgements
This study was partially supported by a Grant-in-Aid for Scientific Research (No. 18402003) from the Ministry of Education, Culture, Sports, Science and Technology of Japan. We thank the Forest Department of Myanmar for providing assistance and for allowing us to use the research facilities during the data collection in Myanmar. My graduate study was partially sponsored by Naresuan University, Thailand.
References
- Sasaki, N. (2006) Carbon Emissions Due to Land-Use Change and Logging in Cambodia: A Modeling Approach. Journal of Forest Research, 11, 397-403. http://dx.doi.org/10.1007/s10310-006-0228-5
- Sathaya, J.A. and Anger, N. (2008) Reducing Deforestation and Trading Emissions: Economic Implications for the Post-Kyoto Carbon Market. ZEW Discussion Papers, No. 08-016. Centre of European Economic Research (ZEW), Manhein.
- Brown, S., Sathaye, J., Cannell, M. and Kauppi, P.E. (1996) Mitigation of Carbon Emissions to the Atmosphere by Forest Management. Commonwealth Forest Review, 75, 80-91.
- Food and Agriculture Organization of the United Nations (FAO) (2010) Global Forest Resources Assessment. Main Report. FAO Forest Paper163. FAO, Rome.
- The United Nation Collaborative Programe on Reducing Emissions from Deforestation and Forest Degradation in Developing Countries (UN-REDD) (2008) UN Collaborative Programme on Reducing Emissions from Deforestation and Forest Degradation in Developing Countries (UN-REDD), Framework Document, Geneva.
- Pelletier, J., Kirby, K.R. and Potvin, C. (2012) Significance of Carbon Stock Uncertainties on Emission Reductions from Deforestation and Forest Degradation in Developing Countries. Forest Policy and Economics, 24, 3-11. http://dx.doi.org/10.1016/j.forpol.2010.05.005
- Intergovernmental Panel on Climate Change (IPCC) (2007) Summary for Policymakers. In: Metz, B., Davidson, O.R., Bosch, P.R., Dave, R. and Meyer, L.A., Eds., Climate Change 2007; Mitigation Contribution of Working Group III to the Fourth Assessment Report of the Intergovernmental Panel on Climate Change, Cambridge University Press, Cambridge, United Kingdom and New York, NY, USA.
- Stern, N. (2007) The Economics of Climate Change; The Stern Review. Cambridge University Press, Cambridge.
- Ty, S., Sasaki, N., Ahmad, A.H. and Ahmad, Z.A. (2011) REDD Development in Cambodia-Potential Carbon Emission Reductions in a REDD Project. FORMAT, 10, 1-23.
- United Nations Framework Convension on Climate Change (UNFCCC) (2009) Draft decision 4/CP. 15. Methodological Guidance for Activities Relating to Reducing Emissions from Deforestation and Forest Degradation and the Role of Conservation, Sustainable Management of Forests and Enhancement of Forest Carbon Stocks in Developing Countries. New York City.
- Boscolo, M., Kerr, S., Pfaff, A. and Sanchez, A. (1999) What Role for Tropical Forests in Climate Change Mitigation? The Case of Costa Rica. In Issue 675 of Development Discussion Paper, Central America Project Series, Harvard Institute for International Development, Harvard University.
- Myo, M.T. (2008) Carbon Storage Capacity in Teak Plantation and Degraded Forest Potential for AC-CDM Projects. (A Case Study in Yedashe Township, in the Eastern Part of the Bago Yoma.) University of Forestry, Myanmar.
- Oo, T.N. (2009) Carbon Sequestration of Tropical Deciduous Forests and Forest Plantations in Myanmar. (A Dissertation for the Degree of Doctor of Philosophy.) Seoul National University, Seoul.
- FD (Forest Department) (1981) Proposed Popa Mountain Park Master Plan 1982-84, Prepared by UNDP/FAO. Nature Conservation National Park Project, Vol. 43, Forest Department, Rangoon.
- Htun, N.Z., Mizoue, N. and Yoshida, S. (2011) Classifying Tropical Deciduous Vegetation?: A Comparison of Multiple Approaches in Popa Mountain Park, Myanmar. International Journal of Remote Sensing, 32, 8935-8948. http://dx.doi.org/10.1080/01431161.2010.531779�
- Htun, N.Z., Mizoue, N. and Yoshida, S. (2013) Changes in Determinants of Deforestation and Forest Degradation in Popa Mountain Park, Central Myanmar. Environmental Management, 51, 423-434. http://dx.doi.org/10.1007/s00267-012-9968-5
- Rao, M., Rabinowitz, A. and Khaing, S.T. (2002) Status Review of the Protected-Area System in Myanmar, with Recommendations for Conservation Planning. Conservation Biology, 16, 360-368. http://dx.doi.org/10.1046/j.1523-1739.2002.00219.x
- Htun, N.Z., Mizoue, N., Kajisa, T. and Yoshida, S. (2010) Deforestation and Forest Degradation as Measures of Popa Mountain Park (Myanmar) Effectiveness. Environmental Conservation, 36, 218-224. http://dx.doi.org/10.1017/S0376892909990415
- Intergovernmental Panel on Climate Change (IPCC) (2006) Guidelines for National Greenhouse Gas Inventory: Agriculture, Forestry and Other Landuse. Vol 4, IPCC (Intergovernmental Panel on Climate Change).
- Gibbs, H.K., Brown, S., Niles, J.O. and Foley, J.A. (2012) Monitoring and Estimating Tropical Forest Carbon Stocks: Making REDD a Reality. Environmental Research Letters, 2, Article ID: 045023.
- Korea Forest Service (2007) Survey Manual for Biomass and Soil Carbon. The Republic of Korea: ASEAN-Korea Corporation Program, Seoul.
- Brown, S. (1997) Estimating Biomass and Biomass Change of Tropical Forests: A Primer. FAO Forestry Paper-134, Rome.
- Zanne, A.E., Lopez-Gonzalez, G., Coomes, D.A., Ilic, J., Steven, J., Lewis, S.L., Miller, R.B., Swenson, N.G., Wiemann, M.C. and Chave, J. (2009) Global Wood Density Database. Identifier.
- ICRAF (2010) World Agroforestry Wood Density Database.
- Chave, J., Muller-Landau, H.C., Baker, T.R., Easdale, T.A., Steege, H. and Webb, C.O. (2006) Regional and Phylogenetic Variation of Wood Density across 2456 Neotropical Tree Species. Ecological Applications, 16, 2356-2367. http://dx.doi.org/10.1890/1051-0761(2006)016[2356:RAPVOW]2.0.CO;2
- Bryan, J., Shearman, P., Ash, J. and Kirkpatrick, J.B. (2010) Estimating Rainforest Biomass Stocks and Carbon Loss from Deforestation and Degradation in Papua New Guinea 1972-2002: Best Estimates, Uncertainties and Research Needs. Journal of Environmental Management, 91, 995-1001. http://dx.doi.org/10.1016/j.jenvman.2009.12.006
- Mattsson, E., Persson, U.M., Ostwald, M. and Nissanka, S.P. (2012) REDD+ Readiness Implications for Sri Lanka in Terms of Reducing Deforestation. Journal of Environmental Management, 100, 29-40. http://dx.doi.org/10.1016/j.jenvman.2012.01.018
- Cairns, M.A., Brown, S., Helmer, E.H. and Baumgardner, G.A. (1997) Root Biomass Allocation in the World’s Upland Forests. Oecologia, 111, 1-11. http://dx.doi.org/10.1007/s004420050201
- Kenzo, T., Furutani, R., Hattori, D., Kendawang, J.J., Tanaka, S., Sakurai, K. and Ninomiya, I. (2009) Allometric Equations for Accurate Estimation of Above-Ground Biomass in Logged-Over Tropical Rainforests in Sarawak, Malaysia. Journal of Forest Research, 14, 365-372. http://dx.doi.org/10.1007/s10310-009-0149-1
- Coomes, D., Allen, R.B., Scott, N., Goulding, C. and Beets, P. (2002) Designing Systems to Monitor Carbon Stocks in Forests and Shrublands.Forest Ecology and Management, 164, 89-108. http://dx.doi.org/10.1016/S0378-1127(01)00592-8
- Sasaki, N. and Yoshimoto, A. (2010) Benefits of Tropical Forest Management under the New Climate Change Agreement—A Case Study in Cambodia. Environmental Science & Policy, 13, 384-392. http://dx.doi.org/10.1016/j.envsci.2010.04.007
- Murray, B., McCarl, B. and Lee, H. (2002) Estimating Leakage from Forest Carbon Sequestration Programs. Working Paper 02-06 May 2002. RTI International.
- David, D., Hamilton, K. and Johnson, E. (2011) State of the Forest Carbon Markets 2011. From Canopy to Currency.
- Busch, J., Strassburg, B., Cattaneo, A., Lubowski, R., Bruner, A., Rice, R., Creed, A., Ashton, R. and Boltz, F. (2009) Comparing Climate and Cost Impacts of Reference Levels for Reducing Emissions from Deforestation. Environmental Research Letters, 4, Article ID: 044006.
- Guyana and Norway (2009) Memorandum of Understanding between the Government of the Cooperative Republic of Guyana and the Government of the Kingdom of Norway Regarding Cooperation on Issues Related to the Fight against Climate Change, the Protection of Biodiversity and the Enhanc.
- Ministerio do MeioAmbiente (MMA) (2008) Project Document—Amazon Fund. Ministerio do MeioAmbiente, Brasilia.
- Con, T.V., Thang, N.T., Ha, D.T.T., Khiem, C.C., Quy, T.H., Lam, V.T., Van, D.T. and Sato, T. (2013) Relationship between Aboveground Biomass and Measures of Structure and Species Diversity in Tropical Forests of Vietnam. Forest Ecology and Management, 310, 213-218. http://dx.doi.org/10.1016/j.foreco.2013.08.034
- Lasco, R.D. and Pulhin, F.B. (2009) Carbon Budgets of Forest Ecosystems in the Philippines. Journal of Environmental Science and Management, 12, 1-13.
- Sharma, C.M., Baduni, N.P., Gairola, S., Ghildiyal, S.K. and Suyal, S. (2010) Tree Diversity and Carbon Stocks of Some Major Forest Types of Garhwal Himalaya, India. Forest Ecology and Management, 260, 2170-2179. http://dx.doi.org/10.1016/j.foreco.2010.09.014
- Petsri, S. and Pumijumnong, N. (2007) Aboveground Carbon Content in Mixed Deciduous Forest and Teak Plantations. Environment and Natural Resources Journal, 5, 1-10.
- Lasco, R.D., Pulhin, F.B., Sanchez, P.A.J., Villamor, G.B. and Villegas, K.A.L. (2008) Climate Change and Forest Ecosystems in the Philippines: Vulnerability, Adaptation and Mitigation. Journal of Environmental Science and Management, 11, 1-14.
- Woo, S.Y., Han, S.H. and Lee, D.K. (2010) Carbon Storage and Flux in Aboveground Vegetation and Soil of Sixty-Year Old Secondary Natural Forest and Large Leafed Mahogany (Swieteniamacrophylla King) Plantation in Mt. Makiling, Phillippines. Asia Life Sciences, 19, 357-372.
- Lal, R. (2005) Forest Soils and Carbon Sequestration. Forest Ecology and Management, 220, 242-258. http://dx.doi.org/10.1016/j.foreco.2005.08.015
- Staley, C.E. (2010) Modelling of Above-Ground and Below-Ground Carbon in a New Zealand Native Forest at a Watershed Scale (Lincoln University, Lincoln).
- Terakunpisut, J., Gajaseni, N. and Ruankawe, N. (2007) Carbon Sequestration Potential in Aboveground Biomass of Thong Pha Phum National Forest. Applied Ecology and Environmental Research, 5, 93-102.
- Zheng, H., Ouyang, Z., Xu, W., Wang, X., Miao, H., Li, X. and Tian Y. (2007) Variation of Carbon Storage by Different Reforestation Types in the Hilly Red Soil Region of Southern China. Forest Ecology and Management, 255, 1113-1121. http://dx.doi.org/10.1016/j.foreco.2007.10.015
- Richardson, S.J., Peltzer, D., Hurst, J.M., Allen, R.B., Bellingham, P.J., Carswell, F.E., Clinton, P.W., Griffiths, A.D., Wiser, S.K. and Wright, E.F. (2009) Deadwood in New Zealand’s Indigenous Forests. Forest Ecology and Management, 258, 2456-2466. http://dx.doi.org/10.1016/j.foreco.2009.08.022
- Harmo, M.E., Franklin, J.F., Swanson, F.J., Sollins, P., Gregory, S.V., Lattin, J.D., Anderson, N.H., Cline, S.P., Aumen, N.G., Sedell, J.R., Lienkaemper, G.W., Cromack, K. and Cummins, K.W. (1986) Ecology of Course Woody Debris in Temperate Ecosystems. Advances in Ecological Research, 15, 1-170.
- Kinderman, G.E., Obersteiner, M., Rametsteiner, E. and McCallum, I. (2006) Predicting the Deforestation-Trend under Different Carbon-Prices. Carbon Balance and Management, 1, 15. http://dx.doi.org/10.1186/1750-0680-1-15
- Larson, A.M. (2011) Forest Tenure Reform in the Age of Climate Change: Lessons for REDD+. Global Environmental Change, 21, 540-549. http://dx.doi.org/10.1016/j.gloenvcha.2010.11.008
- Agrawal, A., Nepstad, D. and Chhatre, A. (2011) Reducing Emissions from Deforestation and Forest Degradation. Annual Review of Environment and Resources, 36, 373-396. http://dx.doi.org/10.1146/annurev-environ-042009-094508
- VCS (2013) REDD Methodological Module: Estimation of Baseline Carbon Stock Changes and Greenhouse Gas Emissions from Unplanned Deforestation (BL-UP). Version 3.2, Sectoral Scope, 14, 1-47.
- Poffenberger, M., DeGryze, S. and Durschinger, L. (2009) Designing Collaborative REDD Projects: A Case Study from Oddar Meanchey Province, Cambodia.
- Chakravarty, S., Ghosh, S.K., Suresh, C.P., Dey, A. and Shukla, G. (2012) Deforestation?: Causes, Effects and Control Strategies, Global Perspectives on Sustainable Forest Mangement. Okia, C.A., Ed.�
NOTES

*Corresponding author.