International Journal of Geosciences
Vol.08 No.03(2017), Article ID:75162,17 pages
10.4236/ijg.2017.83017
Applying ArcGIS to Estimate the Rates of Shoreline and Back-Shore Area Changes along the Nile Delta Coast, Egypt
Essam A. M. Deabes
Coastal Research Institute, Alexandria, Egypt

Copyright © 2017 by author and Scientific Research Publishing Inc.
This work is licensed under the Creative Commons Attribution International License (CC BY 4.0).
http://creativecommons.org/licenses/by/4.0/


Received: December 20, 2016; Accepted: March 28, 2017; Published: March 31, 2017
ABSTRACT
This study was undertaken to apply Geographic Information System “GIS” (ArcGIS 9.3) for calculating shoreline change rates and back-shore surface area due to these changes, particularly after constructing marine structures: including seawall, detached breakwaters and groins. Modelbuilder in ArcGIS software was used to design and develop an automated technique, module, for estimating such changes (rate and area). These changes are deduced from analysis of beach-nearshore profile surveys between 1970 and 2010 and shoreline position versus prevailing coastal processes. The results show that the major erosion occurred along the Delta promontories; the shoreline of Rosetta retreated ( 1.6 km ) at an average rate of 60 m/yr with loss of back-shore area 6.4 km2; the coastline of Burullus bulge recessed at mean rate of 6 m/yr and decreasing in beach area of 1.31 km2; and at Damietta (Ras El-Bar) the shoreline moved backward (6 m/yr) with disappeared in beach area of 1.13 km2. The shape and orientation of these promontories contributed to create alternation between wave convergence zone that eventually causes erosion, and divergence zones that experienced shoreline accretion. Finally, the engineering structures didn’t solve or stop the erosion problem but shifted it from one place to another.
Keywords:

1. Introduction
Sandy coasts are dynamic environments that can change over time and spatial variation because of a myriad of coastal processes. Coastline displacement due to erosion or deposition is a major concern for coastal zone management. Coastal erosion is caused by natural forces such as currents, waves, storm surges, and winds, as well as anthropogenic developments [1] [2] . Very dynamic coastlines, such as parts of the Nile Delta coast, pose considerable hazards to human use and development, particularly after building the High Dam in 1964 at Aswan, this Dam cut off the sediment supply to arrive the
Information on coastline change from season to decade constitutes an essential and vital input in any coastal management plan, so that areas of potential loss to erosion can be identified and appropriate land use planning adopted. Unfortunately, it is difficult to directly measure the area that is lost or gained for large sections of sandy beaches. However, shoreline change could be a useful way to estimate the change of beach zone because it can be collected quickly and relatively easily over long distances. Several investigators illustrated that shoreline changes can be used as good indicators for describing coastline erosion or accretion ( [1] [3] [4] [5] ). Many methods have been proposed to estimate coastline change. Among them are 1) the baseline approach [6] ; 2) the dynamic segmentation approach [7] [8] ; 3) the area-based approach [9] ; and 4) the buffering and nonlinear least squares estimation approach [1] . Approach of baseline is used in the present work. In this method, the baseline is selected on-shore at appropriate distance from shoreline and approximately parallel to the coastline, where the change in the shoreline position can be calculated by measuring the restricted distance between baseline and shoreline along the orthogonal transect lines.
Geographic information system emerged in the 1970s and has been used in the 2000s in studies of coastal evaluation [10] . Various sources of data on the position of the coastline (aerial photographs, satellite images, cross-shore profile survey, maps, etc.) are integrated to allow the creation, analysis, and mapping of data [11] [12] . Earlier studies focused on using historical maps to estimate the shoreline changes. Among these studies, [13] showed that the Dameitta promontory advanced about 3 km (30 m/yr) seaward over the period 100 years (1800- 1900). The surveys of the old Admiralty map 1919/1992, the research vessel Chain 1976/1977 and the recent bathymetry of 1986 illustrated that the shoreline has retreated with an average rate of about 50 m/yr ( [14] [15] [16] ). The erosion rate during the period from 1900 to 1964 was about 20 m/yr and then increased significantly during the period between 1964 and 1982 to be 125 and 170 m/yr for the east and west of Rosetta promontory respectively. These changes resulted from the effect of the construction of irrigation works; Aswan Low “or Old” Dam and the Aswan High Dam, which trapped all the sediments in its upstream side. As well as, with available of satellite images, this encouraged a number of investigators for using approach of remote sensing to detect the shoreline changes ( [17] [18] [19] [20] [21] [22] ).
A number of studies have focused on computing shoreline change rates along the Nile Delta coasts using comparison of beach profiles ( [23] [24] [25] [26] [27] [28] ). Although all of these previous studies, no attempts have been made to assess changes in the position of shoreline and compute surface area of back-shore zone. Therefore, the major objective of the present study is to develop model or module, a new methodology, using Modelbuilder in ArcGIS software for calculating the surface area of back-shore zone that is lost or gained according to shoreline change (retreat or advance). In addition, estimating the rate of shoreline change based on approach of the baseline for measuring the coastline retreat and advance along the Nile Delta coast using ArcGIS package. The manipulated data of beach-nearshore profile and shoreline positions are incorporated to interpolate, analyze, and apply the digital shoreline analysis system (DSAS), which is separate module in ArcGIS software and developed by the United States Geological Survey [29] .
2. Study Area
The Nile Delta coast is located in the southeastern part of Mediterranean, north of Egypt, this coast extends from Abu Quir headland in the west to
Since the beginning of the 20th century, dramatic erosion has occurred along some parts of the Nile Delta coast [30] . This erosion appeared due to the construction of various dams and water control works on the upper and lower Nile River [16] . Because of cutting off almost all water discharge and prevention of sediments from reaching the coast particularly after constructing the High Aswan Dam in 1964, so the coastal zone of the Nile Delta has suffered chronic erosion that caused damages on the national economy directly or indirectly. Where some of the coastal roads have been destroyed, it caused loss of buildings and valuable agriculture land. Also shoaling and siltation of the Nile estuaries and outlets of the northern lakes is now a grave problem as it hinders fishing activities and coastal navigation, besides harming the lake eco-system. Moreover, the coastal zone of the Nile Delta is presently undergoing extensive changes due to both natural and human influences [31] .
A series of marine engineering structures have been constructed along the coast of the Nile Delta, these structures have significantly affect the shoreline position of the Nile Delta. In the following section, the history of these structures is browsed. In 1982, two jetties were built on the inlet of Idku lake to prevent sedimentation problem in the navigation channel as shown in Figure 2(a). The western jetty has a length of 240 m, and the eastern jetty is 175 m long. To

Figure 1. General map of the Nile Delta coast showing the position of beach-nearshoreprofiles along the study area “labeled from P1 to 154” (modified after Frihy, et al., 2003), these profiles carried out by CoRI.
protect the Rosetta promontory, pair of seawall was constructed on the western and eastern sides of the Rosetta estuary of the Nile River (Figure 2(b)). Five groins were built on the eastern side of the Rosetta promontory in the last decade, further nine groins on the downdrift of the western seawall as shown in Figure 2(b). Along the coast of Burullus, seawall was constructed in 1947 to protect the

Figure 2. Layout showing position of marine structures along the coastline of the Nile Delta (including; jetties, groins, seawalls, revetments and detached breakwaters) and waterways (e.g., S1 “Idku outlet”, S2 “Rosetta estuary”, S3 “Burullus outlet”, S4 “entrance of Damietta harbor”, S5 “Damietta estuary” and S6 “entrance of Port Said”).
1981-1982 as shown in Figure 2(f), the western and eastern jetties have length of 1300 and 600 m , respectively. Further east at Ras El-Bar resort, the western jetty of the Damietta branch was constructed in 1941. To stop the erosion of the Ras El-Bar resort, three groins were erected in 1970 and the beach of resort was artificially nourished with sediment dredged from the river mouth, but the erosion phenomenon was continued, for this reason in 1982-1983 a revetment of basalt rock and dolose was placed on the east of western jetty at Damietta mouth. Further, a total of eight shore-parallel detached breakwaters have been constructed parallel to the beach of Ras El-Bar resort in order to protect this resort (Figure 2(f)). A seawall several kilometers in length was constructed in 1971 to protect the coastal road between Damietta and Port Said.
3. Material and Methods of Analysis
The analysis in the present study is based mainly on the survey data of beach- nearshore profile, which have been conducted by the Coastal Research Institute (CoRI) since 1971. The bathymetric map off the study area produced on the basis of measurements of the cross-shore profiles, which collected during the field work in 1971, 1981, 1991, 2001 and 2010, these profiles started from the boundary of the on-shore part of the beach (maximum height: 1 m) and ended at a distance of about 1 km (maximum depth: 6 m) off the shoreline. From bathymetric maps, five vector lines was extracted corresponding to the decadal shorelines position using ArcGIS software. These are also supported by additional seven shorelines position, vector lines, surveyed recently from 2004 to 2013. Totally, the analysis was performed on 12 sequential shorelines position (Figure 3). The principal source of used data in the present study is the Coastal Research Institute (CoRI), where a total of 65, 87, 152, 152 and 154 profiles were selected from the annual survey that carried out during the autumn period of 1971, 1981, 1991, 2001 and 2010, respectively, these profiles numbered from P1 to P154 as shown in Figure 1. Profiles are spaced between 50 and 5000 m apart. Before 2001, the inner portion of the profiles (from the surf zone, depth < 1.0 m to maximum height of 1 m on beach) was surveyed on foot during the land survey with a level and graduated staff. The nearshore profiles, from 1.0 to 7.0 m depth, was surveyed using a rubber boat equipped with engine to determine the distance from start point and graduate staff to measure water depth. Since 2002 the nearshore profile was surveyed using a rubber boat equipped with a computerized DGPS (GBX-PRO) to record the geographic coordinates using a DGPS and water depth via Echo sounder (Navisound 205). GPS data are georeferenced to the

Figure 3. Data created in ArcGIS 9.3 software. (a) feature classes and feature dataset created in ArcCatalog. (b) 12 shorelines, cross-shore transects (477 lines) and baseline created in ArcMap.
metric coordinate system (UTM). Consequently, the raw data of autumn survey recorded in 1971, 1981, 1991 and 2001 have been converted from old format, distance and depth, into geo-referenced format of survey 2010 in which the distance is replaced by UTM coordinates in meter. To achieve this process, a developed program was designed to convert the old format into projection coordinates (WGS 84, zone 36 N).
The beach-nearshore profile survey data, land elevation and water depth, are referenced to the Mean Sea Level (MSL) using local fixed beach marks of known elevation. Survey data for each profile is used to describe the topography of land and seabed along the profile line from start point located on the baseline to the end of profile. The geostatistical analyst tool in ArcGIS is used to create digital elevation layer using all profiles data for survey of 1971, the raster layer obtained from the previous step is converted into vector layer. In the final stage the shoreline position, vector line, is extracted in separate file that saved as a new feature class, this feature class created into the feature dataset as a line geometry type. After applying these procedures four times over all data of profile surveys; 1981, 1991, 2001 and 2010, the position of shoreline for these periods are saved as separate feature classes. The feature classes of the baseline and the shorelines created into the feature dataset are stored in geodatabase which previously created using Data Management Tools in ArcGIS software. In addition, the shoreline positions surveyed over the period between 2004 and 2013 are stored in dataset as 7 feature classes (lines). The feature class is one of the most commonly used data sources, it is composed of geographic features with the same type of geometry (point, line, or polygon) and the same set of attributes. These features were adjusted according to projection coordinates (UTM, zone 36 N- WGS 84). Ultimately, fourteen successive shorelines over a period of 42 years were defined and represented using ArcGIS 9.3 software (Figure 3).
In order to assess the rate of shoreline change, spatial shoreline changes, the DSAS module is used in ArcGIS to create a new transect file in which 477 alongshore transects, lines perpendicular to hypothetical baseline, are generated within spanning 300-m alongshore of the Nile Delta coast. DSAS determines or concludes all required information from the input baseline, shoreline, and transect files (e.g. distance to each shoreline from the baseline, the date for each shoreline, the position of the baseline, transect spacing, and transect length). Figure 4 summarizes the stages of methodology for estimating shoreline change, including; data preparation, data creation and shoreline change measurement. The approach of rate calculation is depended on measuring the differences between shoreline positions through time. Two methods are used in the present study to calculate the rate of shoreline change; the first is defined as End Point Rate (EPR) [32] in which the mean annual rate of shoreline change (meters per year) is calculated by dividing the distance of shoreline movement by the time elapsed between oldest and the most recent shoreline. The major advantages of this method are the ease of computation and minimal requirement of only two shoreline surveys. The rate of shoreline change during the period between 1971

Figure 4. Flowchart summarizes the methodology used in the present study to calculate rate of shoreline change and the area of back-shore zone.
and 1981, two shorelines, is calculated using this approach (EPR method).
After applying (EPR) method three times, the annual rate of shoreline change was calculated for three time periods as following; 1981-1991, 1991-2001 and 2001-2010. The second method is Linear Regression Rate (LRR) in which the rate can be determined by fitting a least-squares regression line to all intersection point between shorelines (more than two shorelines) and transect-line. This method is used to compute the annual rate of shoreline change during the period between 1971 and 2013, 12 shorelines, based on the measured distance between the fixed baseline point and the shoreline position. All previous procedures are performed automatically using DSAS module within ArcGIS 9.3 software.
In order to estimate the surface area of back-shore zone due to shoreline changes (retreat/advance), the geostatistical analyst tool (ArcGIS) is used to create the digital elevation layers (raster datasets) from the beach-nearshore profile data for 5 different decadal surveys; 1971, 1981, 1991, 2001 and 2010. Ultimately, five raster surfaces convert into contours or isolines (polyline features), the new feature classes created into the feature dataset and stored in geodatabase that designed by ArcGIS. The shorelines of five dates are extracted in separate files, each file converts into a new feature class (point geometry X, Y) that stored as text file. Each file represents shoreline position at certain year. In addition to the five text files for coastline that created from beach-nearshore profile surveys, there are seven files represented the shoreline position of seven surveys; 2004, 2005, 2006, 2007, 2008, 2009 and 2013. After preparing the data of shoreline positions as a text file format, the Modelbuilder (generic model in ArcGIS) is used to develop a new methodology (model area) that can be used in this work to estimate surface area corresponding to shoreline changes. There are three basic phases (methods or techniques) for creating model area, the first is a process of conversion the shoreline from point, geometry type, into polygon (geometry type). Consequently, two polygons, two feature classes, were obtained; one for old shoreline and other for recent shoreline. After finishing the second phase the shoreline changes are specified and classified (as polygons) in one feature class, where in attribute table the erosion zones take value of (+1) while accretion zones take value of (−1) (see in Figure 5). After applying the final phase, two feature classes are obtained, one for erosion zone and other for accretion zone (see in Figure 5), moreover, attribute table contained area of each zone. Figure 6 shows the main user interface and the diagram of module of calculating area in Model builder. The obtained results from this model are given in form of tables and graphs.
4. Results and Discussion
The measurements of shoreline position for successive years is used as a method or approach to calculate the shoreline change rate along the study area (Figure 7 & Figure 8) that might be resulted from the construction of marine structures, in addition to estimating the surface area of back-shore zone along the coastline of the study area that is lost or gained according to the displacement of the shoreline toward land (erosion or recession) or seaward (accretion or advance), respectively. In the present work, the rate of shoreline change was calculated along the Nile Delta coast between the start and end of decade, i.e. every 10 years (e.g. 1971-1981), (Figure 7) over a period of 42 years (1971-2013) using the end- point rate method (EPR), where the rate is calculated by dividing the distance of the shoreline displacement by the time elapsed between the oldest and the most recent shoreline. The major advantages of the (EPR) method are the ease of
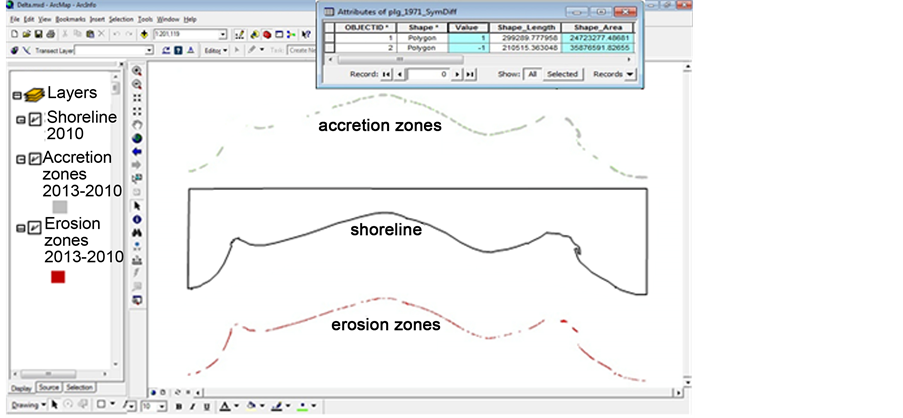
Figure 5. Shows the shoreline in form of polygon geometry, erosion and accretion zones, and attribute table.


Figure 6. ArcGIS Modelbuider for calculating the surface area of back-shore zone due to shoreline change. Modelbuilder tool dialog box (upper panel) and Modelbuilder diagram (lower panel).

Figure 7. The annual rate of shoreline change along the Nile Delta coast for the time periods; (f) 1971-1981, (e) 1981-1991, (d) 1991-2001, (c) 2001-2010, (b) 1971-2013. (a) The study area is divided into six zones, Z1-Z6, by waterways, S1 to S6 are the geographic boundaries of these zones.

Figure 8. The variation of surface area of back-shore along the study area, Nile Delta coast, over the period of 42 years (1971-2013).
computation and applicable to at least two shoreline dates. As well as, the Linear Regression Rate method (LRR) was used in cases where more data are available.
A number of waterways is intervened the coastline of the study area, e.g. Idku outlet S1; Rosetta estuary S2; outlet burullus S3; entrance of Damietta harbour S4; Damietta estuary S5; entrance of Port Said S6 (see Figure 2 & Figure 7(b)). Through these watercourses, the coast can be divided into six zones (Z1 to Z6; Figure 7(a) and Table 1) to illustrate the change in the shoreline positions along the study area easily. Starting from the west side of the study area, the results show that the beach erosion on the both sides of Idku inlet ranges from 1 to 4 m/yr with a loss in back-shore surface area of 0.05 km2 in the first zone Z1 (1.24 km long). After constructing two jetties at the entrance of Idku inlet, these jetties have trapped a part of sand that comes with the eastern currents. Consequently, this region is characterized by shoreline advance at fluctuating rate between 1.2 and 3.2 m/yr, with increased 0.03 km2 in surface area of the beach (Figure 8(a)).
Along the coast of second zone Z2 (extend about of 29.41 km long from S1 to S2), the rate of shoreline change and back-shore surface area was calculated over distinct periods; pre-construction and post-construction of seawall. Before completing the construction of seawall, the obtained results reveal that the shoreline change was characterized by a maximum recession on both sides of the Rosetta mouth, and fronting the Rosetta seawall (40 m/yr). This coastline is recessed at mean rate of 13 m/yr, as well as the shoreline along the south-end of seawall

Table 1. Estimation of the surface area over the period of 42 years (1971?2013) along the study area (Z1-Z6). Figure 7(a) shows the geographic limits of six zones (Z1-Z6).
retreated (6 m/yr), this displacement is resulted to loss a part of the back-shore zone (1.1 km2) over the period of 20 years (1971-1991). These rates decrease in the south-west direction of Rosetta promontory until a certain point at which the erosion process is stopped and converts into an accretion phenomenon. Where the wave-induced longshore currents carry and transport the eroding sand from erosion area to create accretion zone at 5 km west the mouth of Rosetta. This accretion resulted in increasing the rate of shoreline advance, ranges from 4 to 7 m/yr with an increase in gained land (1.8 km2), (see Figure 8(b)). After constructing the Rosetta seawall that were designed to be carried out on the back-shore at a distance of 80 to 90 m from the shoreline toward land [21] , the beach fronting of this wall eroded and disappeared completely during the early 2000s. Since 2001, the seabed off the wall is scoured with an increase in water depth plus increase in shoreline retreat at south end of western seawall. This eroding zone remains a sole source of sand for adjacent coast areas. At the third zone Z3 ( 60.43 km long, coast from S2 to S3,) the shoreline change can be divided into three parts (sub-zones) according to dominant phenomenon (erosion or accretion), the first part extends from Rosetta mouth to west Abu Khashaba ( 9.1 km long), where the coastline is retreated completely, with a maximum displacement of 1.6 km towards land during the period from 1971 to 2010. The rate of shoreline change off the eastern seawall at the tip of Rosetta promontory, ranges from 30 to 101 m/yr, this erosion was resulted from concentration of wave energy on Rosetta promontory that is considered wave convergence zone (Figure 7(a)). In this region, the back-shore area was eroded or retreated by 6.4 km2 over a period of 30 years (i.e. 52 m2 per m length per year) (Figure 8), this erosion provides sediment that is transported through longshore current for the nearby shores (Figure 7(a)). In general, the promontory tip zone is acting as a source of sediments for adjacent deposited areas. Abu Khashaba coast is characterized by a maximum displacement of the shoreline seawards at rate of 6.5 m/yr, where this area acts as a sink zone for trapping the eroded sand coming from promontory tip. Generally on long term, from 1971 to 2013, the shoreline displacement between Abu Khashaba and west of fishing port at Burullus, third sub-zone, ( 43.1 km long) is fluctuated between successive phases of advance at an average rate of 6.1 m/yr with increase in land surface area of 3.37 km2 (~7.1 m2 per m length per year), and other retreat phases at an average rate of 2.3 m/yr, with a significant decrease in the back-shore surface area of 3.27 km2 (~1.8 m2 per m length per year). The advance of shoreline was greatest near the inlet of Burullus, at a rate of 10 m/yr.
In the fourth zone “Z4” (shore from S3 to S4, 78.56 km long), the shoreline change along the Burullus headland from Burullus inlet to Kitchener drain is fluctuating from erosion to accretion due to construction of a various types of marine structures; including jetties, revetment, basalt riprap, groins and detached breakwaters (Figure 2(c) & Figure 2(d)). In general, the erosion has been continued ~13 km long from the eastern end of the basalt riprap at El-Banaeen village, where the annual rate of shoreline change ranges between ~1.5 and ~9 m/yr. The location of this coast on down-drift side of the western jetty at Burullus inlet is contributed to erode the shoreline. During erecting 17 detached breakwaters along surf-zone off the beach of Baltim resort, the erosion was converted into local accretion. Following construction of these breakwaters, accretion has become the dominant process with the formation of tombolos on the leeward side of the structures, where the shoreline displacement towards sea is fluctuating between 2 m/yr and 32 m/yr. The loss of back-shore area along the coast of zone Z4 was 8.036 km2 over a period of 42 years (~4.5 m2 per m length per year), while the beach gained the surface area about of 6.572 km2, see Table 1, (~4.4 m2 per m length per year).
After building the pair of jetties at the entrance of the New Damietta Port, the sand associated with the eastern currents is deposited on the updrift side of the western jetty (zone Z4), where the rate of shoreline change ranges from 9 to 16 m/yr (Figure 7). While the erosion was dominated on the downdrift side of the western jetty (zone Z5 “8.81 km long”, coast from S4 to S5), the annual rate of shoreline retreat fluctuates between 1.5 m/yr and 15 m/yr (Figure 7), this change is resulted in loss a surface area about of 1.13 km2 from back-shore, sea Table 1, (~6.2 m2 per m length per year). Further to the east and following the construction of eight shore-parallel breakwaters off Ras El-Bar resort (zone Z5), the erosion systematically diminishes and then reverses into local accretion to form the tombolo, with an rate ranges between 2 and 8 m/yr. This accretion is associated with an increase in a surface area of 0.23 km2 (~1.8 m2 per m length per year). Finally, the shoreline change in zone Z6 (28.82 km long, shore from S5 to S6 “Figure 2 & Figure 7(b)”), indicates that the maximum retreat occurred at the upper and middle parts of Damietta spit and west of El-Gamil inlet at an average rate of 4.5 m/yr, with a decrease in surface area (1.4 km2). In contrast, maximum advance of shoreline concentrated on the updrift side of Port Said western jetty at a mean rate of 6.1 m/yr, with an increase in the surface area of 1.9 km2. The results in Table 1 indicate that the surface area of erosion zones along the study area is almost equal to the surface area of accretion zones except Z3, shoreline from Rosetta to Burullus, where erosion zone is 1.47 km2 and accretion zone is 12.95 km2, this difference has been occurred because the most of eroding sediments from Rosetta promontory deposited in deep water while small part of these sediments deposited on shore.
5. Conclusions
This study contributes to increasing the knowledge about of the shoreline changes based on multi-decadal surveys on the Nile Delta coast. In addition, a proposed methodology is developed for calculating surface area of back-shore using Modelbuilder in ArcGIS software and estimating the rate of shoreline change depending on shoreline position and beach profile surveys along the coast of Nile Delta, in Egypt. This study revealed the following points:
1) ArcGIS Modelbuilder provides a set of tools for building various types of geo-processing models and helps to solve a complicated spatial problem.
2) Engineering structures built along the coastline did not solve completely or stop the erosion problem but shifted it from one place to another or focused it in front off these structures.
Acknowledgements
The author appreciates the assistance of the staff of the Coastal Research Institute for the field and laboratory activities of this study. Appreciation is also given to Drs. Omran Frihy and Abdel Monaam Badr for review.
Cite this paper
Deabes, E.A.M. (2017) Applying ArcGIS to Estimate the Rates of Shoreline and Back-Shore Area Changes along the Nile Delta Coast, Egypt. International Journal of Geosciences, 8, 332-348. https://doi.org/10.4236/ijg.2017.83017
References
- 1. Heo, J., Kim, J.H. and Kim, J.W. (2009) A New Methodology for Measuring Coastline Recession Using Buffering and Non-Linear Least Squares Estimation. International Journal of Geographical Information Science, 23, 1165-1177.
https://doi.org/10.1080/13658810802035642 - 2. Paskoff, R. (1998) Les littoraux. Impact des aménagements sur leur evolution. 3rd Edition, Armand Colin, Paris, 260 p.
- 3. Dolan, R., Hayden, B., Rea, C. and Heywood, J. (1979) Shoreline Erosion Rates along the Middle Atlantic Coast of the United States. Geology, 7, 602-606.
https://doi.org/10.1130/0091-7613(1979)7<602:SERATM>2.0.CO;2 - 4. Fadi, C., Hanan, D., Yvonne, B.Q., Barbara, L., Eric, M., Jamal, E. and Erick, C. (2012) Using Arc GISH Model Builder and Aerial Photographs to Measure Coastline Retreat and Advance: North of France. Journal of Coastal Research, 28, 1567-1579.
- 5. Zhang, K., Douglas, B.C. and Leatherman, S.P. (2004) Global Warming and Coastal Erosion. Climatic Change, 64, 41-58.
https://doi.org/10.1023/B:CLIM.0000024690.32682.48 - 6. Dolan, R., Hayden, B. and Heywood, J. (1978) A New Photogrammetric Method for Determining Shoreline Erosion. Coastal Engineering, 2, 21-39.
https://doi.org/10.1016/0378-3839(78)90003-0 - 7. Li, R., Liu, J.K. and Felus, Y. (2001) Spatial Modeling and Analysis for Shoreline Change Detection and Coastal Erosion Monitoring. Journal of Marine Geodesy, 24, 1-12.
https://doi.org/10.1080/01490410151079891 - 8. Srivastava, A., Niu, X., Di, K. and Li, R. (2005) Shoreline Modeling and Erosion Prediction. ASPRS 2005 Annual Conference, Baltimore, 7-11 March 2005, 11 p.
- 9. Ali, T.A. (2003) New Methods for Positional Quality Assessment and Change Analysis of Shoreline Features. PhD Thesis, Ohio State University, Columbus, 156 p.
- 10. Leatherman, S.P. (2003) Shoreline Change Mapping and Management along the U.S. East Coast. Journal of Coastal Research, 38, 5-13.
- 11. Armaroli, C., Ciavola, P., Balouin, Y. and Gatti, M. (2006) An Integrated Study of Shoreline Variability Using GIS and ARGUS Techniques. Journal of Coastal Research, Special Issue No. 39, 473-477.
- 12. Moore, L.J. (2000) Shoreline Mapping Techniques. Journal of Coastal Research, 16, 111-124.
- 13. Sestini, G. (1976) Geomorphology of the Nile Delta. Proceedings UNESCO Seminar on Nile Delta Sedimentology, Alexandria, 25-29 October 1976, 12-24.
- 14. Frihy, O.E., Fanos, A.M., khafagy, A.A. and Komar, P.D. (1991) Nearshore Sediment Transport along the Nile Delta Egypt. Coastal Engineering Journal, 15, 409-429.
https://doi.org/10.1016/0378-3839(91)90021-8 - 15. Tetra Tech (1984) Shore Protection Master Plan for the Nile Delta Coast. Consulting Engineering Report, No. 1, 2 and 3, Shore Protection Authority of Egypt.
- 16. UNESCO/UNDP (1978) Coastal Protection Studies. Final Technical Report, Paris, 155 p.
- 17. Blodgt, H.W., Taylor, P.T. and Roark, J.H. (1991) Shoreline Changes along the Rosetta-Nile Promontory: Monitoring with Satellite Observations. Marine Geology, 99, 67-77.
https://doi.org/10.1016/0025-3227(91)90083-G - 18. Deabes, E.A. (2007) The Use of Remote Sensing and Geographic Information System (GIS) in Building a Decision Support System (DSS) for Coastline Management of the Nile Delta. PhD Thesis, Oceanography Department, Alexandria University, 143 p.
- 19. Dewidar, K. and Frihy, O.E. (2008) Pre- and Post-Beach Response to Engineering Hard Structures Using Land Sat Time—Series at the Northwestern Part of the Nile Delta, Egypt. Journal of Coastal Conservation: Planning and Management, 11, 133-142.
https://doi.org/10.1007/s11852-008-0013-z - 20. El-Raey, M., Nasr, S.M., El-Hattab, M.M. and Frihy, O.E. (1995) Change Detection of Rosetta Promontory over the Last Forty Years. International Journal of Remote Sensing, 16, 190-204.
https://doi.org/10.1080/01431169508954446 - 21. Frihy, O.E. (1988) Nile Delta Shoreline Changes: Aerial Photographic Study of a 28 Year Period. Journal of Coastal Research, 4, 597-606.
- 22. Klemas, V. and Abdel Kader, A.M. (1982) Remote Sensing of Coastal Processes with Emphasis on the Nile Delta. International Symposium on Remote Sensing of Environments, Cairo, 19-25 January 1982, 27 p.
- 23. El Sayed, M.A., Younan, N.A., Fanos, A.M. and Baghdady, KH. (2005) Accretion and Erosion Patterns along Rosetta Promontory, Nile Delta Coast. Journal of Coastal Research, 21, 412-442.
https://doi.org/10.2112/03-0121.1 - 24. Fanos, A.M., Frihy, O.E., Khafagy, A.A. and Komar, P.D. (1991) Processes of Shoreline Change along the Nile Delta Coast of Egypt. Coastal Sediments’91 Conference, Vol. 2, Seattle, 25-27 June 1991, 1547-1557.
- 25. Frihy, O.E. and Komar, P.D. (1991) Patterns of Beach-Sand Sorting and Shoreline Erosion on the Nile Delta. Journal of Sedimentary Petrology, 61, 544-550.
- 26. Frihy, O.E., Badr, A.M. and Hassan, M.S. (2002) Sedimentation Processes at the Navigation Channel of the Damietta Harbor on the Northeastern Nile Delta Coast of Egypt. Journal of Coastal Research, 18, 459-469.
- 27. Frihy, O.E., Deabes, E.A. and El Sayed, W. (2003) Processes Reshaping the Nile Delta Promontories of Egypt: Pre- and Post Protection. Geomorphology, 53, 263-279.
https://doi.org/10.1016/S0169-555X(02)00318-5 - 28. Inman, D.L. and Jenkins, S.A. (1984). The Nile Littoral Cell and Man’s Impacts on the Coastal Zone of the Southeastern Mediterranean. SIO Reference Series 84-31, Scripps Institute of Oceanography, La Jolla, 43 p.
- 29. Thieler, E.R., Himmelstoss, E.A., Zichichi, J.L. and Miller, T.L. (2005) Digital Shoreline Analysis System (DSAS) Version 3.0; An Arc GIS Extension for Calculating Shoreline Change. U.S. Geological Survey Open-File Report, 2005-1304.
- 30. Orlova, G. and Zenkovich, V. (1974) Erosion of the Shores of the Nile Delta. Geoforum, 18, 68-72.
https://doi.org/10.1016/0016-7185(74)90007-4 - 31. Stanley, D.J. and Warne, A.G. (1993) Nile Delta: Recent Geological Evolution and Human Impacts. Science, 260, 628-634.
https://doi.org/10.1126/science.260.5108.628 - 32. Dolan, R., Fenster, M.S. and Holme, S.J. (1991) Temporal Analysis of Shoreline Recession and Accretion. Journal of Coastal Research, 7, 723-744.