International Journal of Geosciences
Vol.5 No.8(2014), Article
ID:48342,9
pages
DOI:10.4236/ijg.2014.58073
The Use of Seismic Attributes to Enhance Fault Interpretation of OT Field, Niger Delta
Benard Ifeanyi Odoh, Juliet Nneamaka Ilechukwu, Nnaemeka Ifeanyi Okoli
Department of Geological Sciences, Nnamdi Azikiwe University, Awka, Nigeria
Email: bi.odoh@unizik.edu.ng, amakagreat@yahoo.com, leonine_okoli@yahoo.com
Copyright © 2014 by authors and Scientific Research Publishing Inc.
This work is licensed under the Creative Commons Attribution International License (CC BY).
http://creativecommons.org/licenses/by/4.0/
![]()
![]()

Received 21 April 2014; revised 22 May 2014; accepted 17 June 2014
ABSTRACT
An integrated approach to the study of the fault patterns and seismic attributes was carried out on the OT field using a 3D swamp seismic data covering approximately 420 Km2 of western belt of the Niger Delta. This study aimed at improving the visualization of faults in the study area using different seismic attributes. Three major growth faults dipping south with few antithetic faults dipping in opposite direction to the growth faults and other minor faults were identified manually on the original and steered seismic cube in the inline 11669, while in the cross line only one major fault was identified manually. The seismic volume was subjected to several stages of post-stack processing to enhance discontinuities. First, a dip-steering volume was created. Several dip-steered filters were then applied to enhance faults and fractures visualization. Finally, similarity and curvature attributes were calculated on the dip-steered and fault enhanced volume. These final attributes show detailed geometry of the fault system and the numerous subtle lineaments in the study area. The integration of the attributes has increased confidence in the seismic mapping of the faults and the other numerous subtle lineaments which were difficult to identify on the input data. Similarity and curvature attributes of the seismic volume preserve subtle structural details and permit a more robust interpretation of the structures.
Keywords:Dip-Steered Filters, Similarity and Curvature Attributes, Faults, Niger Delta

1. Introduction
Seismic attributes form an integral part of qualitative interpretative tool that facilitates structural and stratigraphic interpretation as well as offers clues to lithology type and fluid content estimation with a potential benefit of detailed reservoir characterization [1] . For instance, fault structures which have been classified into seismically resolvable and sub-seismic scale (subtle) faults can be interpreted more effectively with the aid of seismic attribute [1] . Though the seismically resolvable faults may be interpreted using traditional diagnostic criteria (e.g. abrupt reflector cut off, kinks etc.), the subtle faults which are often of geological or exploration significance are usually not visibly imaged by the conventional seismic sections and time slices displays. This is because they have smaller throws relative to the resolution limit of the seismic survey, which is a factor dependent on the frequency content, signal to noise ratio of the dataset and also the depth to the reflecting horizon. In this paper, we have subjected the steered seismic cube to seismic attribute generation and analysis. Seismic attribute analysis helped to identify faults missed using the conventional method of interpretation [1] . Identification of faults is essential in effective definition and mapping of prospects especially now that exploration and production in the Niger Delta has moved to geologically complex frontier deep-water settings. Structural interpretation of seismic data from seismic anomalies related to faulting from noise is challenging. Seismic attributes have been used for many years to delineate faults and stratigraphic features that are difficult to map using standard amplitude seismic data [2] . In this paper, we have applied multiple seismic attributes for accurate detection and mapping of faults and fractures relevant for prediction of seismic structure of fault regions ahead of drilling costly oil and gas wells.
2. Theoretical Background
Seismic attributes are defined as all the information obtained from seismic data, either by direct measurements or by logical or experience based reasoning [1] . Seismic attributes are essentially derivatives of the basic seismic measurements i.e. time, amplitude, frequency and attenuation which also form the basis of their classification. It was also defined; as a measurement based on seismic data such as envelope, instantaneous phase, instantaneous frequency, polarity, dip and dip azimuth, etc. It is important to note that attribute interpretation supplements conventional structural interpretation and the discriminating properties of the attributes set may be critically checked for its relevance for a particular problem of a prospect. The seismic data is treated as an analytic trace which contains real components (original input trace) and the complex (imaginary) [1] .
3. Materials and Method
This work was completed using seismic data volume (shown in Figure 1) which was loaded and quality checked into the interpretative tool, in this case OpendTect software. Manual mapping of the major regional faults were done inline and cross line. The original seismic volume was steered to improve its quality by increasing the signal to noise ratio. Seismic attributes such as similarity, dip, curvature, and fault enhancement filter were extracted from the steered cube. The extracted attributes were analyzed and it was observed that similarity showed better response to faults than any other attribute used for the study.
In OpendTect window environment, the calculation of similarity is favoured by the determination of direction of best match at every position which is a result by itself: the dip. By using this dip we can then calculate the best Similarity between adjacent traces. Similarity is based on fundamental mathematics: the samples of the trace are seen as components of a vector, and the Similarity is defined in terms of distance in hyperspace.
The point about using similarity is that it is mathematically simple; it is very clear what is going on. Then, by combining different kinds of similarities and other attributes, you can always get much better results with lots less computing time. Consider the trace segments to be vectors in hyperspace. Similarity is then defined as one minus the Euclidean distance between the vectors, normalized over the vector lengths (Figure 2).
4. Workflow
To achieve the aim of the study, an integrated approach was undertaken. A summary of the workflow is shown in Figure 3 below.
A steering cube of the dip of the seismic events in inline and cross line direction at every sample point is created from the seismic amplitude volume. The dip is itself an attribute that is used for the structurally oriented filtering. BG algorithm is then used and because it is sensitive to noise, a median filter was applied to the steering cube in each case. The BG Fast Steering algorithm was developed by BG based on analysis of the gradient of the amplitude data in the horizontal and vertical domains. The steering cube forms the foundation for the structural oriented filtering of seismic volumes, enhancing multi-trace attributes and eventually curvature attribute generation. In dip steering, attributes are guided along a three dimensional surface on which the seismic phase
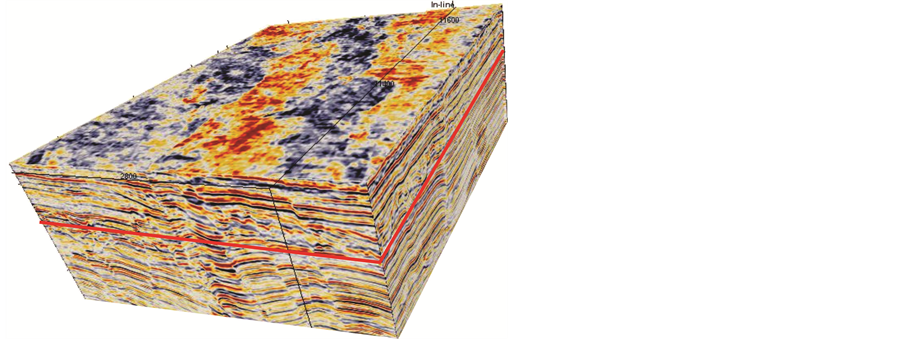
Figure 1. Perspective view of the 3D seismic volume used for this study. The red outline indicates the location of time slices extracted from the data.
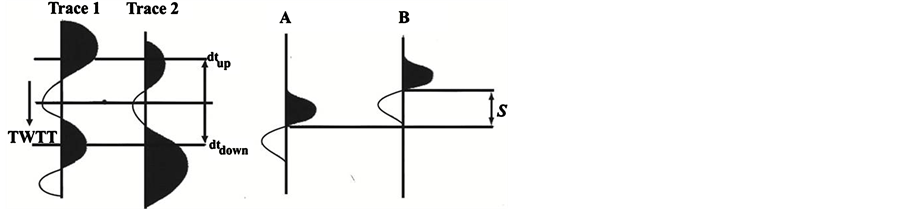
Figure 2. Schematic illustration of the similarity between two trace segments and the effect of dip on trace similarity computation.
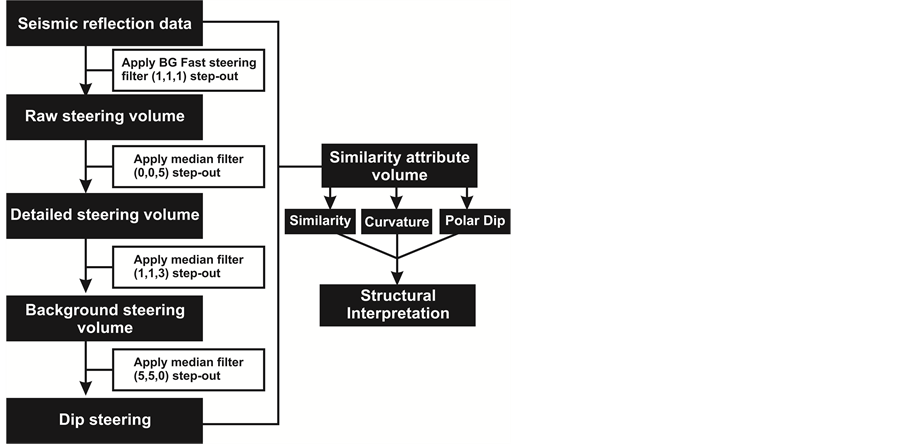
Figure 3. Workflow for structural interpretation applied to the seismic data.
is approximately the same (Figure 4(a)). In this process, a virtual horizon was created at each position by following the dip/azimuth information from the steering cube from trace to trace as illustrated in Figure 4(b) and Figure 4(c). The dip steered data was then used as a filter, to calculate the attribute response .The filter sizes applied was first tested to see the size that gives the best filter without introducing artifacts or removing important geological details (Table 2). The dip steered seismic volume was used as noise filter. The noise filtering was achieved by applying four dip-steered-median filters of different sizes, in-step-out to the dip-steered cube using the BG algorithm. The median filter removed random noise and enhanced laterally continuous seismic events by filtering noise along the structural dip. In median filtering, the center amplitude in a dip-steered circle was replaced by the median amplitude within the extraction volume; the effect was an edge-preserving smoothing of the seismic data. Two dip-steered filters were used, the dip median and the dip-diffusion filters. The combination of the two filters produced a dip-steered attribute volume with a lot of structural information.
Exhaustive explanation of the mathematics of dip and azimuth processing applied to the seismic data used in this study is discussed in [3] -[5] .
5. Results and Discussion
5.1. Fault Interpretation
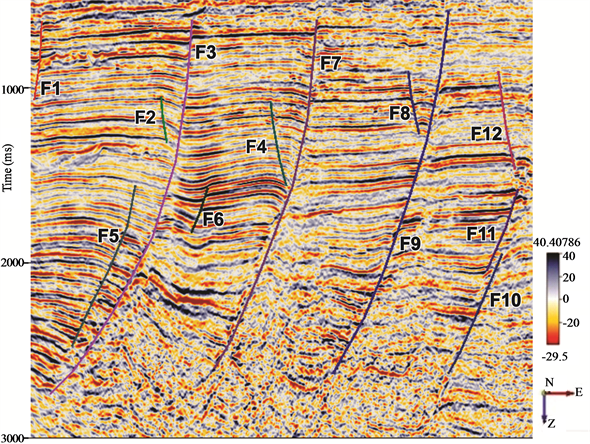
The structural framework was done by picking assigned fault segments on inline 11669 sections of seismic volume and on the cross line 3045. These faults are represented on the seismic sections as discontinuous reflection along a preferred orientation of reflectors or as distortion of amplitude around the fault zones. A total of twelve faults coded as: F1, F2, F3, F4, F5, F6, F7, F8, F9, F10, F11 and F12 were identified on the inline (Figure 5); some extending through the extent of the field known as major regional growth faults, and few antithetic faults (Table 1). The three major regional growth faults F3, F7 and F9 are dipping to the south away from direction of sediment supply, while others are dipping north (Table 1).
5.2. Attribute Analysis
Different attributes (i.e. Similarity, polar dip, curvature, maximum curvature, minimum curvature, and diffusion filter) were run on the seismic cube and z-slice were taken on the original seismic, and displayed as flattened maps. Slices were taken at 1000 ms. Structures respond to acoustic wave in different ways thus, the different attributes extracted are best used to study different subtle and sub-seismic faults missed by conventional seismic interpretation.
5.3. Fault Enhancement Filter
Figure 6(a) and Figure 6(b) show the amplitude time slice extracted from the seismic volume at 1000 ms. Figure 6(a) is the raw seismic data, while Figure 6(b) is the same time slice after the application of a fault enhanced filter (dip median and diffusion). We can clearly see how the filter has enhanced the edges and focus of the faults. The fault enhanced seismic volume forms the input for the calculation of the dip-steered similarity volume (Figure 7).
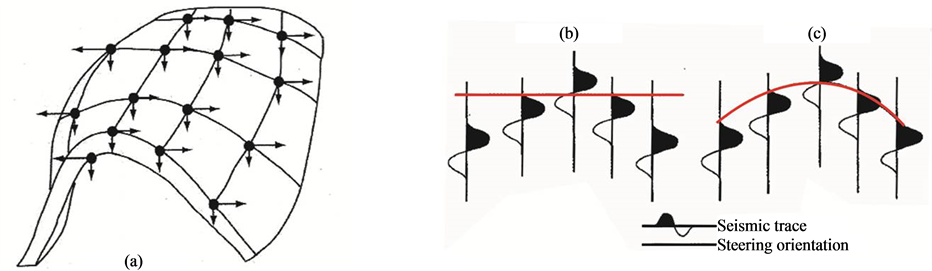
Figure 4. (a) 3D Schematic illustration of the concept of dip-steering. The arrows indicate the steering directions; (b) and (c) are 2D schematic illustration of dip-steering. In (b) no steering is applied to the data and the trace segments are aligned horizontally while in (c) the application of full steering correction ensures the location and azimuth of the traces are updated at every trace location.
 (a)
(a)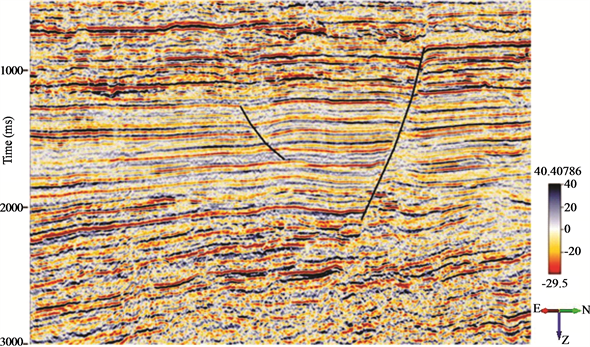 (b)
(b)
Figure 5. (a) Mapped faults on inline 11669 and (b) Mapped faults on crossline 3045.

Table 1. Interpreted faults on inline 11669 of the steered seismic cube.
Table 2. Seismic attributes parameter settings.
 (a)
(a)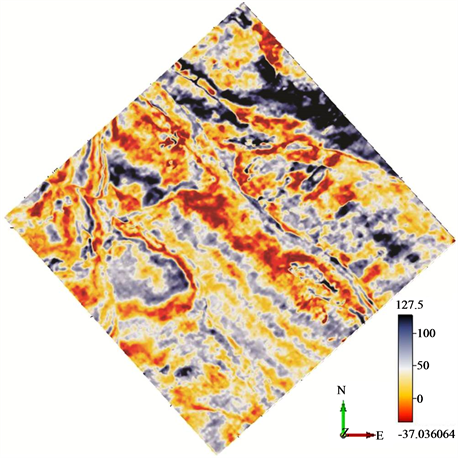 (b)
(b)
Figure 6. (a) Time-slice through the original seismic at 1000 ms; (b) Amplitude z-slice extracted at 1000 ms from the steered seismic volume after the application of fault enhanced filter (median and diffusion filters). Note the more coherent and sharper structural imaging of the faults indicated by block arrow after the fault enhancement process. This fault enhanced volume is the input for the calculation of similarity volume.
5.4. Similarity Attribute
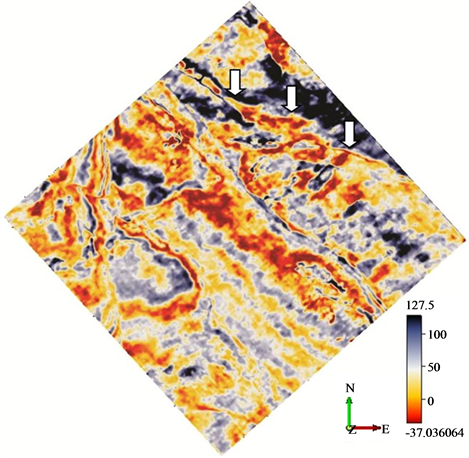
The similarity attribute is a form of “coherency” attribute that expresses how much two or more trace segments look alike. A similarity of 1 means the trace segments are completely identical in waveform and amplitude and a similarity of 0 means they are completely dissimilar. This attribute is particularly effective at highlighting small faults and fractures because faults tend to similarity by juxtaposing out-of-phase amplitudes. Figure 8 and Figure 9 shows the similarity attribute at 1000 ms, and clearly visible is the major growth faults and other numerous fractures that were not seen in the original seismic data.
5.5. Curvature Attribute
Several curvature attributes volume has been calculated and the applicability of these attributes described in the preceding sections.
Maximum curvature: Maximum curvature defines the largest absolute curvature and is orthogonal to minimum curvature. This attribute shows a fault by the juxtaposition of positive curvature values and negative curvature values, thus the orientation and position of the upthrown and downthrown fault blocks can easily be defined. [6] describes this delimiting property of maximum curvature as an artifact of the curvature calculation
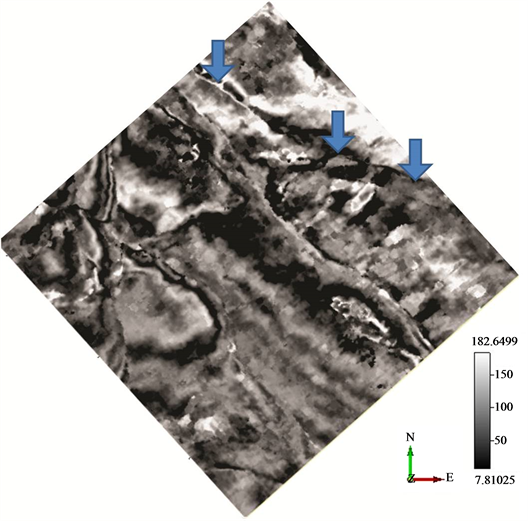
Figure 7. Background dip-steered time-slice extracted at 1000 ms from the background steered volume. Note the highly smoothened background structure that has defined the geometry of the main faults. This volume is one of the input data for the calculation of similarity volume.
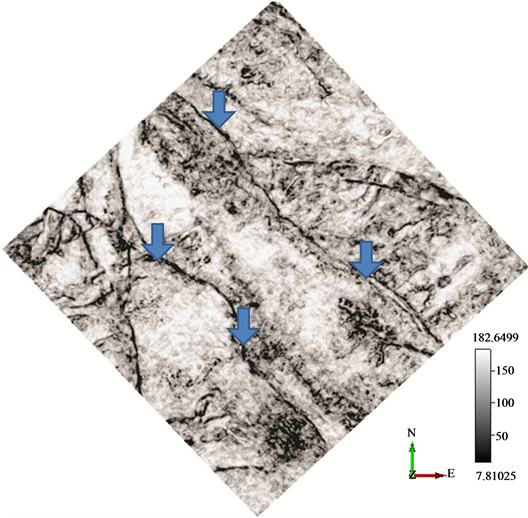
Figure 8. Fault enhanced minimum similarity none-steered attribute time z-slice extracted at 1000 ms from the similarity volume. The similarity attribute is a form of “coherency” that expresses how similar seismic waveforms are. Low similarity represents faults and fractures. Note how this attribute shows the faults better. The blue arrows indicate the fault.
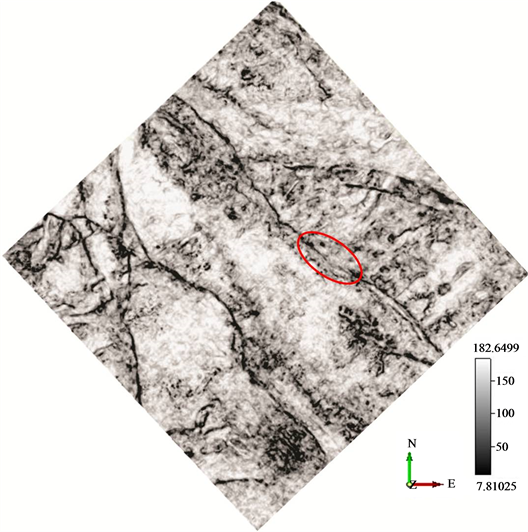
Figure 9. Fault enhanced minimum-similarity-full steered attribute time-slice extracted at 1000 ms from the similarity volume. The similarity attribute is a form of “coherency” that expresses how similar seismic waveforms are. Low similarity represents faults and fractures. Note how over-processing could remove some important detail; the red ring encloses an area where the fault is affected by over processing.
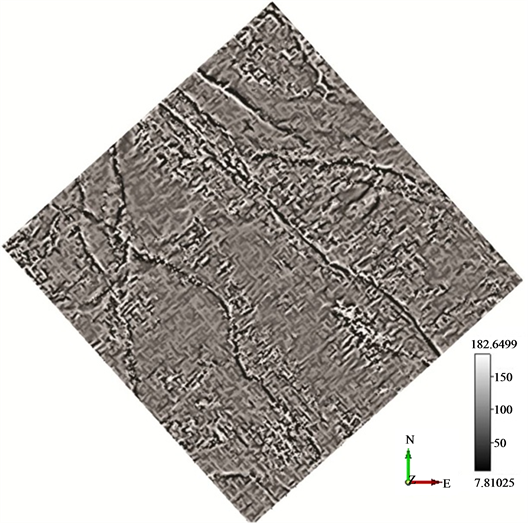
Figure 10. Maximum curvature attribute z-slice extracted at 1000 ms from the maximum curvature volume. This attribute show the upthrown and downthrown fault blocks; typical when applied to an extensional tectonics affected zone.
process. Figure 10 shows artifact features useful in structural interpretation of faults. This artifact results from the smoothening effect of the pre-filtering and least square approximation on abrupt changes due to faults. The curvature smoothening creates higher curvature values on the upthrown side and lower negative curvatures on the downthrown side.
6. Conclusion
Interpretation of the 3D seismic data for locating both seismic scales’ and sub-seismic scales’ structural elements has been demonstrated to be more efficient by the use of seismic attribute mapping and analysis. Similarity attribute map has proved to be a more appropriate tool to study fault architecture than dip attribute or any other attribute map in the study area. Therefore, to reduce the risk of drilling dry hole, resulting from missed fault by conventional seismic interpretation, seismic attribute analysis can be integrated into the standard practice of hydrocarbon Exploration and Production Company
Acknowledgements
The authors are grateful and thankful to dGB Earth Sciences and Danvic Concept for donating OpendTect software for academic use at the department of Geological Sciences of Nnamdi Azikiwe University, Nigeria. We thank management of Nnamdi Azikiwe University for providing the enabling environment and other useful supports.
References
- Adigun, A.O. and Ayolabi, E.A. (2013) The Use of Seismic Attributes to Enhance Structural Interpretation of Z-Field, Onshore Niger Delta. Journal of Climatology & Weather Forecasting, 1, 102.
- Babangida, W.J., Tim, J.R. and Graham, K.W. (2013) Application of Volumetric Seismic Discontinuity Attribute for Fault Detection: Case Study Using Deep-Water Niger Delta 3D Seismic Data. The Leading Edge, 32, 424-428. http://dx.doi.org/10.1190/tle32040424.1
- Tingdahl, K. (2003) Improving Seismic Chimney Detection using Directional Attributes. In: Nikravesh, M., Zadeh, L. and Aminazadeh, F., Eds., Developments in Petroleum Sciences, Elsevier, Amsterdam, 157-173.
- Tingdahl, K. and de Groot, P. (2003) Post-Stack Dip and Azimuth Processing. Journal of Seismic Exploration, 12, 113-126.
- Tingdahl, K. and de Rooij, M. (2005) Semi-Automatic Detection of Faults in 3-D Seismic Data. Geophysical Prospecting, 53, 533-542. http://dx.doi.org/10.1111/j.1365-2478.2005.00489.x
- Roberts, A. (2001) Curvature Attributes and Their Application to 3D Interpreted Horizons. First Break, 19, 85-99. http://dx.doi.org/10.1046/j.0263-5046.2001.00142.x