International Journal of Geosciences
Vol.4 No.10(2013), Article ID:41171,10 pages DOI:10.4236/ijg.2013.410132
Estimation of Wheat Area in Córdoba, Argentina, with Multitemporal NDVI Data of SPOT-Vegetation
Fac. de Ciencias Agropecuarias, Universidad Nacional de Córdoba, Córdoba, Argentina
Email: *delacasa@agro.unc.edu.ar
Copyright © 2013 A. C. de la Casa, G. G. Ovando. This is an open access article distributed under the Creative Commons Attribution License, which permits unrestricted use, distribution, and reproduction in any medium, provided the original work is properly cited. In accordance of the Creative Commons Attribution License all Copyrights © 2013 are reserved for SCIRP and the owner of the intellectual property A. C. de la Casa, G. G. Ovando. All Copyright © 2013 are guarded by law and by SCIRP as a guardian.
Received October 22, 2013; revised November 23, 2013; accepted December 12, 2013
Keywords: Wheat; Crop Area; NDVI; Classification Methods
ABSTRACT
Determining the area occupied by a crop is a prerequisite for estimating agricultural production in a region, and such information at present can be generated from satellite remote sensing systems. This study uses multitemporal NDVI images of SPOT-VEGETATION with a 1 km spatial resolution to estimate the wheat area in Córdoba Province, Argentina, and to assess 2 generic digital classification procedures based on crop phenological behavior. The Characteristic Phenology Behavior Method (CPBM) uses the contrast each year between typical values of NDVI variation in the wheat crop season and those of the area not occupied by active vegetation; while the other procedure, the Reference Curve Method (RCM), assesses the correspondence in each pixel between the observed sequence of NDVI from seeding to physiological maturity, compared with 4 curves of reference. The CPBM 2 procedure, which uses the amplitude of NDVI between sowing and heading (ampsh), produces estimates that correlate better with the observed record, with approximately 70% (P < 0.01) of seeding area variability explained by this model in Río Segundo Department, but systematically overestimates the state reports at about 5%. On the other hand, RCM using Curve 1 explains 50% (P < 0.05) of interannual variability of the crop area. Comparing CPBM 1 and CPBM 2 procedures, it was found that replacing ampsh in the model with the minimum NDVI during physiological maturity stage (minpm) produced a deterioration of estimation, with R2 reduced to 0.37 (P < 0.05). The validation test with records from Marcos Juárez Department confirmed the prior predictive behavior. In this case, CPBM 2 produced a R2 of 0.61 (P < 0.01) that, besides the problem of overestimation, presented the linear relationship between observed and estimated with a slope that did not approach 1. RCM classification models reach a predictive performance similar to that shown in Río Segundo, with R2 values close to 0.50 (P < 0.05).
1. Introduction
In a large part of Córdoba Province, dryland wheat production is marginal, characterized by low average yields and high harvesting uncertainty [1]. While wheat production faces poor agroclimatic conditions in Cordoba, particularly because of lack of water availability and also frost damage [2,3], the great increase of the soybean area in recent years has become the main threat to the sustainability of farming systems because of a negative carbon balance (organic matter) and lower soil water availability. Thus, the inclusion of wheat in crop rotations has been proved to be a necessary and advantageous practice for agriculture in the region.
In order to estimate agricultural production in a region, it is necessary, on the one hand, to establish the area occupied by each crop and, on the other hand, to know the productivity achieved. Classical surveying methods are very expensive and time-consuming [4]. Using of radiometric data produced by remote sensing of the Earth has been developed as a promising solution to overcome these limitations [5].
At a crop canopy level, reflectance changes during the growing season are greater in near infrared (NIR) wavelengths due to the increase of biomass causing its dispersion, while the visible fraction (V) spectrum shows a minor but significant variation during the season, related to light absorption by the photosynthetic and photoprotection pigments [6,7]. The sharp contrast of reflectivity between the V and NIR of a surface covered by active vegetation is not present in bare soil or when vegetation is not active. This signal is used to differentiate the two basic components of an agricultural scene, soil or crop, by a vegetation index (VI), such as the Normalized Difference Vegetation Index (NDVI), which integrates both V and NIR data.
Classification methods discriminate various items of interest exploiting the territorial variability of a scene, i.e., emphasizing the spatial or geographical dimension of the radiometric data, but also can take advantage of differences in radiometric behavior throughout the cycle according to the phenological development of each crop, giving particular importance in this case to the temporal dimension of the records and their phenology particularly [8].
The spatial resolution of the radiometric data is another important factor to consider in discriminating the different cover of a scene. Traditionally, Landsat TM data have been used to classify and map crops because of its higher spatial resolution (30 m), but its use is limited due to low revisit frequency and the high volume of data, which makes it difficult to implement a crop monitoring system [9]. For this reason, crop classification using Landsat data has been restricted to solving problems at local or sub-scene level [10]. These difficulties have encouraged the use of high temporal resolution images, despite their lower spatial resolution, to characterize and identify crops. There is extensive literature using Advanced Very High Resolution Radiometer (AVHRR) time series, with a resolution greater than 1000 m, for this purpose [11,12].
In recent years, from the availability of Moderate Resolution Imaging Spectroradiometer (MODIS) images opened up the possibility of using this information that made a balance between spatial (250 m) and temporal (16-day composite images) resolution of the data [13]. Reference [14] used this to determine corn and soybeans areas in the USA, and validated their results using 2002 data from the United States Department of Agriculture-National Agricultural Statistics Service (USDA-NASS) at national, state and county scale. While they obtained results that highly matched the information used as reference, by restricting the analysis to a single production season, the predictive behavior that may occur under different climate scenarios remained an open question, to be overcome by the use of more extended time series. Also, [15] used MODIS Enhanced Vegetation Index (EVI) images to estimate the area occupied by wheat in Santa Fe Province, Argentina, and validated their results using Landsat data. In this case, the analysis is restricted to a single year, too.
Reference [16] used time series consisting of 10-day MVC-NDVI images from SPOT VGT between 1998 and 2008, covering large parts of South America at 1 km spatial resolution. Filtered time series of vegetation indices were used for studying vegetation dynamics at a continental scale. Reference [17] used 10 days of temporal resolution SPOT-Vegetation NDVI data to develop a method for identifying and describing areas with different vegetation cover types and agricultural areas that followed different crop calendars in India. Reference [18] generated NDVI profiles from nine scenes of SPOT/ HRV to characterize seasonal trends in six cropping systems in Japan. Reference [19] used four LANDSAT TM NDVI images acquired in spring, early summer, late summer and early fall in 1996-1997 to classify land cover types in the south-western Argentine Pampas.
The aim of this work is to develop a methodological and operational framework for estimating wheat area in Cordoba Province, Argentina, using NDVI time series of coarser spatial resolution (1 km). The development and evaluation of two generic classification procedures are presented, with different variants of calculation in each case, to estimate the crop area. This provides an alternative to the routine procedure implemented by the Agriculture Ministry of Córdoba Province to estimate the production of major crops by using field surveys. In this sense, the development of an agricultural forecasting system from satellite data would serve, first in an exploratory stage and then in an operational context, as an independent control element to verify the data that emerge from field survey.
2. Materials and Methods
2.1. Site Description
As shown in Wheat Regions of Argentina (Figure 1), Northern Regions II and V, and to a lesser extent Southern Regions I and V, converge in Córdoba Province, and have different environmental conditions in both climate and soil. While atmospheric water demand for wheat is reduced during the winter season, there is a water balance deficit due to the low rainfall in the region, aggravated to a greater or lesser extent by the different waterholding capacity of soils. This limitation becomes gradually more pronounced from the more favorable climate in the East (Region II North), to the more restricted conditions in the centre of the Province (Region V North). The risk is reduced in the eastern sector of Córdoba Province (Marcos Juárez Department), which is more likely to receive a significant amount of rain during the wheat season, so that the initial water reserve is less crucial to reach the minimum consumption required to produce yield [20]. The opposite occurs in the central region of the province, where the risk increases because seasonal rainfall in terms of its total amount or its distribution
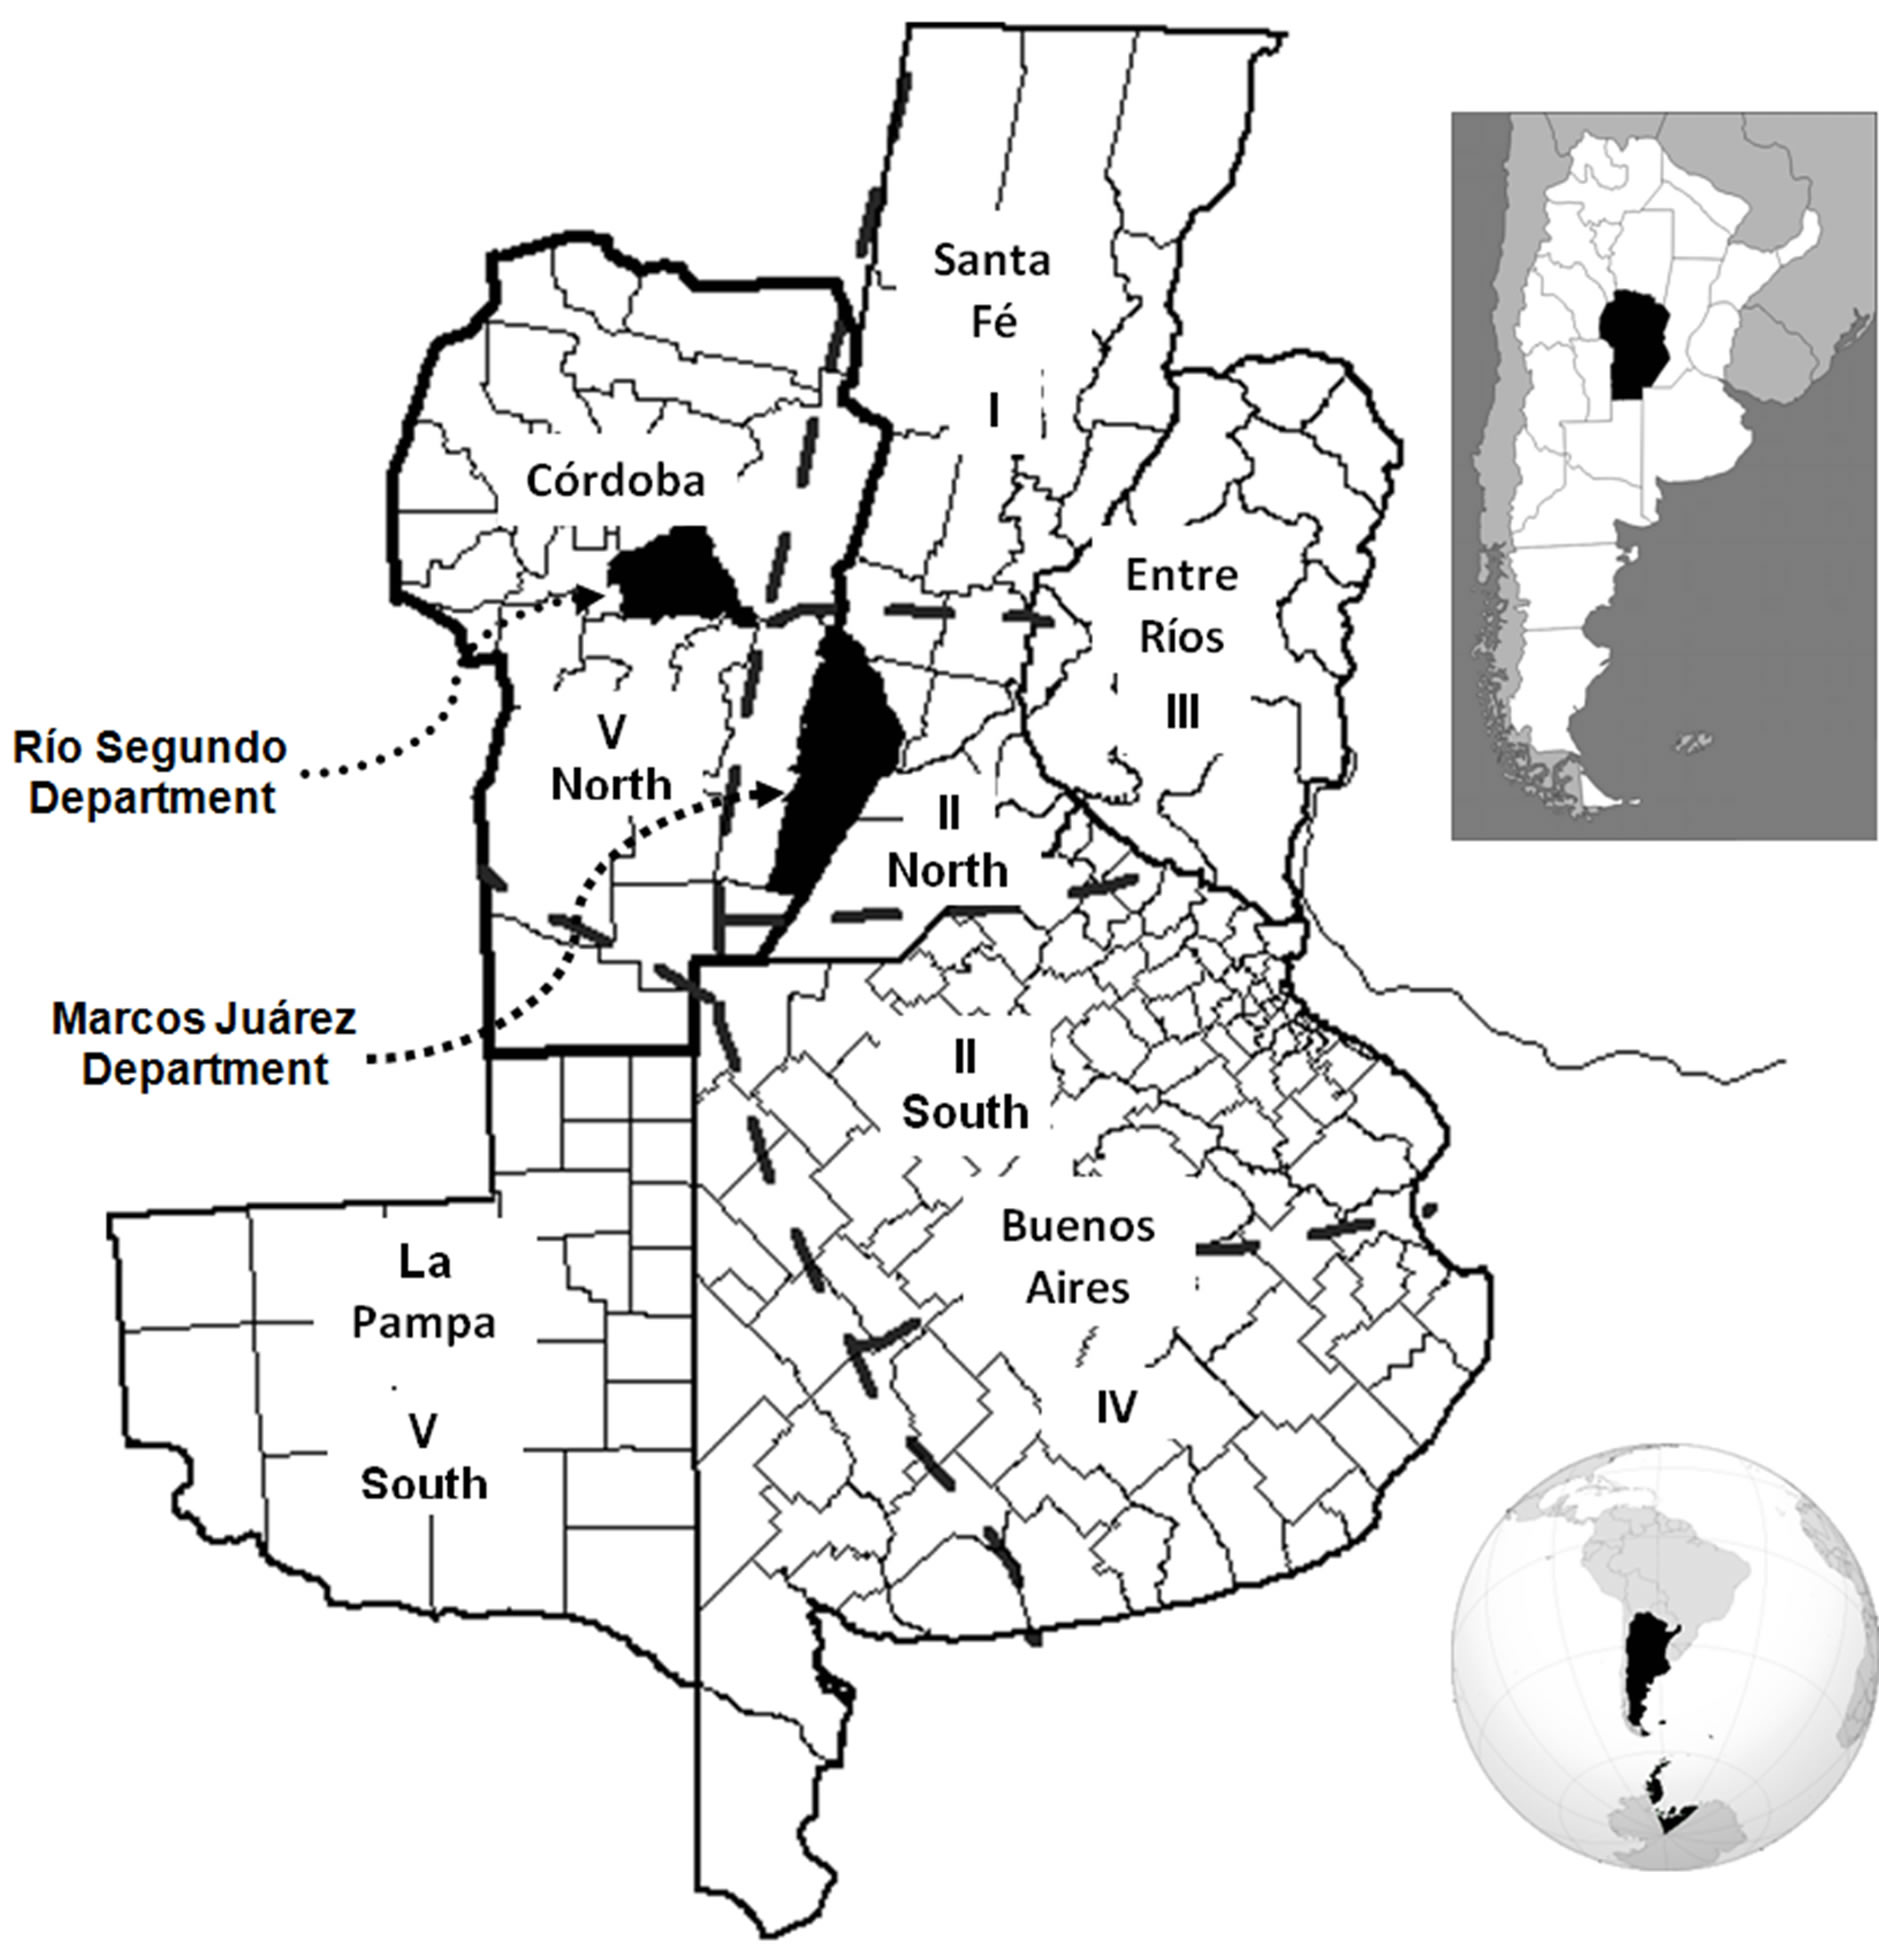
Figure 1. Wheat production regions in Argentina.
is generally inadequate and, consequently, the initial reserve of water becomes critical to obtaining a reasonable yield [1].
The previous stochastic analysis is also supported by experimental evidence that shows the influence of water availability in different parts of the Province, both at planting and during the cycle, on wheat productivity [21], particularly at the reproductive stage [3].
2.2. NDVI Data
The determination of the area occupied with wheat was conducted using data of the Normalized Difference Vegetation Index (NDVI) from the SPOT-VEGETATION satellite, provided by the Vegetation image processing centre (CTIV) of the Flemish Institute for Technological Research (VITO). The NDVI is a dimensionless index that expresses the presence and density of vegetation, and is calculated according to the following equation:
 (1)
(1)
Here ρr and ρnir are reflectance values corresponding to red and near-infrared wavelengths, respectively.
The S10 NDVI SPOT-VEGETATION was used in this work. This product is composed over 10 days using the Maximum Composite Value (MCV) algorithm. The data contains only NDVI values, i.e. it does not have the original spectral bands, or the viewing and solar angles. The spatial resolution is 1 km and the images are radiometric and geometrically corrected, and are available for the entire series of 10-day images from April 1998 until December 2009, for the geographical territory of Argentina.
Through VGTExtract software [22], original images were converted to Integrated Land and Water Information System (ILWIS Open 3.8) format, which was the software used for processing. The analysis was made at political boundary level, taking the delimitation of the department administrative units from a vector map of Córdoba Province, to define areas of interest (Figure 1).
2.3. Crop Cycle
In tests conducted at the Agricultural Experimental Station INTA Marcos Juarez, which coordinates wheat Sub regions I, II North, III and V North, and assists in the Sub region II North, wheat cultivars are classified according to the crop cycle length as long, intermediate and short, with the dates of sowing, heading and physiological maturity, as shown in Table 1 [23-25].
Table 1 shows that the most common sowing date of cultivars in the region ranges from the second half of May to first fortnight of July, depending on the cycle length, so that the period between May and June includes almost all sowing dates in the Province. Meanwhile, due to the photoperiodism behavior of this long-day species, heading tends to occur from late September through October, with some independence of the planting date [3]. Similarly, all varieties reach physiological maturity in November, as seen in Table 1.
In summer there is a greater diversity of crops in the region, but wheat is the dominant crop during winter, so that the growth dynamics of the NDVI curve are assumed to represent only this crop. Figure 2 shows the variation in wheat area and that of other alternate winter crops (oats, malting barley and rye) harvested in Cordoba Province in recent years. The annual oscillation of the area under wheat production is very noticeable, as well as the marked decrease in wheat area in 2009 as a result of an intense and prolonged drought in the region. Alternative
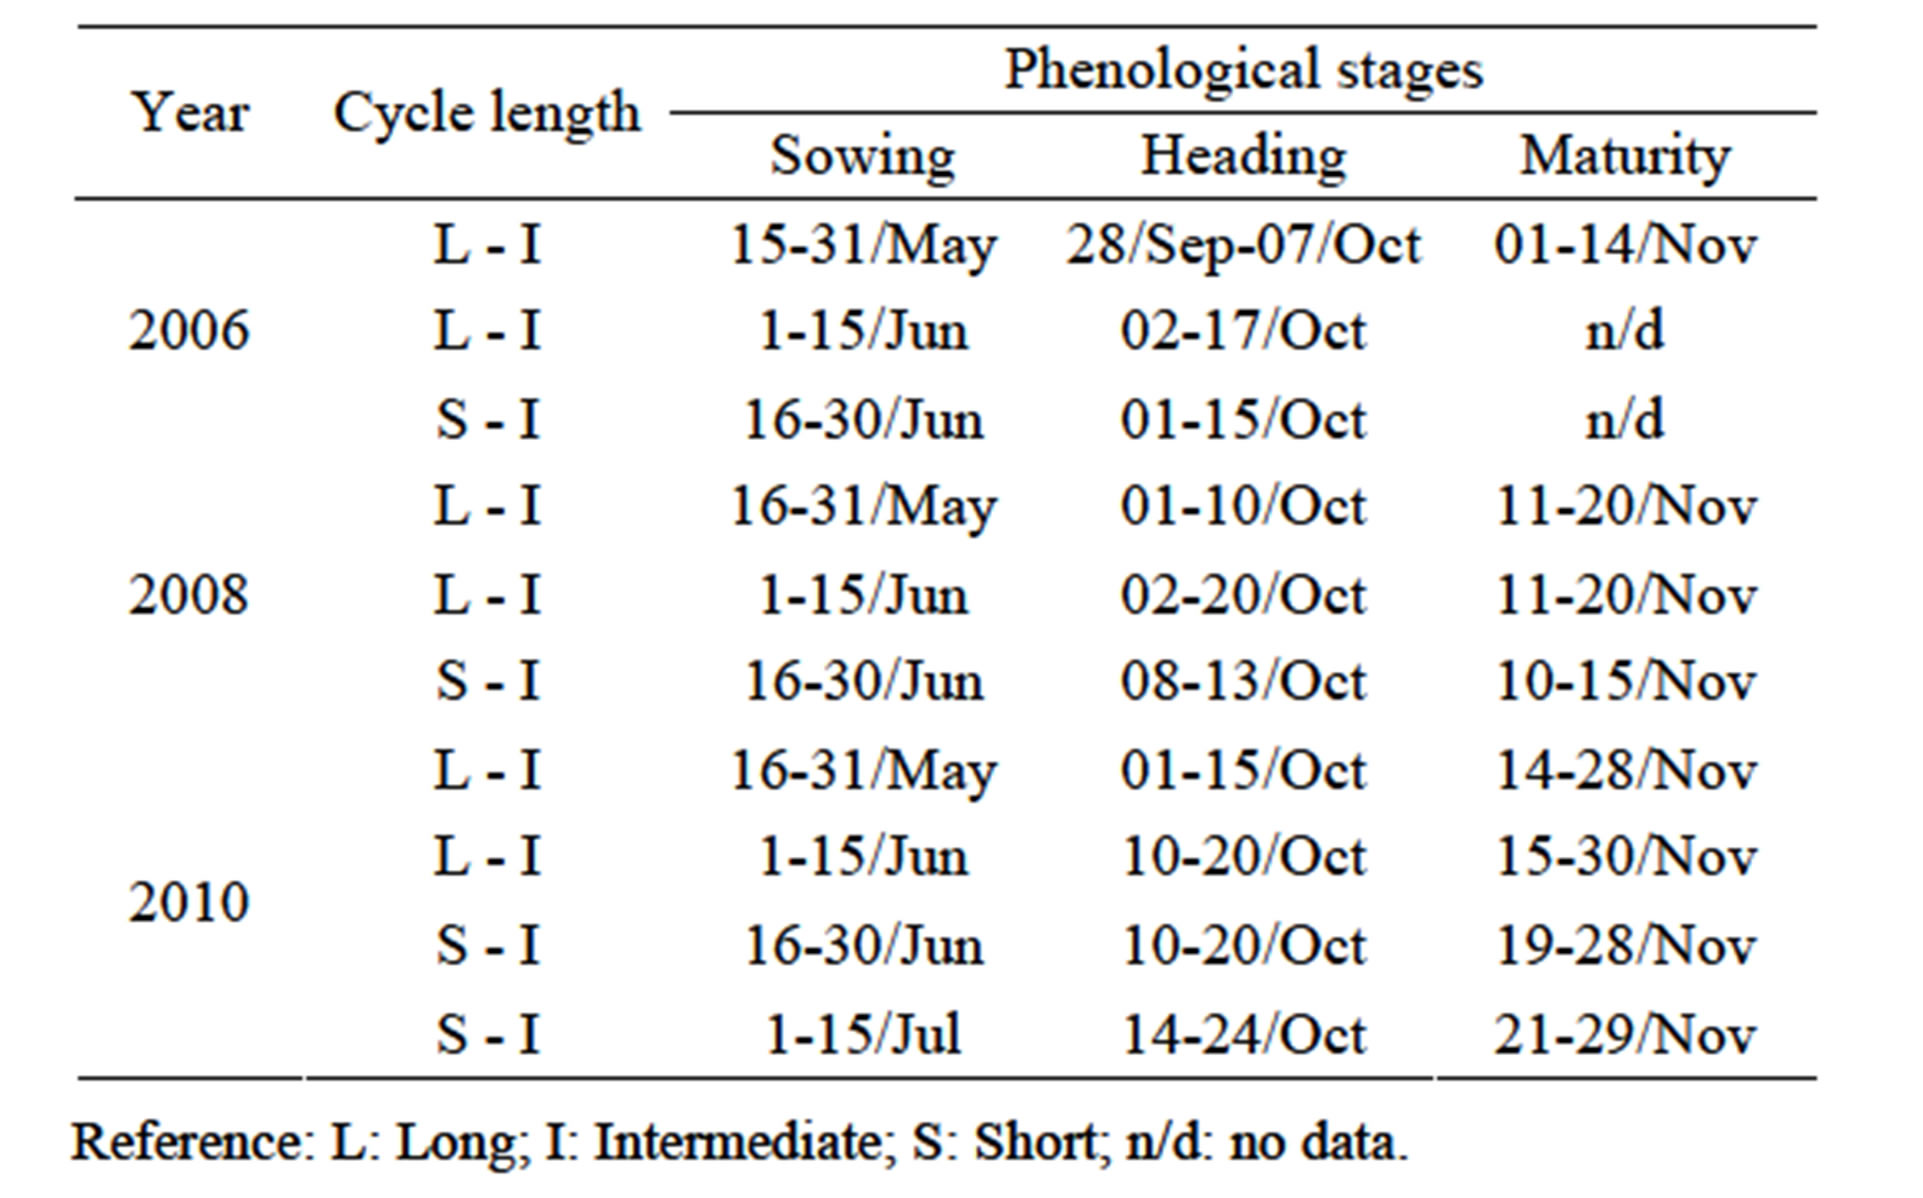
Table 1. Phenological stages observed in different years for wheat cultivars grouped according to the cycle length, when tested in Marcos Juarez INTA [23-25].
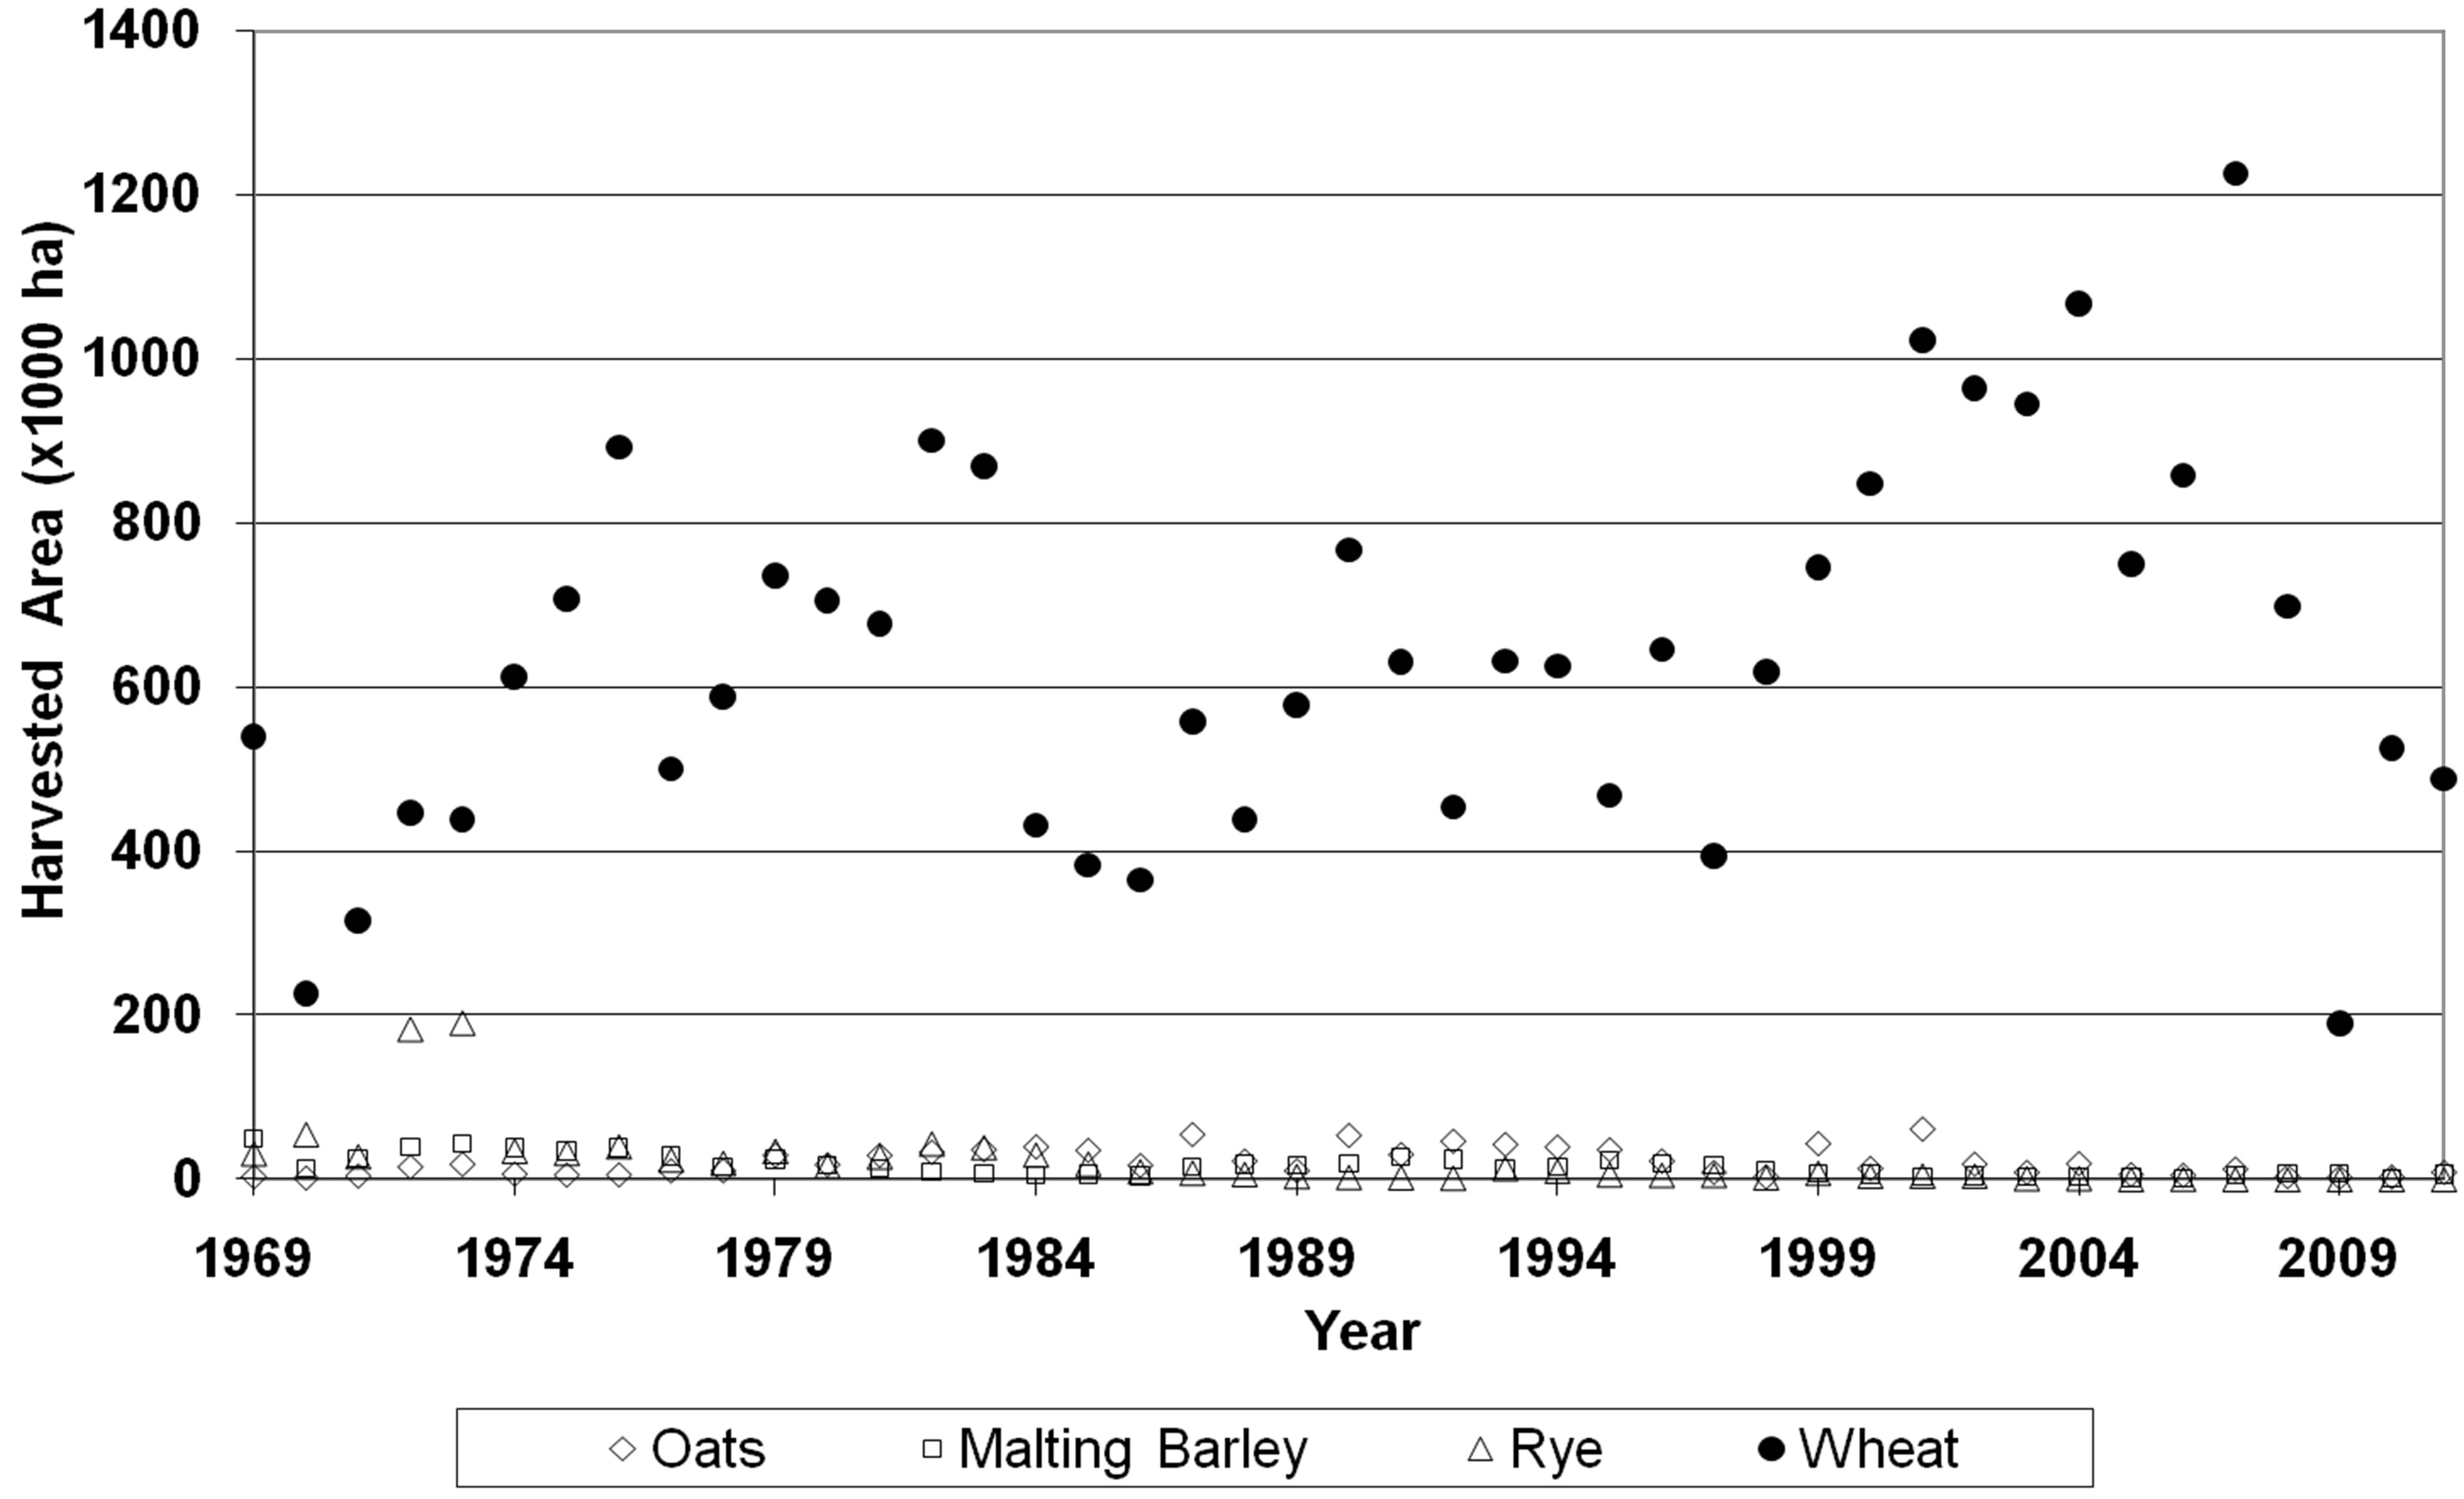
Figure 2. Harvested area with different winter crops in Cordoba Province, Argentina, between 1969 and 2011.
winter grain production is relatively very small in this region during the period studied. Official data [26] shows that the ratio of harvested area of other winter cereals with respect to wheat was below 5% for all years between 2005 and 2011. Thus the proposed procedures predominantly classified areas occupied with wheat
2.4. Methods for Estimating Wheat Area
To estimate yearly wheat area, the NDVI temporal profile of each pixel was compared with the relevant phenological changes during the wheat growing cycle. The classification was made with two unsupervised procedures. In both cases, the main stages of wheat development were adopted following to the information in Table 1, assuming that this adequately represents the diversity of wheat genotypes growing in the region.
2.4.1. Characteristic Phenology Behavior Method (CPBM)
Following a decision tree approach, this procedure considers that wheat can be identified by exploiting the contrast between typical values of NDVI variation throughout the cycle with respect to the area not occupied by active vegetation. The model rules consist of if-then conditional statements that specific input data are passed through to arrive at a pixel wheat prediction [27]. The sowing period necessarily represents a minimum in the NDVI curve (mins), and following Table 1, a probable window for the temporal location was established of two months from May to June. Then, as the wheat cycle progresses, a maximum value of NDVI (maxh) should appear during the full coverage period corresponding to the heading stage of this crop. This was considered more likely to occur during September-October. Subsequently, the variation of the NDVI curve should show a decrease related to the senescence and physiological maturity process, reaching a new minimum at the end of the cycle. November was set as a window for determining the minimum end-of-cycle NDVI value (minpm). Finally, the amplitude (ampsh) was also considered, determined by the difference between the maximum (heading stage) and minimum (sowing), typical of a normal plant growth process. After obtaining the mean values of mins (m_mins), maxh (m_maxh), minpm (m_minpm) and ampsh (m_ampsh) for all pixels of interest, the area (pixels) occupied by wheat was determined from a multiplicative scheme, with three different models of evaluation, as seen in Figure 3.
2.4.2. Reference Curve Method (RCM)
This procedure analyze the correspondence at each pixel between the observed sequence of NDVI data from planting to physiological maturity, compared to a continuous curve that was set with m_mins, m_maxh and m_minpm values. Four reference curves (designated in ascending order) where evaluated, which to simplify calculations, were formed by integrating 4 sections, as shown in Figure 4. The first, common to all curves, includes a 50-day period from May 1st, and is a constant value for each year and territory, obtained from minimum NDVI values. The constant value was calculated subtracting a standard deviation (sd_mins) from the territorial minimum average value (m_mins). The third section of the curve also had constant values (plateau) for 40 days, and was obtained from maximum NDVI values from September 1st. The constant value was calculated
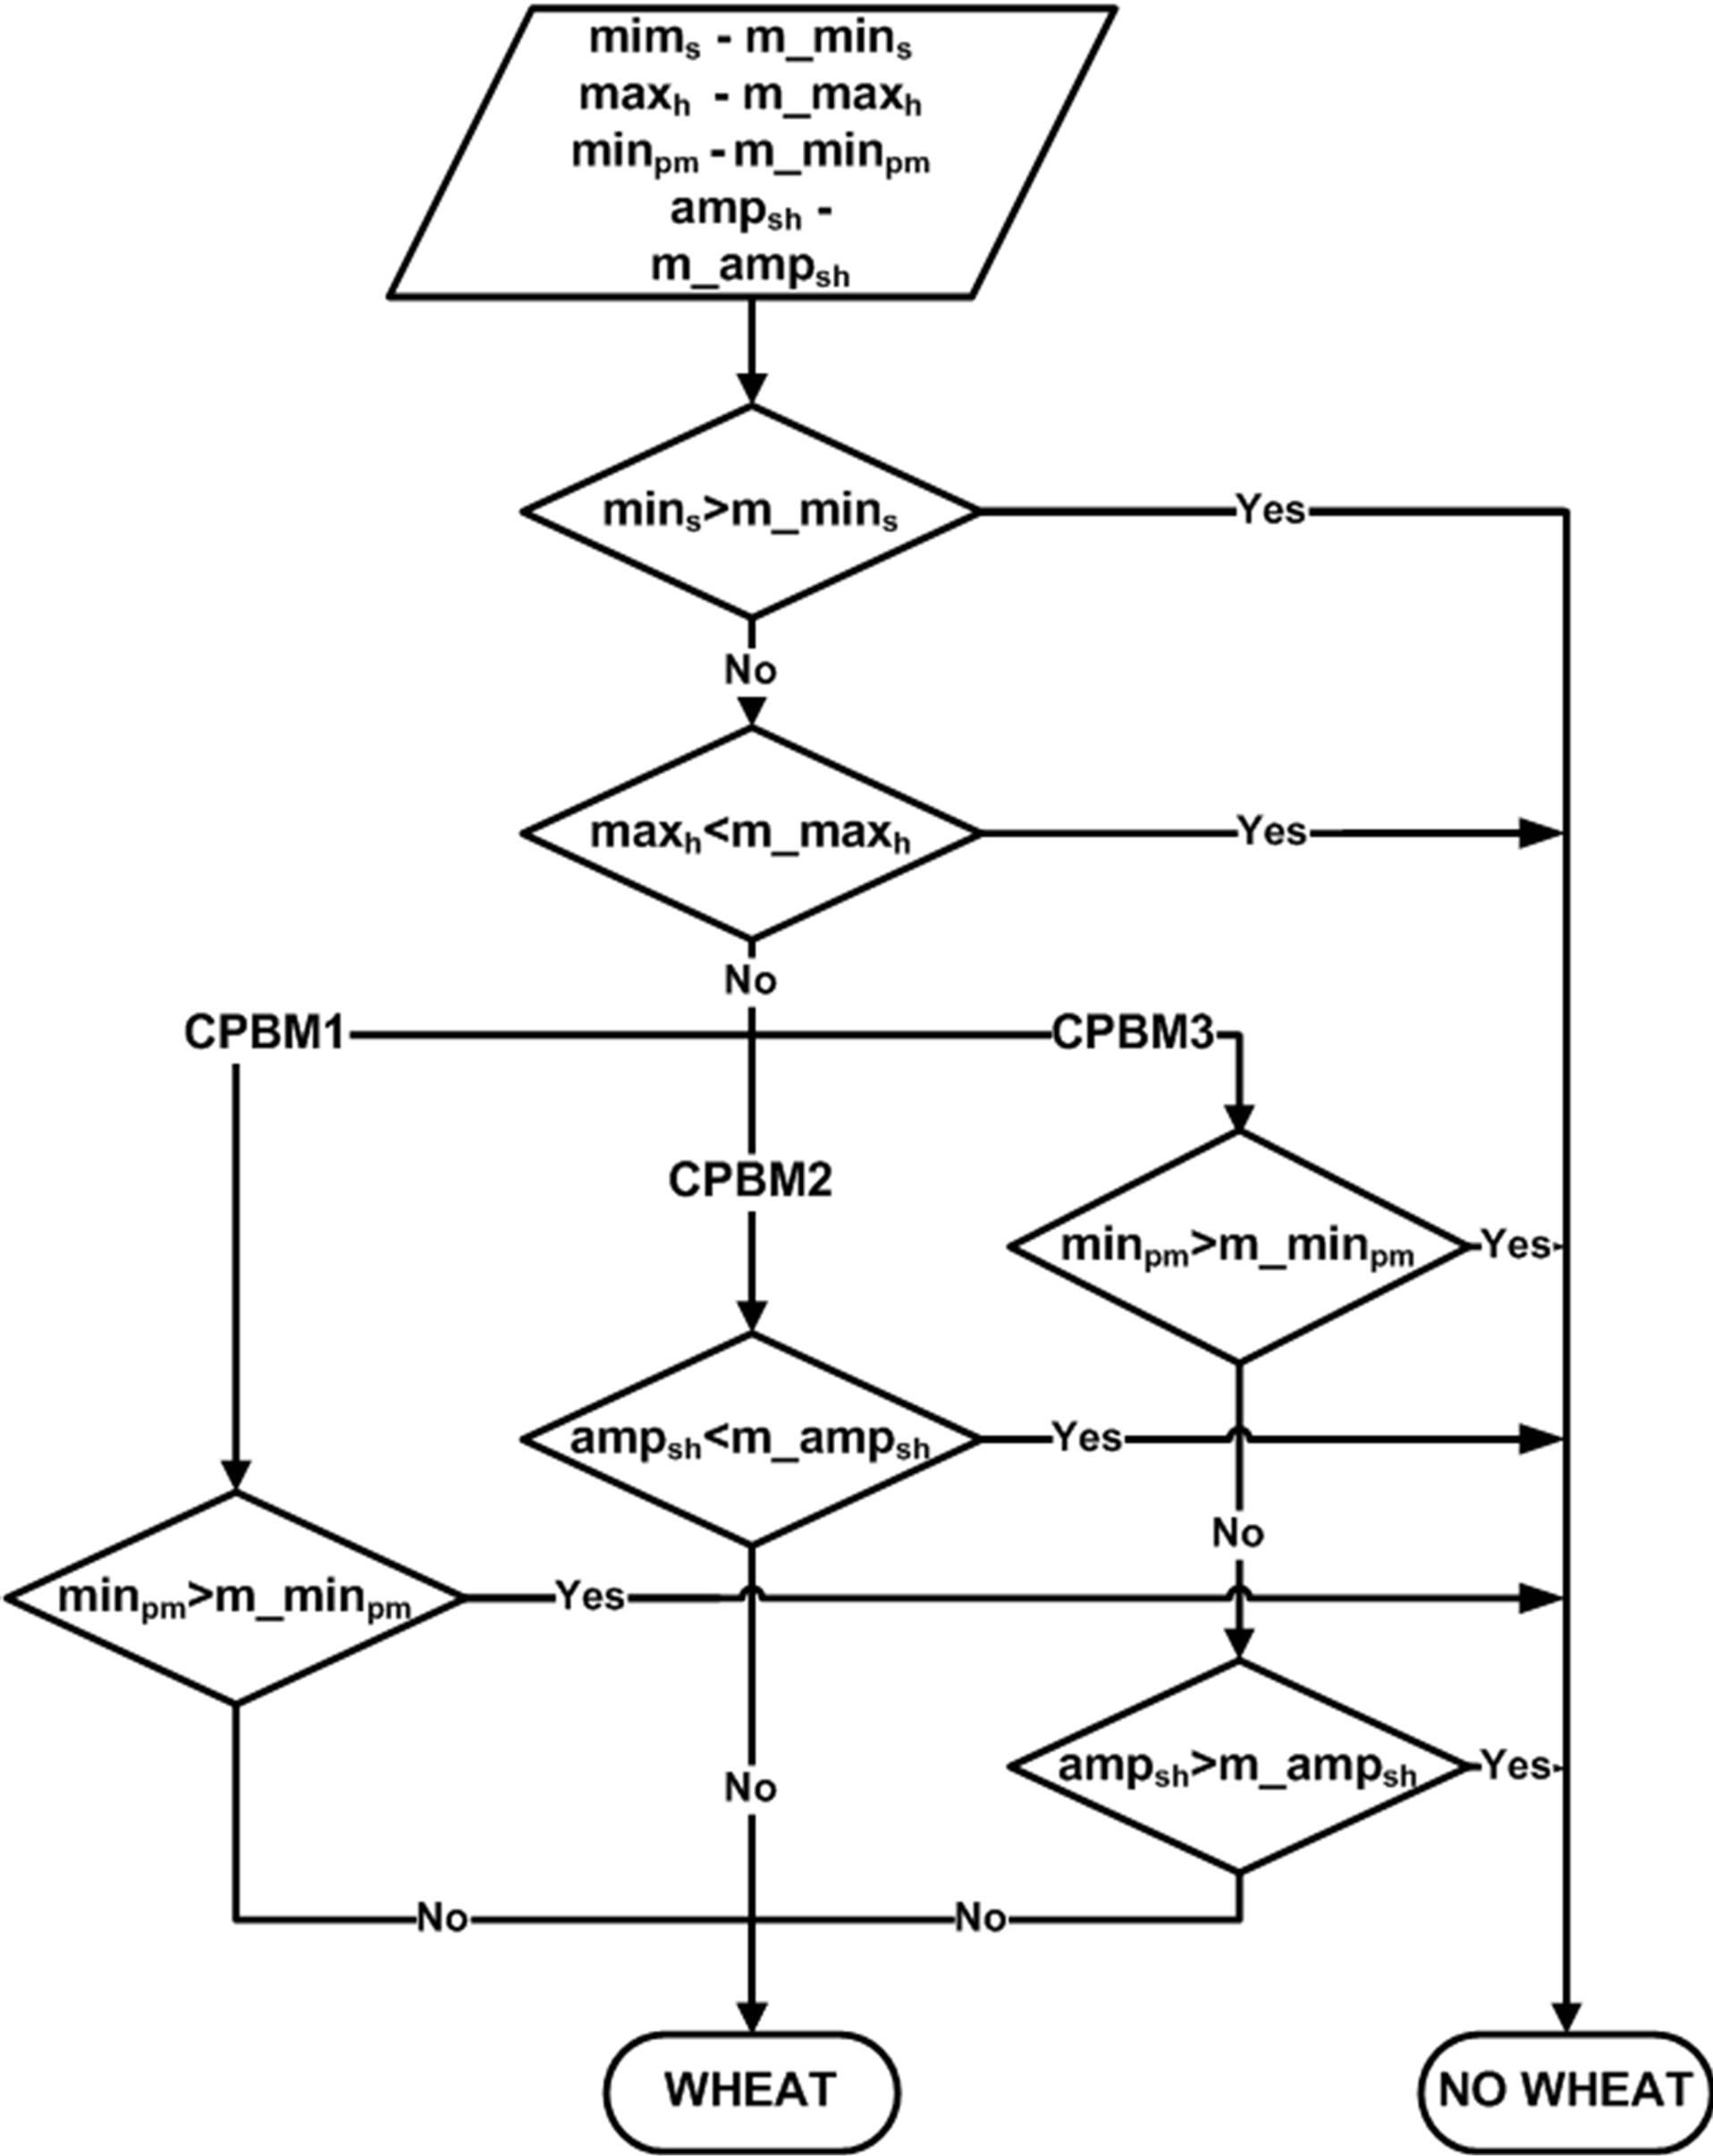
Figure 3. Flow diagram of Characteristic Phenology Behavior Methods (CPBM).
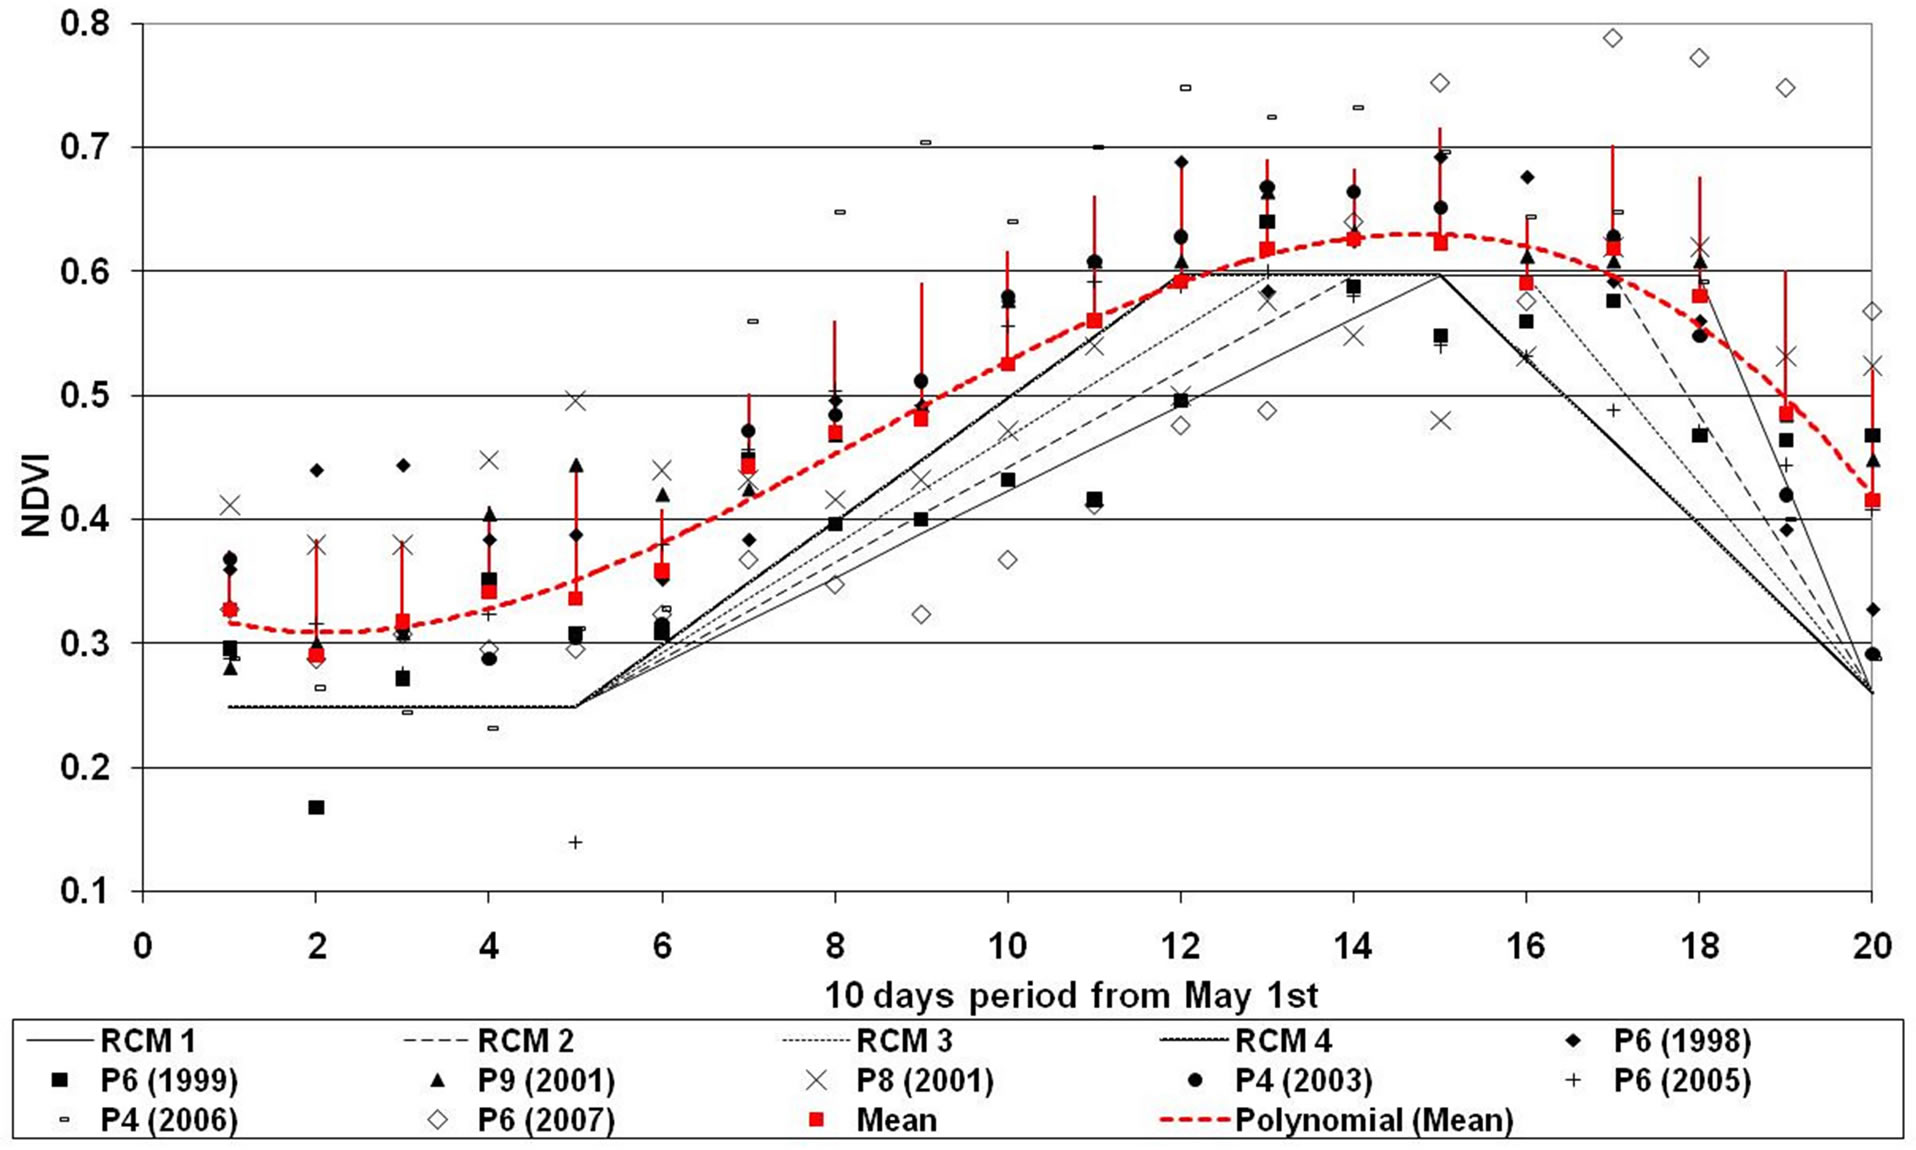
Figure 4. NDVI profiles used by the Reference Curve Method (RCM) for identify the pixels with wheat in 2010. NDVI profiles observed in irrigated wheat plots (P) in different years are overlapping, as well as the average value of the set (the bar indicates the standard deviation) and also a polynomial curve fitting.
adding a standard deviation (sd_maxh) to the territorial maximum average value (m_maxh).
Between the first and third sections, the method considers a linear growth rate that, depending on the curve selected, determines an earlier or later plateau stage. Finally, the 4th section considers a decreasing linear rate between the value of the 3rd section and a regional average of the minimum values for the month of November (m_minpm) subtracting a standard deviation (sd_minpm), and may be a little longer depending on the reference curve considered. Figure 4 shows the 4 curves obtained from RCM in 2010.
The first section of the NDVI curve corresponds to a background NDVI value for fallow (field crops). In Figure 4 this value is 0.25, similar to the 0.20 proposed by [28] for most field crops and nut trees. Also shown in Figure 4, the NDVI profiles observed were obtained in irrigated wheat plots for different years during the study period, which explains the slightly higher values compared to the 2010 theoretical NDVI profile. Based on average values of all plots for each 10-day period a polynomial function was fitted to give continuity to the records. The observed curve has a temporal development, beyond its absolute value, that validates the phenological information used to develop classification models, such as the initial establishment period and the plateau stage, which were established at about 50 and 40 days, respecttively.
To establish the wheat area, each pixel was evaluated by correlation and regression between the reference curve and NDVI values, considering two indicators for selection, the coefficient of determination and the slope of the linear relationship. Wheat corresponds only to pixels with both values greater than 0.5. As a test, thresholds of 0.4 and 0.6 were also evaluated for the classification.
2.5. Evaluation and Validation
The predictive behavior of the proposed procedures was evaluated using crop statistics compiled and published by the Agriculture Ministry of Córdoba Province [29] as field information. Data from Río Segundo Department (Region V North) were used to evaluate the procedures and verification was then performed with data of Marcos Juárez Department (Region II North).
3. Results and Discussion
Figure 5(a) shows that, for most years, calculated values correlated well with the wheat area estimated by the Ministry of Agriculture, with greater or lesser accuracy according to each procedure. However, for some procedures in 2007, the difference between the estimates of both sources is very large. Nevertheless, the figure shows that there is no appreciable increase in the wheat surface over time, which supports the use of Root Mean Square Error (RMSE) for comparative purposes. Figure 5(b) shows the difference obtained each year between the percentage wheat area values reported and those estimated using the different options proposed for Río Segundo Department.
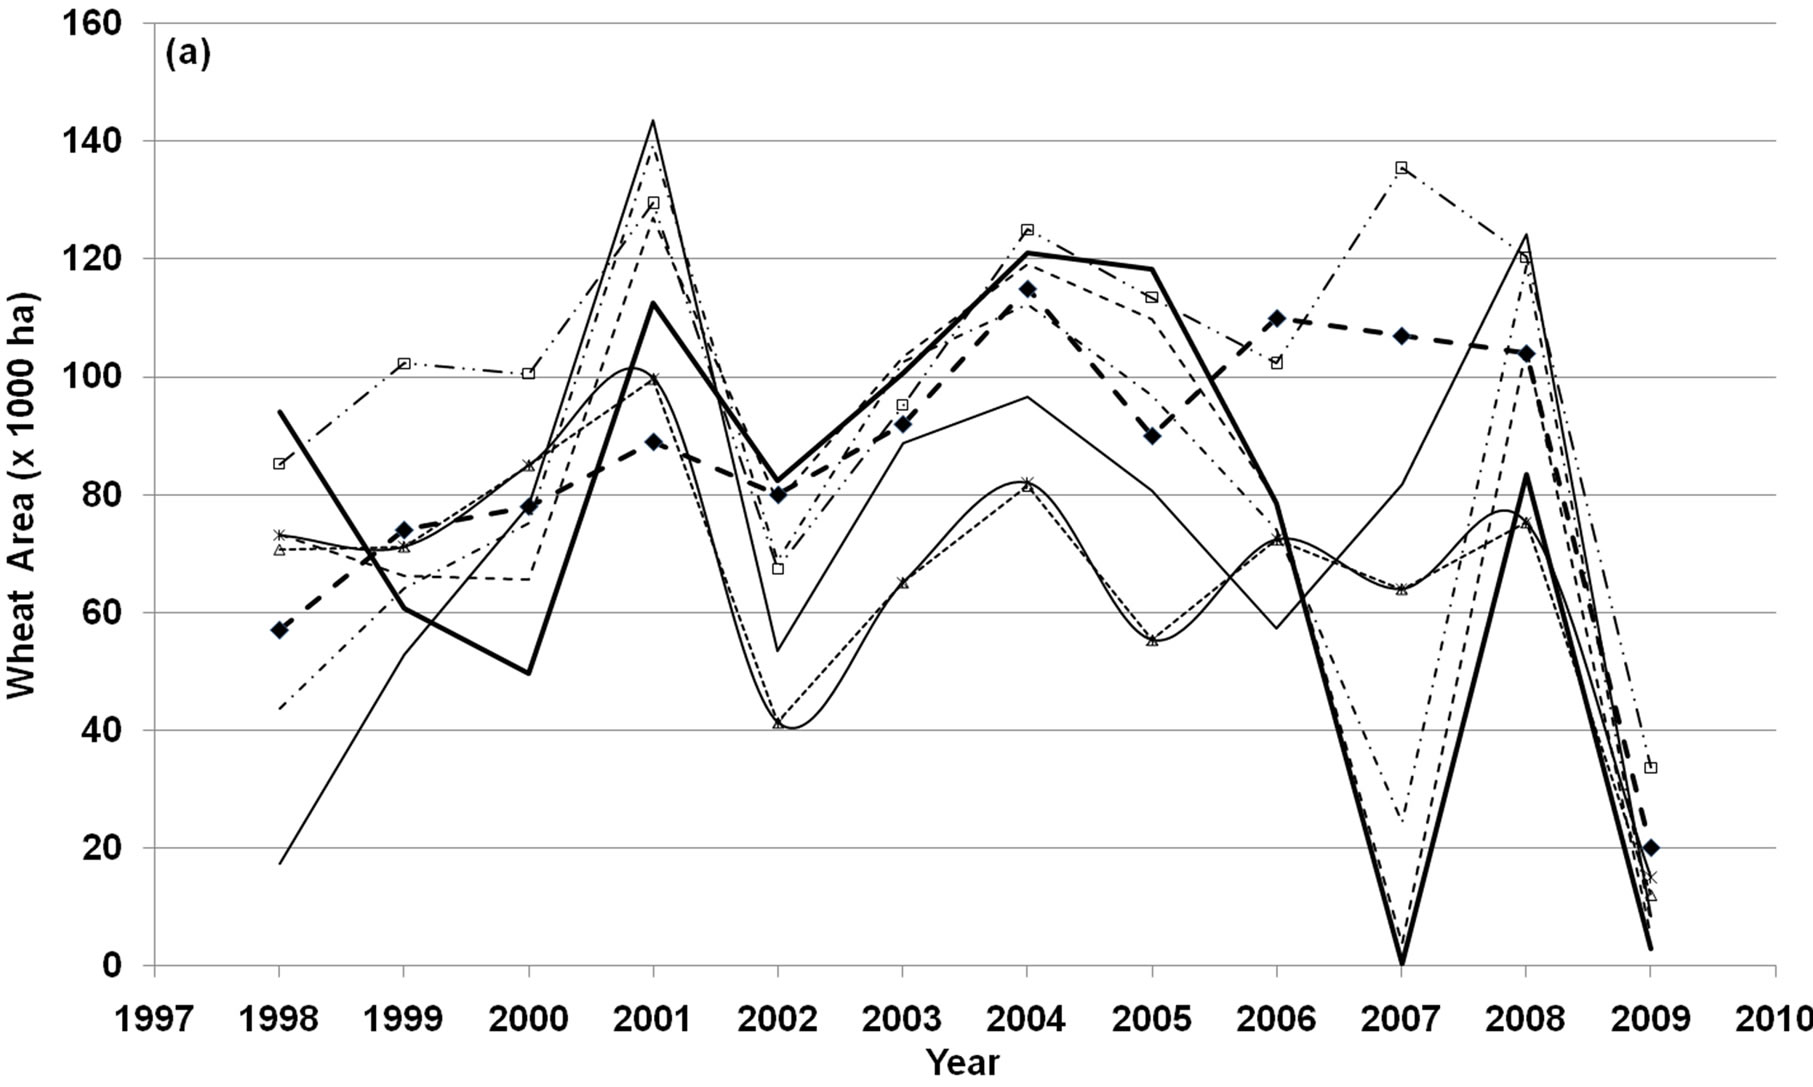
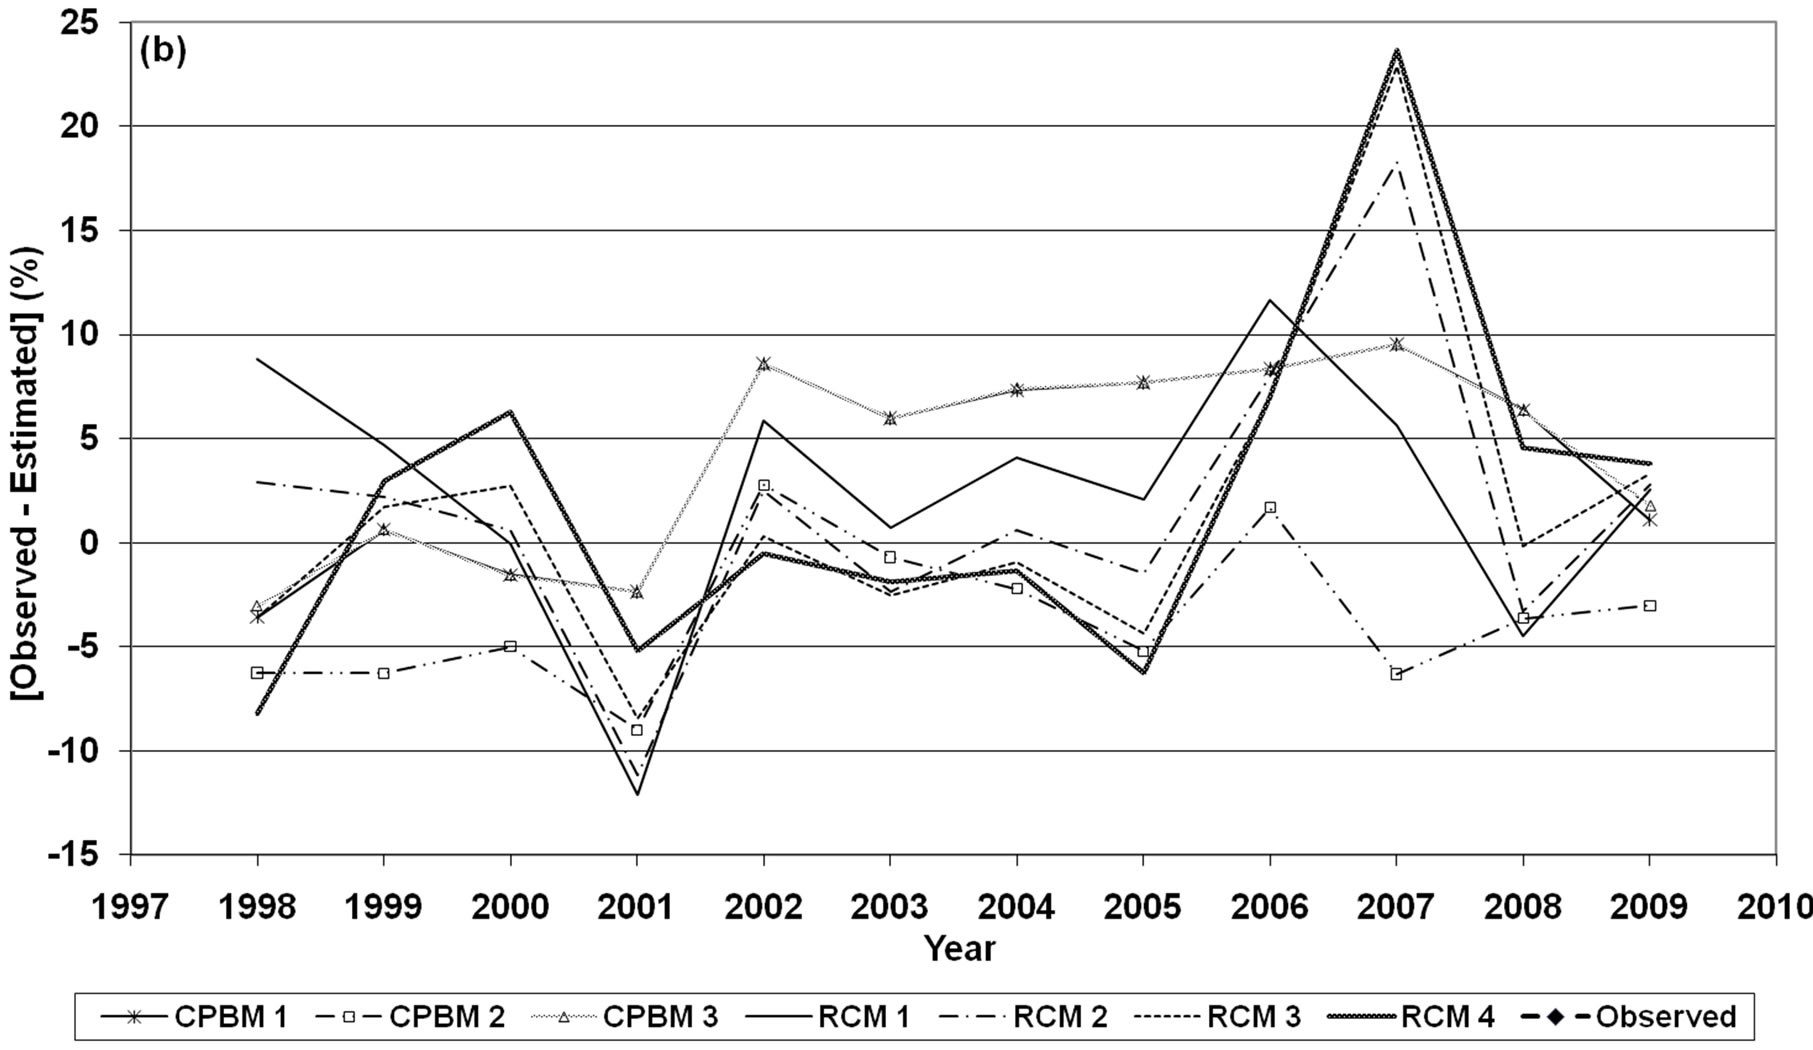
Figure 5. (a) Observed wheat area (Agriculture Ministry of Córdoba Province, Argentina) and estimated by the classification models in Río Segundo Department, of Córdoba, Argentina, between 1998 and 2009. (b) Percentage difference between the wheat planting area reported each year and the estimated values with the different classification methods (Characteristic Phenology Behavior Method (CPBM) and the Reference Curve Method (RCM)).
To enable direct comparison, the planting area that the state office obtains by system surveys and field survey information, and the determinations of each computational procedure, were both expressed relative to the departmental area, so that the difference or residue between the two is a measure of the error. With the exception of 2007, the percentage error in absolute terms of the set of computational procedures is within a range of +/−10%, while the average residual values, as shown in Table 2, range between −3% and 4%, while RMSE has values of between 5% and 8% for the different estimation methods.
Similarly to this study, [5] compared remote sensing (RS)-based wheat acreage with Department of Agriculture (DOA) estimates by computing percent relative deviation, and found good agreement between real time data and RS-based estimates, with percent relative deviation below 10%, as in our study.
Reference [30] classified different crops using SPOT4 XS (20 m) and SPOT5 XS (10 m), and the producer and user accuracies for wheat were 79.8% and 97.4% respectively for SPOT4, and 86.1%; and 97.2% for SPOT5. Guerschman et al. (2003) obtained producer accuracies between 79% and 86%, and user accuracies from 75 to 79% when classifying wheat in Argentinean pampas with LANDSAT images. In both cases the procedures used higher spatial resolution imagery, compared to the coarser 1000 m SPOT-Vegetation.
Although the predictive performance of the classification methods can be broadly described as acceptable, there are interesting differences between the various procedures. Procedures CPBM 1 and 3 produce very similar estimates of wheat area, so that the incorporation of amplitude (ampsh) in model CPBM 3 appears to have no additional effect on model CPBM 1. Model CPBM 2 considers ampsh instead of minpm, resulting in an increase of estimated cropped area. In fact, slight differences were determined between observed and estimated values produced by both CPBM 1 and CPBM 3, as shown in Fig-
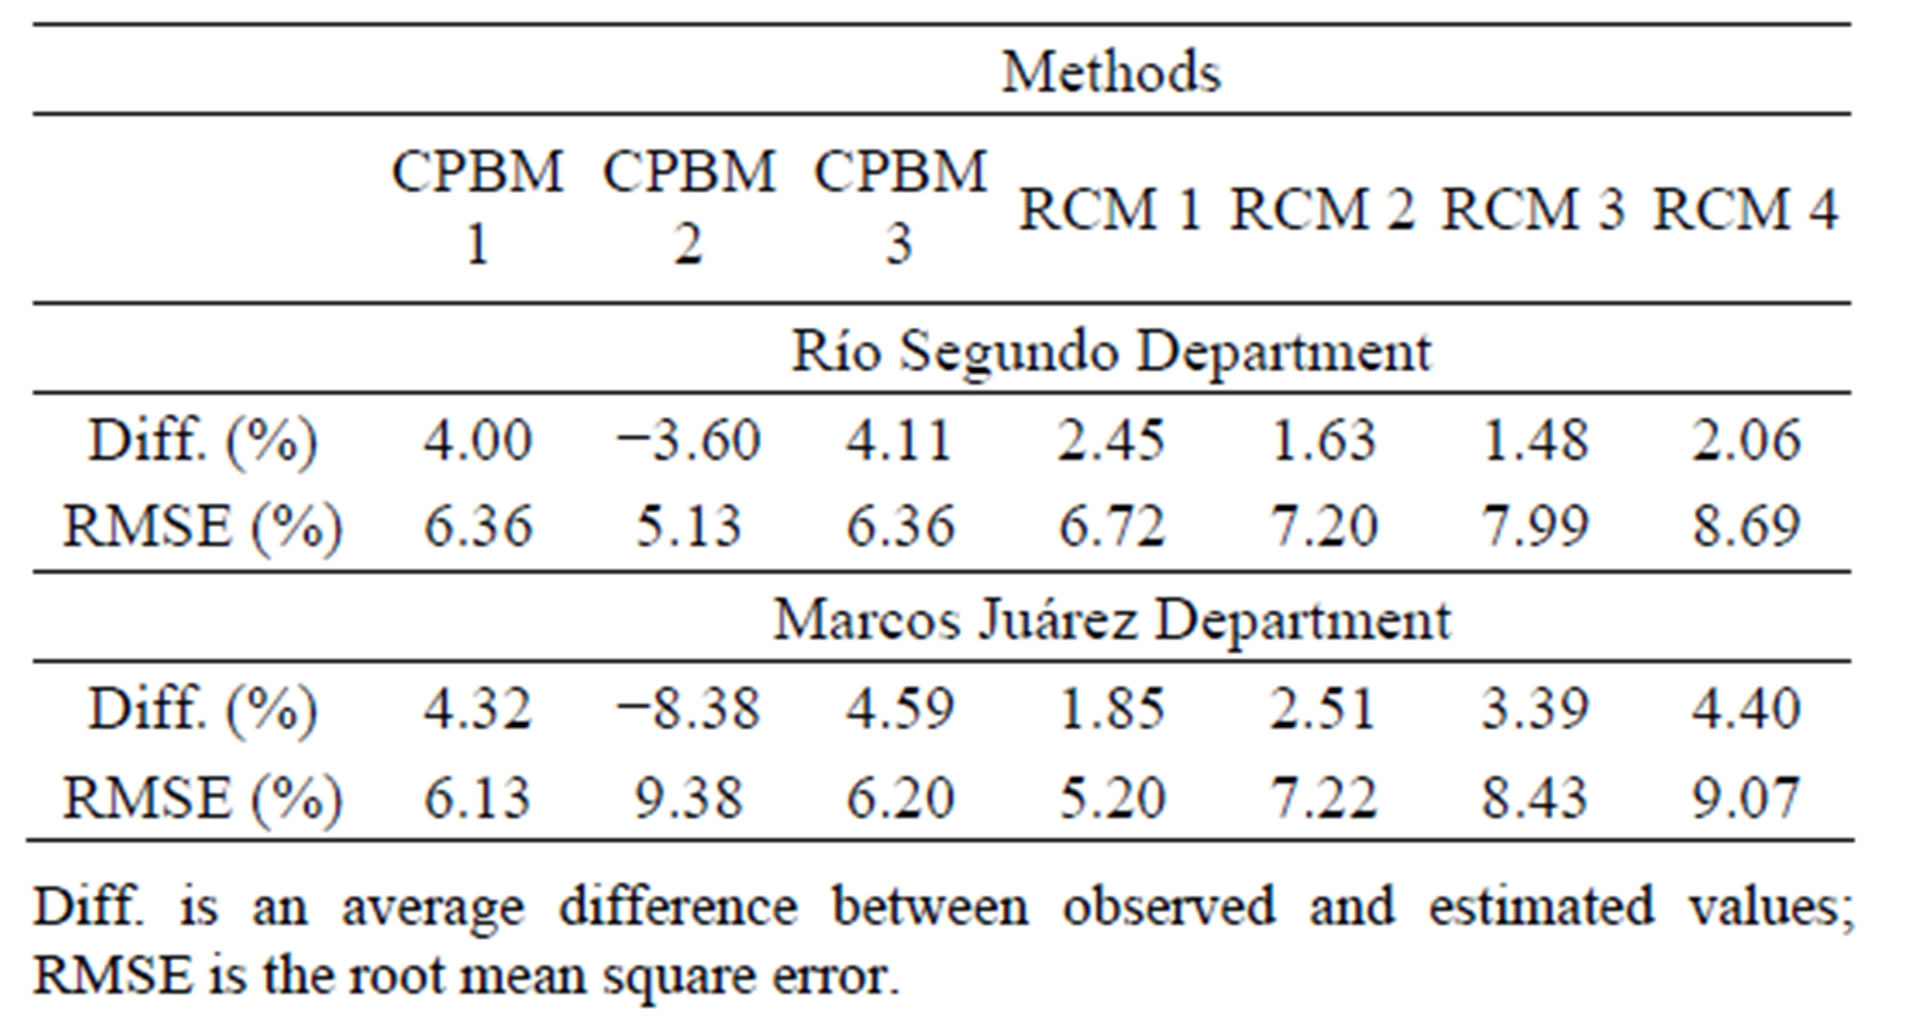
Table 2. Percentage error committed by the different methods of classification of the wheat area: Characteristic Phenology Behavior Method (CPBM) and the Reference Curve Method (RCM), both in Río Segundo and Marcos Juárez Departments of Cordoba Province, Argentina.
ure 5(b), and the same behavior is observed in the error measures in Table 2, which are practically identical, so that including amplitude (amphs) in the conditional model offers no predictive advantage. Thus, while CPBM 3 incorporates more information, CPBM 2, by excluding minpm performs better in Río Segundo Department. However, in Marcos Juárez Department RMSE was 9.38%, and the systematic tendency is to overestimate the sowing area.
Methods using the reference curve (RCM) produced higher RMSE values in general, implying lower accuracy (Table 2). However, these methods perform well in most years, despite produced pronounced overestimation and underestimation in the years 2001 and 2007, respectively. Only gradual differences arise between the curves, as they pass from Curve 1 to 4, advancing through of the plateau phase (3) and prolonging the final stage (4) of the cycle. Their predictive behavior is distorted apparently in that order, with an error increasing from Curve 1 to 4 (Figure 4).
Another option for comparing the predictive performance of these methods is correlation and linear regression between the planting area reported by the state office (which, for that reason, has the character of observed) and the estimates produced by the different methods, as shown in Figure 6. To simplify the analysis, these results are presented separately according to the generic method used. The results in Figure 6 support the previous impression of the strong tendency of all the procedures together to produce estimates around the identity line. Among classification procedures, CPBM 2 estimates show higher correlation with observed data, with approximately 70% (P < 0.01) of annual wheat area variability explained by this model, although, as seen in Figure 6, its estimates are systematically about 5% higher than the state office reports.
Comparing procedures CPBM 1 and CPBM 2 shows that the replacement of ampsh with minpm in the model produces a sharp deterioration in the correlation because with CPBM 1 the R2 is reduced to 0.37 (P < 0.05). This confirms results of [14], which developed parsimonious models to estimate the area occupied by corn and soybeans in the United States agricultural region from MODIS images, and determined that the amplitude of the NDVI curve was the variable that most reduced the variance.
Moreover, comparing the results of CPBM 1 and CPBM 3 shows that the estimates are almost equal and the regression curves are superimposed, so that the increase in the dispersion is due to the presence of minpm in the model. In the Reference Curve Method, the replacement of one curve by another produces significant decreases in the accuracy achieved, with Curve 1 being more appropriate to estimate the wheat area because it
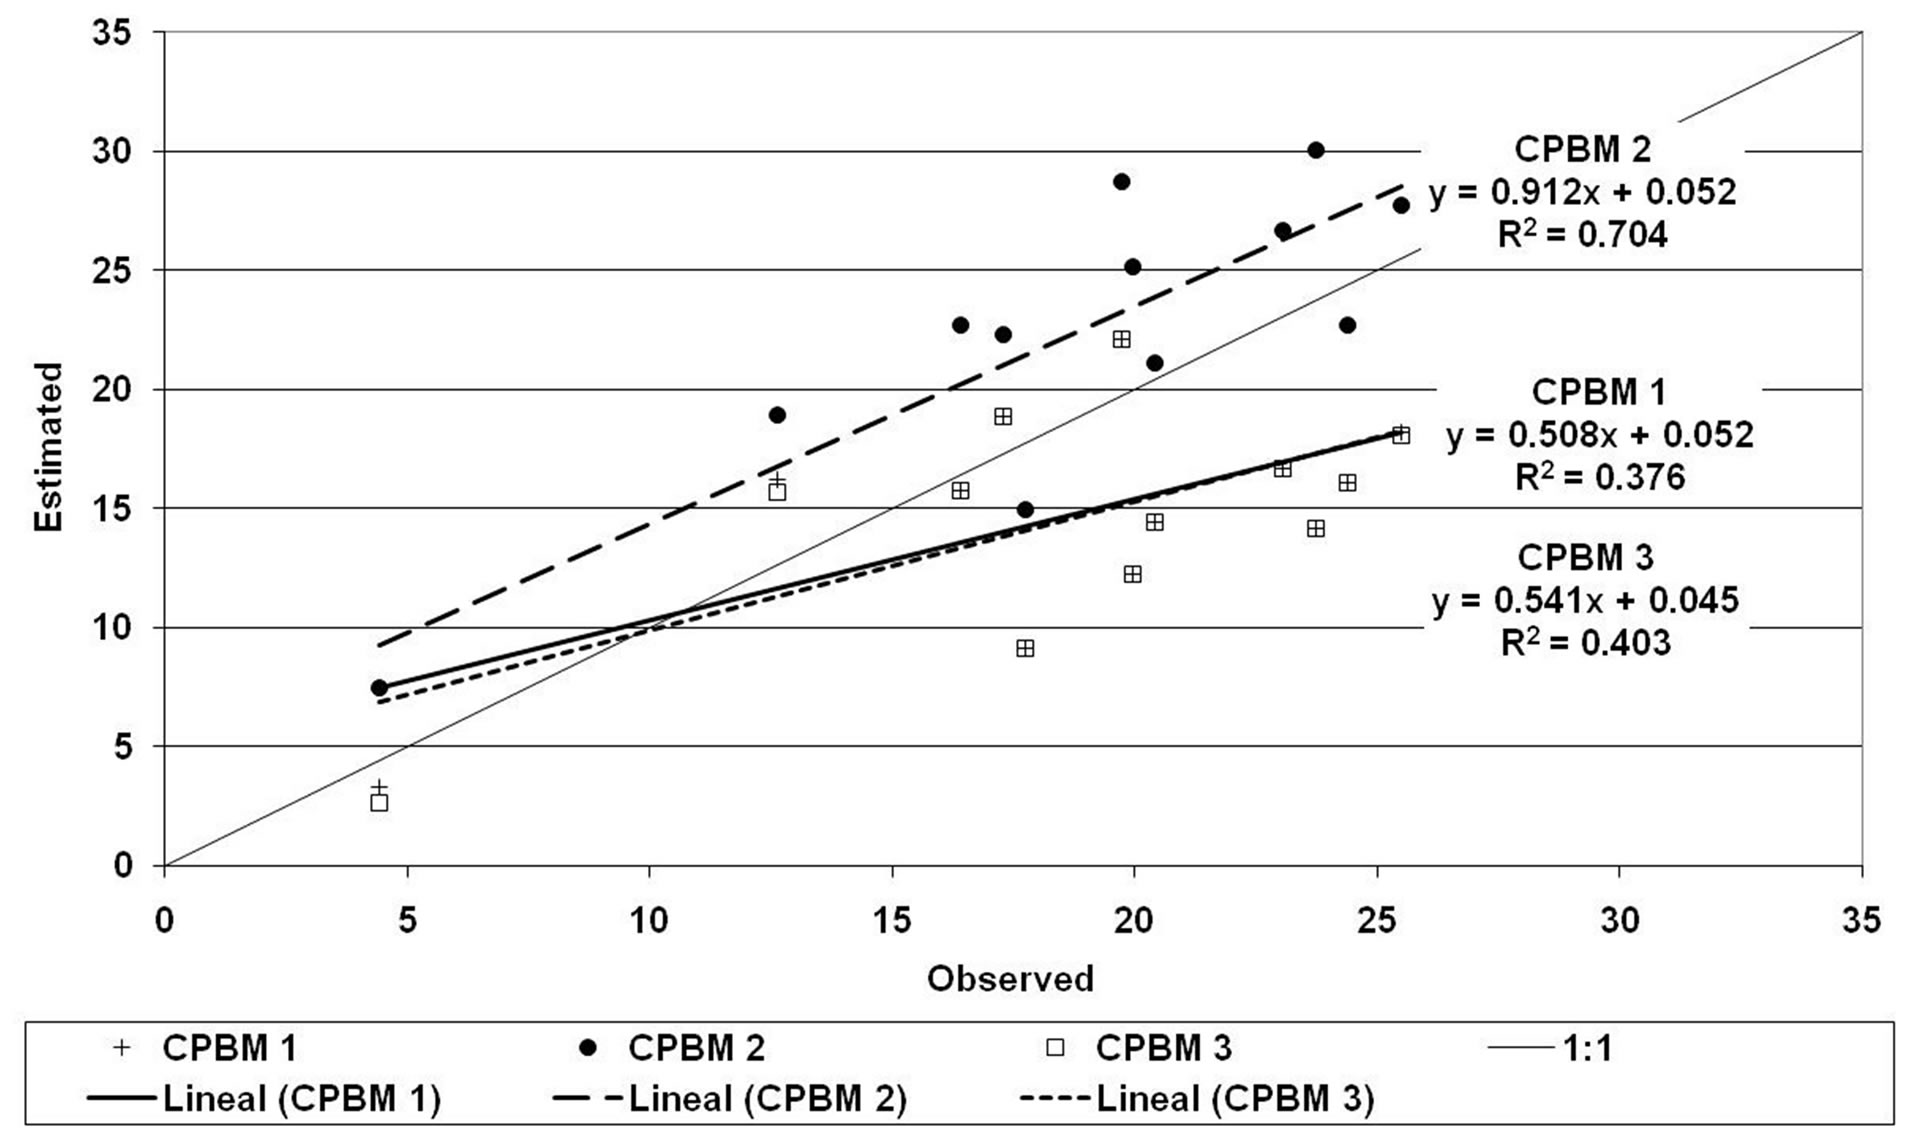
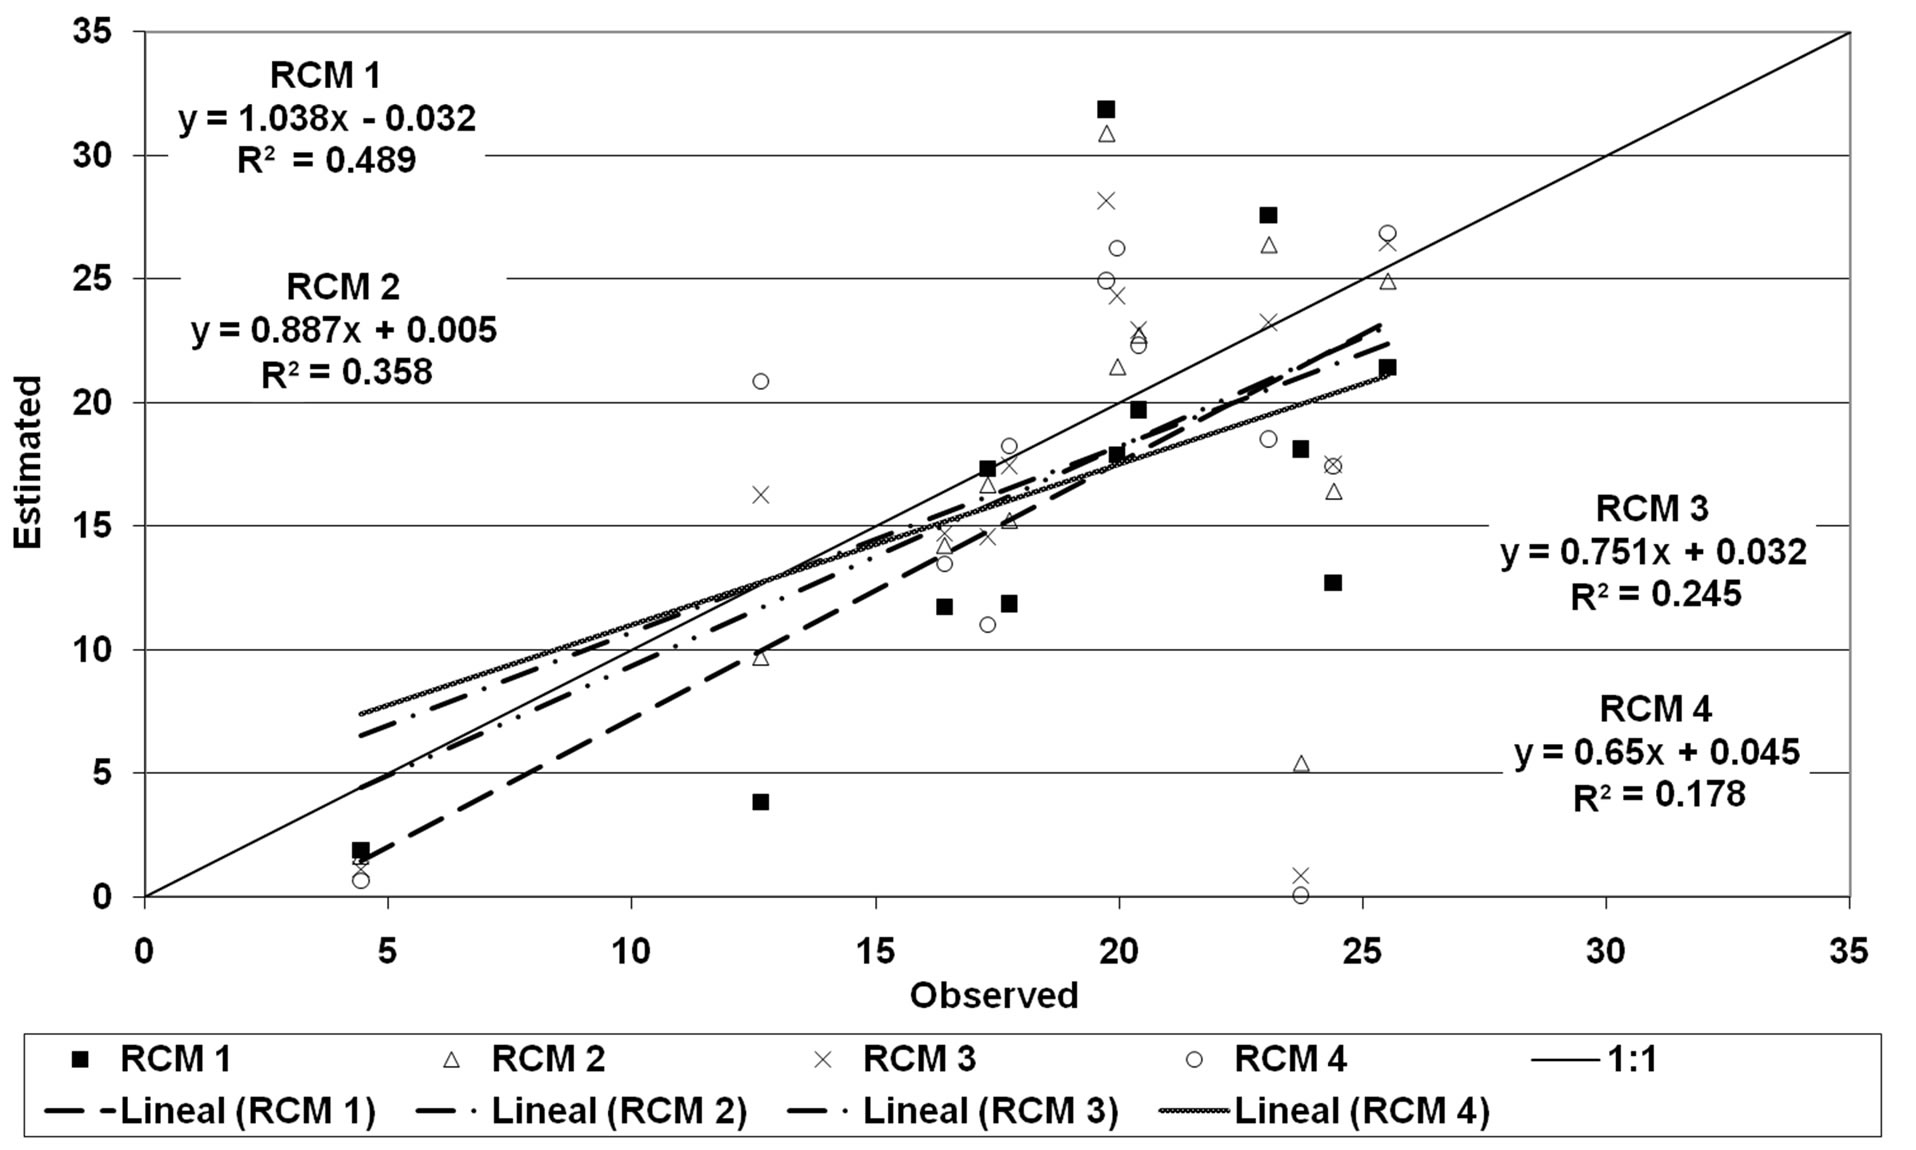
Figure 6. Relationship between the percentages of Río Segundo Department wheat area estimated by the Characteristic Phenology Behavior Method (CPBM) (top) and the Reference Curve Method (RCM) (bottom) and the observed by Agriculture Ministry of Córdoba Province.
explains at least 50% (P < 0.05) of the variability, although with a tendency to underestimate. The results for RCM 3 and RCM 4 produce non-significant coefficients of determination (P > 0.05), but retain the same trend as other procedures.
In order to determine the limit to define the area occupied with wheat from RCM, values of 0.4, 0.5 and 0.6 were established in a test mode, for the coefficient of determination and the slope of linear relationship between the sequence of NDVI of each pixel and the reference curve. This implies a range of conditions with lower to higher thresholds for classifying the membership of each pixel. As better predictive performance was found from reference curve 1 (Figure 4), only the behavior of RCM 1 was analyzed comparing estimated values with the planting records. Figure 7 thus reveals that, when the selection criterion is more restrictive (R2 and b > 0.6), the linear slope of the relationship between observed and estimated values tends to produce more pronounced underestimates and, conversely, when the limit is less strict (R2 and b > 0.4), the method consistently identifies more pixels as wheat than do the official statistics. Using > 0.5 as limit, the slope of the relationship tends to 1 and the intercept is not different from zero, confirming the fitness of using this value when the classification is operated

Figure 7. Relationship between the percentage area of Río Segundo Department sown with wheat (observed), and the values estimated from the Reference Curve Method (RCM) using Curve 1 with different thresholds (> 0.4, > 0.5 and > 0.6) for the coefficient of determination (R2) and the slope of the relationship (b).
under the curve method.
To analyze the results produced by the classification methods under different environmental conditions to those of Río Segundo Department, control tests were added from the information produced and surveyed in Marcos Juárez Department, in part of the Wheat region II North. Figure 8 shows the percentage difference between the observed values of the fraction of the territory occupied by wheat and the estimates produced from the proposed methodologies, while Table 2 includes the average error measurements for each of them.
Classification models in Marcos Juárez gave similar results to those obtained for Río Segundo Department. Here again, CPBM 2 produces a systematic overestimation of the planted area, even higher than in Río Segundo, with the value exceeding 10% in the 5 years of the series. Also, the RMSE increases from 5% to 9% and the average error from −3.6% to −8.4% (Table 2). The remaining models produce results that are covered by the band of +/−10%, with the exception of 2000 and 2007 years, when RCM 2, RCM 3 and RCM 4 are above this limit. However, comparing the results of Table 2, in general the differences of each predictive method are notably small.
As in Río Segundo Department, the use of the reference curve tends to produce results with greater error when the plateau phase is considered earlier in the cycle, with a consequent prolongation of the final stage, which may be considered as confirmation of the phenological information used as reference in Table 1, placing the period of the heading stage from late September to October. Finally, in this case too, the relationship between observed and estimated values of the area occupied by wheat was analyzed by correlation and regression, with the results shown in Figure 9.
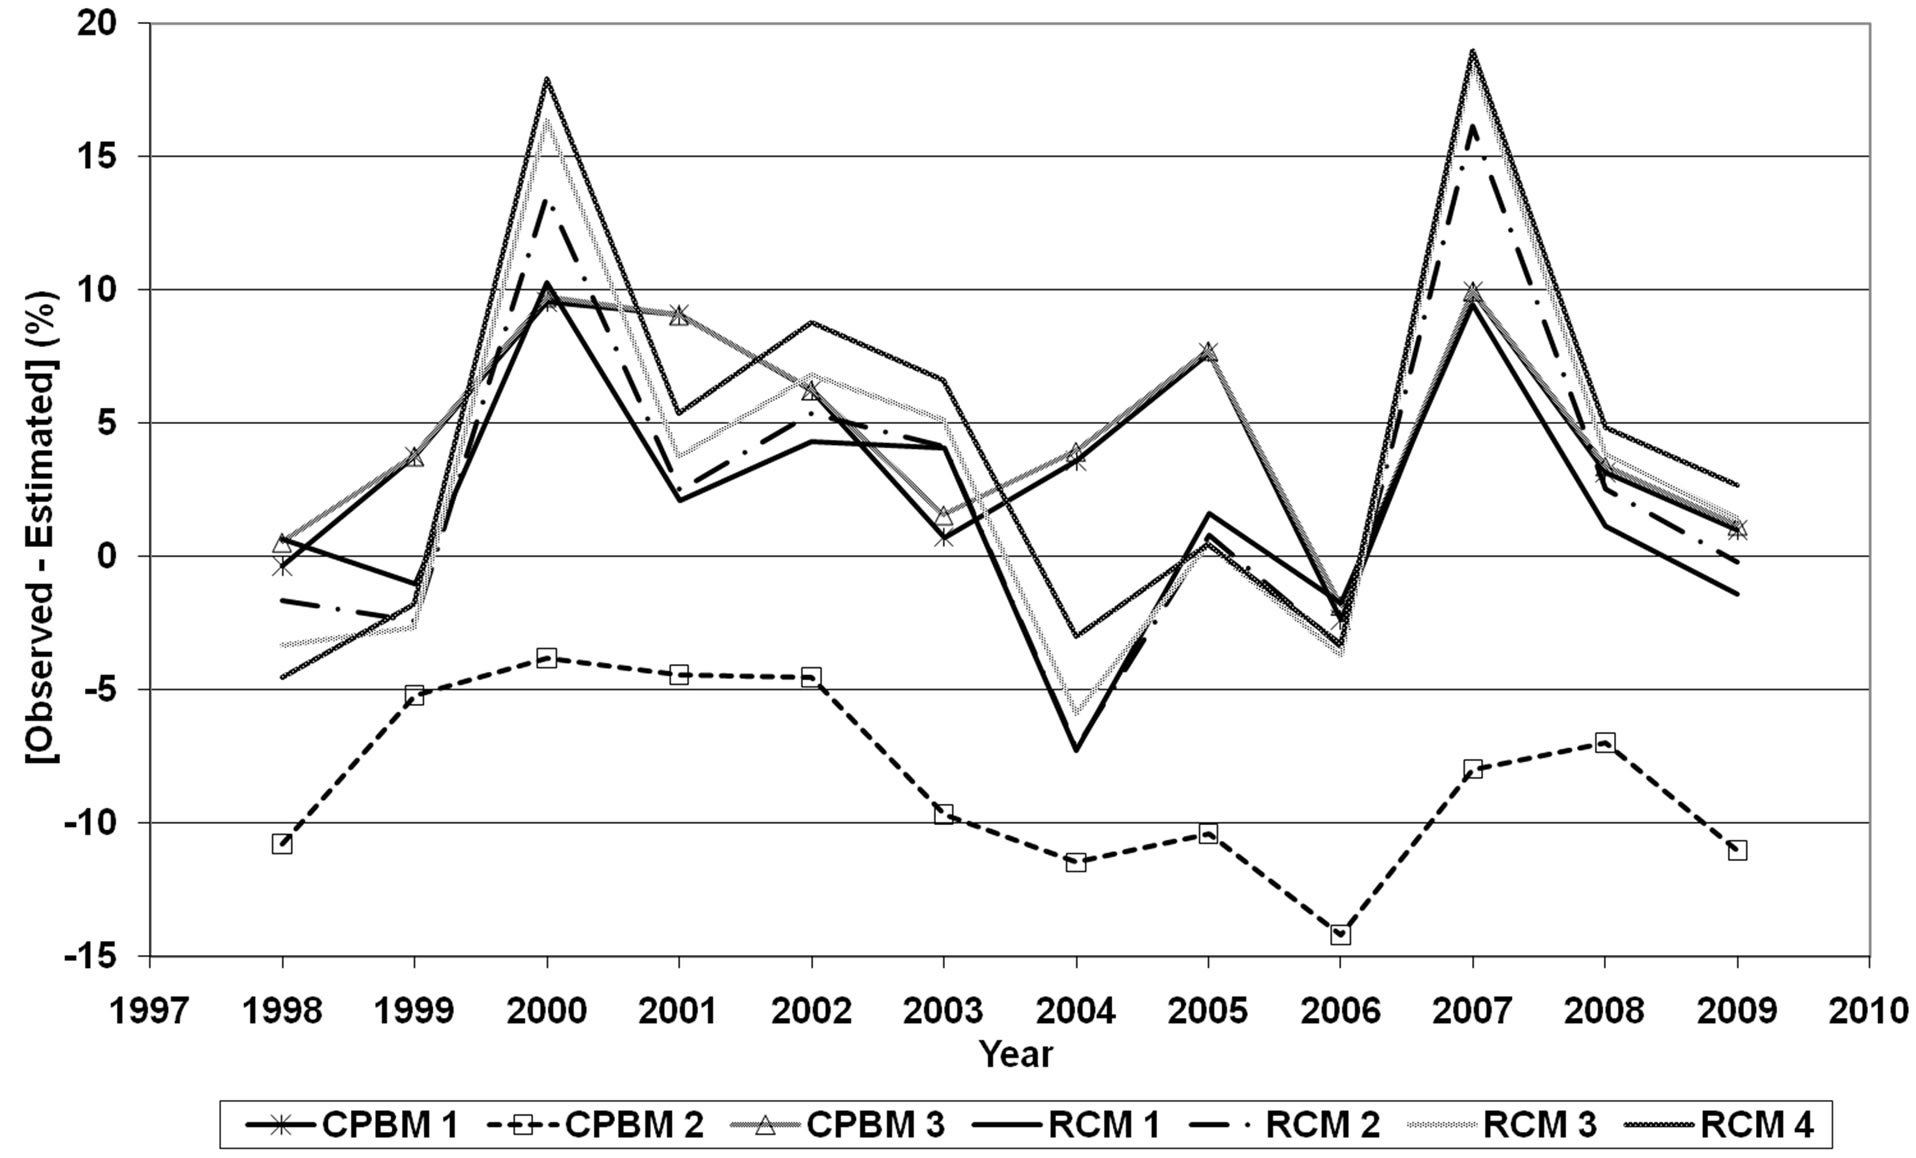
Figure 8. Percentage difference between wheat areas reported each year at Marcos Juárez Department, Córdoba, and the estimated values by the various methods of classification (Characteristic Phenology Behavior Method (CPBM) and the Reference Curve Method (RCM)) between 1998 and 2009
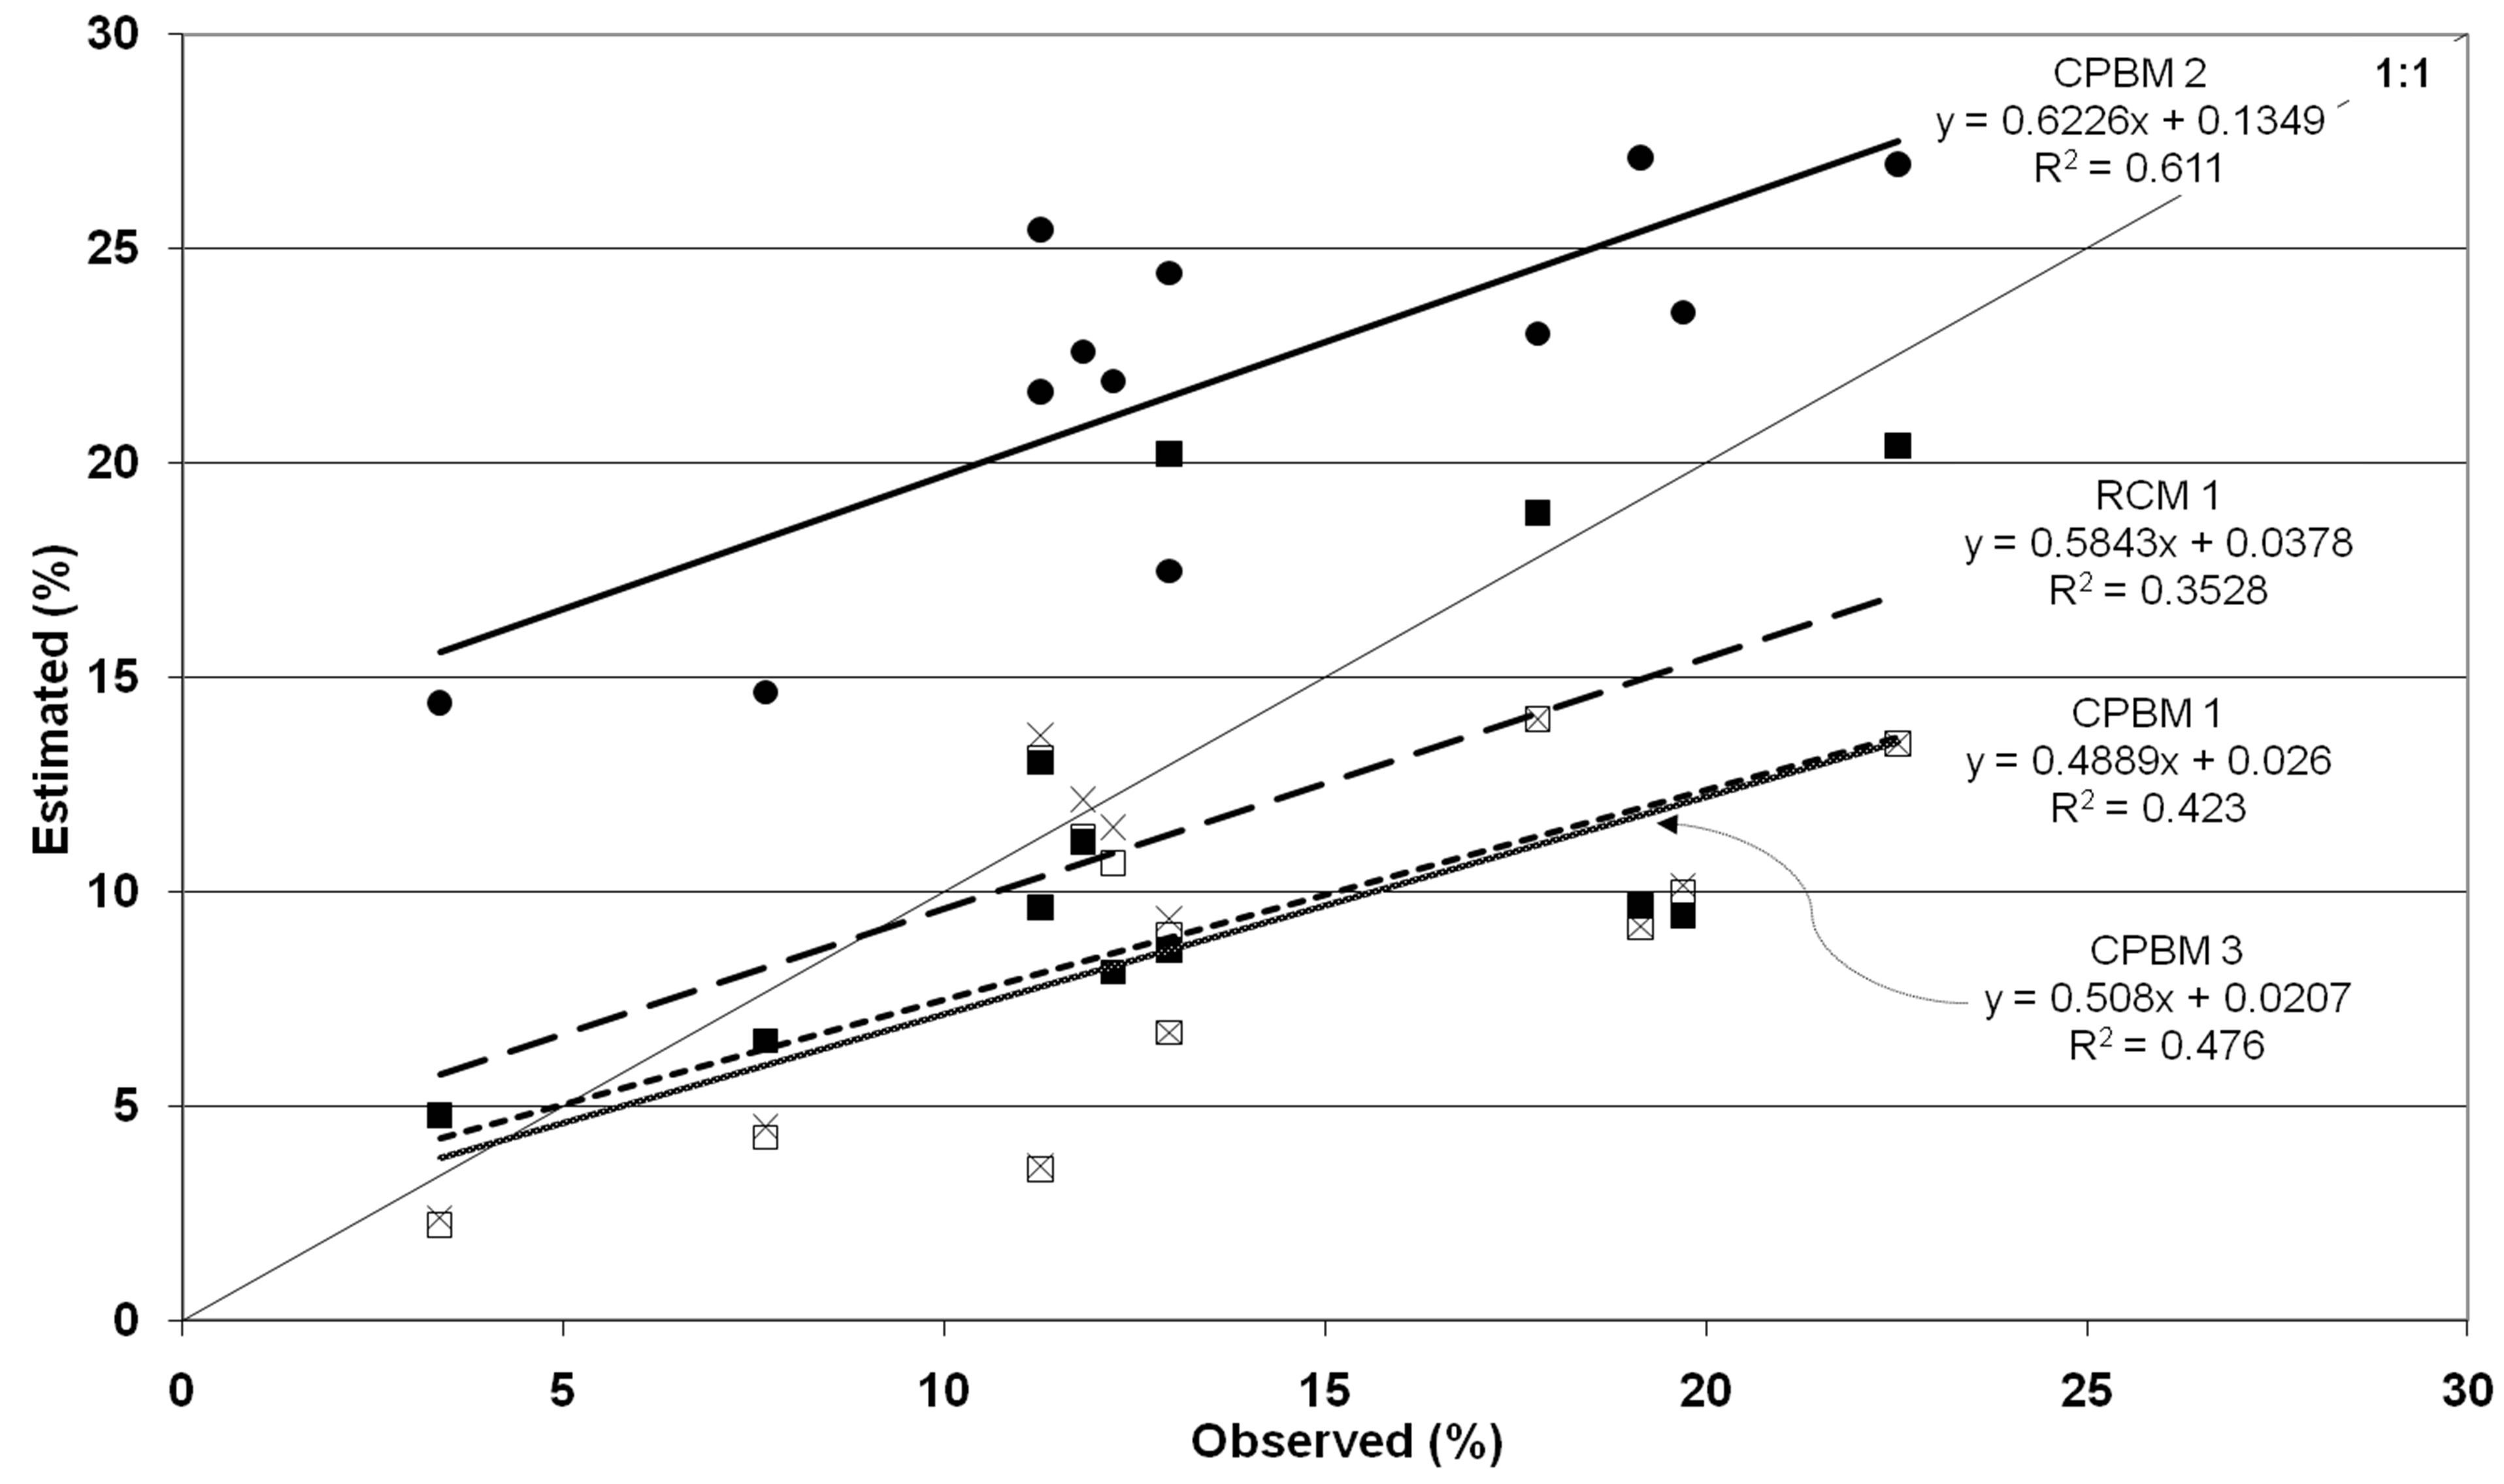
Figure 9. Relationship between the percentages of Marcos Juárez Department wheat area estimated by the Characteristic Phenology Behavior Method (CPBM 1, 2 and 3) and the Reference Curve Method (RCM 1) and observed by the Agriculture Ministry of Córdoba Province.
Model CPBM 2 best explains the interannual variability of wheat area in Marcos Juárez, with a coefficient of determination equal to 0.61 (P < 0.01), and gives similar results in Río Segundo, but in both cases with a significant but systematic overestimation. In addition, the slope of the linear relationship between observed and estimated values does not tend to 1, resulting in greater overestimation when the sowing area is smaller. The other classification models reach a predictive performance similar to that shown in Río Segundo, with values of R2 close to 0.50 (P < 0.05). Although the dispersion is higher, the results tend to approach the identity curve, which explains why the mean errors are smaller, especially in the case of an RCM, as shown in Table 2.
Categorization accuracy is best evaluated when groundtruth data can be used. This is the usual procedure followed when using Landsat TM data and other satellite data with pixel resolutions that are smaller than field sizes. Reference [31] consider that this is not feasible when using AVHRR data with a pixel resolution of 1.1 km. To have ground truth of this magnitude, it would be necessary to observe a larger area than 1 km2 and calculate the percentage area of woodlands, non-spring-wheat, spring wheat, and others. Therefore, we used the acreage of wheat for each department as our test of accuracy for the unsupervised NDVI-Spot categorization.
Reference [32] noted that even with subpixel unmixing methods, MODIS data were able to capture only half of the variability expressed in Landsat data at the scale of individual fields (~10 ha). While MODIS offers great promise for characterizing croplands at larger scales, continued acquisition of Landsat resolution data is imperative for the many agricultural applications that require field-level observations.
Finally, the procedures that used NDVI of SPOTVegetation to classify crops are less effective than those of [27] because they used, on the one hand, MODIS data of higher spatial resolution, and, on the other, they incorporated complementary agroclimatic information
4. Conclusions
Maximum Composite Value of SPOT-Vegetation proved to be a suitable data source to capture the NDVI profile characteristics of wheat in this region of Córdoba, Argentina, to classify wheat area using remote sensing, with the advantage of having that information quickly and cost effectively.
In most years, the procedures presented produce appropriate classification results to estimate the wheat area in Cordoba Province at Departmental level, both in Río Segundo and Marcos Juárez, when compared with those obtained with traditional methods by the Agriculture Ministry of Córdoba Province. However, estimation errors in some years are more pronounced and this requires further analysis.
Under the different environmental conditions present in wheat farming Regions II and V North in Argentina, predictive methods show very similar behavior in both Río Segundo and Marcos Juárez Departments, which can be considered a strength and encourages its implementation more generally in other regions.
The Characteristic Phenology Behavior Method 2 (CPBM 2) produced estimates that correlate best with the records of the planting area issued by the Ministry of Agriculture of Córdoba Province. This supports the use of the NDVI curve amplitude for classifying land use. However, despite explaining about 70% and 60% of the interannual variability of the planting area in Río Segundo and Marcos Juárez, it produces systematic overestimation of 5% and 13%, respectively. Curve 1 was the most appropriate of the Reference Curve Methods to use, as it produced error values of 7% and 5% in Río Segundo and Marcos Juárez, respectively, a lower general error than CPBM 2. However, this RCM 1 accounts for only 50% of the variability of the departmental planting area.
The 1000 m spatial resolution of MVC Spot data still limits further improvement of classification accuracy due to the effects of mixed pixels on plot edges. Efforts in pixel unmixing could be made to extend the use of this methodology to smaller plots.
5. Acknowledgements
The authors would like to thank Dr. Tim Jacobs and Dr. Carolien Tote of the Flemish Institute of the Technological Research (VITO) for providing the SPOT images, and Dr. Ben Maathuis of the Faculty of Geo-Information Science and Earth Observation of the University of Twente (ITC) for his technical advice and the supply of image processing software. Part of this research was performed within the DevCoCast (GEONETCast for and by Developing Countries) project, co-funded by the European Union’s Seventh Framework Programme under grant agreement no. 211307.
REFERENCES
- A. de la Casa, G. Ovando and A. Rodríguez, “Criteria Based on the Probability of Precipitation for Agroclimatic Risk Assessment of Rainfed Wheat Crop in Cordoba Province, Argentina,” Revista Brasileira de Agrometeorologia, Vol. 12, No. 2, 2004, pp. 333-339. (in Spanish)
- H. Kerdiles, M. Grondona, R. Rodríguez and B. Seguin, “Frost Mapping Using NOAA AVHRR Data in the Pampean Region, Argentina,” Agricultural and Forest Meteorology, Vol. 79, No. 3, 1996, pp. 157-182. http://dx.doi.org/10.1016/0168-1923(95)02253-8
- A. de la Casa and G. Ovando, “Evaluation of Rainfed Wheat Yield in Córdoba Province, Argentina, in Relation to the Availability of Water and Frost Occurrence in Different Growth Stages,” Revista Argentina de Agrometeorología, Vol. 3-4, 2003/2004, pp. 47-58. (in Spanish)
- S. M. Tavakkoli Sabour, P. Lohmann and U. Soergel, “Monitoring Agricultural Activities Using Multi-Temporal ASAR ENVISAT Data,” The International Archives of the Photogrammetry, Remote Sensing and Spatial Information Sciences. Vol. XXXVII, Part B7, WG VII/5 Processing of Multi-Temporal Data and Change Detection, Beijing, 2008, pp. 735-742.
- U. Verma, D. S. Dabas, R. S. Hooda, M. H. Kalubarme, Y. Manoj, M. S. Grewal, M. P. Sharma and R. Prawasi, “Remote Sensing Based Wheat Acreage and SpectralTrend Agrometeorological Yield Forecasting: Factor Analysis Approach,” Statistics and Applications, Vol. 9, 2011, pp. 1-13.
- J. P. Ferrio, D. Villegas, J. Zarco, N. Aparicio, J. L. Araus and C. Royo, “Assessment of Durum Wheat Yield Using Visible and Near-infrared Reflectance Spectra of Canopies,” Field Crops Research, Vol. 94, No. 2-3, 2005, pp. 126-148. http://dx.doi.org/10.1016%2Fj.fcr.2004.12.002
- J. L. Hatfield, A. A. Gitelson, J. S. Schepers and C. L. Walthall, “Application of Spectral Remote Sensing for Agronomic Decisions,” Agronomy Journal, Vol. 100, No. 3, 2008, pp. S117-S131. http://dx.doi.org/10.2134%2Fagronj2006.0370c
- T. Sakamoto, B. D. Wardlow, A. A. Gitelson, S. B. Verma and A. E. Suyker, T. J. Arkebauer, “A Two-Step Filtering Approach for Detecting Maize and Soybean Phenology with Time-Series MODIS Data,” Remote Sensing of Environment, Vol. 114, No. 10, 2010, pp. 2146-2159. http://dx.doi.org/10.1016%2Fj.rse.2010.04.019
- A. J. W. De Wit and J. G. P. W. Clevers, “Efficiency and Accuracy of Per-Field Classification for Operational Crop Mapping,” International Journal of Remote Sensing, Vol. 25, No. 20, 2004, pp. 4091-4112. http://dx.doi.org/10.1080%2F01431160310001619580
- B. D. Wardlow, S. L. Egbert and J. H. Kastens, “Analysis of Time-Series MODIS 250 m Vegetation Index Data for Crop Classification in the US Central Great Plains,” Remote Sensing of Environment, Vol. 108, No. 3, 2007, pp. 290-310. http://dx.doi.org/10.1016%2Fj.rse.2006.11.021
- M. C. Hansen and R. S. DeFries, “Detecting Long-Term Global Forest Change Using Continuous Fields of TreeCover Maps From 8-km Advanced Very High Resolution Radiometer (AVHRR) Data for the Years 1982-99,” Ecosystems, Vol. 7, No. 7, 2004, pp. 695-716. http://dx.doi.org/10.1007%2Fs10021-004-0243-3
- J. H. Kastens, T. L. Kastens, D. L. A. Kastens, K. P. Price, E. A. Martinko and R.-Y. Lee, “Image Masking for Crop Yield Forecasting Using AVHRR NDVI Time Series Imagery,” Remote Sensing of Environment, Vol. 99, No. 3, 2005, pp. 341-356. http://dx.doi.org/10.1016%2Fj.rse.2005.09.010
- X. Zhan, R. A. Sohlberg, J. R. G. Townshend, C. DiMiceli, M. L. Carroll, J. C. Eastman, M. C. Hansen and R. S. DeFries, “Detection of Land Cover Changes Using MODIS 250m Data,” Remote Sensing of Environment, Vol. 83, No. 1-2, 2002, pp. 336-350. http://dx.doi.org/10.1016%2FS0034-4257%2802%2900081-0
- J. Chang, M. C. Hansen, K. Pittman, M. Carroll and C. Di Miceli, “Corn and Soybean Mapping in the United States Using MODIS Time-Series Data Sets,” Agronomy Journal, Vol. 99, No. 6, 2007, pp. 1654-1664. http://dx.doi.org/10.2134%2Fagronj2007.0170
- V. Sapino and C. Vidal, “Evaluation of Methods to Estimate the Area Occupied by Wheat in 2008 in Santa Fe Province Technical Information of Wheat and Other Winter Crops, Crop Season 2009,” Publicación Miscelánea No 113, INTA-Estación Experimental Agropecuaria Rafaela. Santa Fe, Argentina, 2009 (in Spanish).
- C. Atzberger and P. H. C. Eilers, “A Time Series for Monitoring Vegetation Activity and Phenology at 10-Daily Time Steps Covering Large Parts of South America,” International Journal of Digital Earth, Vol. 4, No. 5, 2011, pp. 365-386. http://dx.doi.org/10.1080%2F17538947.2010.505664
- C. A. J. M. de Bie, M. R. Khan, V. U. Smakhtin, V. Venus, M. J. C. Weir and E. M. A. Smaling, “Analysis of MultiTemporal SPOT NDVI Images for Small-Scale Land-Use Mapping,” International Journal of Remote Sensing, Vol. 32, No. 21, 2011, pp. 6673-6693. http://dx.doi.org/10.1080%2F01431161.2010.512939
- T. Murakami, S. Ogawa, N. Ishitsuka, K. Kumagai and G. Saito, “Crop Discrimination with Multitemporal SPOT/ HRV Data in the Saga Plains, Japan,” International Journal of Remote Sensing, Vol. 22, No. 7, 2001, pp. 1335- 1348. http://dx.doi.org/10.1080%2F01431160151144378
- J. P. Guerschman, J. M. Paruelo, C. Di Bella, M. C. Giallorenzi and F. Pacin, “Land Cover Classification in the Argentine Pampas Using Multi-Temporal Landsat TM Data,” International Journal of Remote Sensing, Vol. 24, No. 17, 2003, pp. 3381-3402. http://dx.doi.org/10.1080%2F0143116021000021288
- J. T. Musick, O. R. Jones, B. A. Stewart and D. A. Dusek, “Water-Yield Relationships for Irrigated and Dryland Wheat in the US Southern Plains,” Agronomy Journal, Vol. 86, No. 6, 1994, pp. 980-986. http://dx.doi.org/10.2134%2Fagronj1994.00021962008600060010x
- E. Martellotto, A. Salinas, H. Salas, E. Lovera, J. Giubergia, V. Capuccino, C. López, O. Signorile, S. Lingua, S. Álvarez, M. Cantarero and G. Viotti, “Wheat: A Contribution to the Sustainability of Production Systems. Evaluation of Cultivars and Management Strategies in 8 Sites at Córdoba Province,” Boletín No 9, Ediciones Instituto Nacional de Tecnología Agropecuaria, EEA Manfredi INTA, Córdoba, 2005 (in Spanish).
- T. Jacobs, P. Claes, B. Smets, T. Van Roey and H. Eerens, “Vgtextract: The Free Vegetation Extraction Tool. Software User Guide,” AGRICAB FP 7 SICA 282621, Flemish Institute of the Technological Research (VITO), 2012.
- C. Bainotti, J. Fraschina, J. Salines, E. Alberione, M. Cuniberti, B. Masiero, G. Donaire, D. Gómez, J. Nisi, M. Formica, O. Berra, S. Macagno and L. Mir, “Evaluation of Wheat Cultivars in the EEA Marcos Juárez. Crop Season 2007,” INTA-EEA Marcos Juárez, Marcos Juárez, Cba., Argentina, 2007 (in Spanish).
- C. Bainotti, J. Fraschina, J. Salines, E. Alberione, D. Gómez, G. Donaire, J. Nisi, B. Masiero, B. Conde, M. Cuniberti, L. Mir, S. Macagno and O. Berra, “Evaluation of Wheat Cultivars in the EEA Marcos Juárez. Crop Season 2008/2009,” INTA-EEA Marcos Juárez, Marcos Juárez, Cba., Argentina, 2009 (in Spanish).
- C. Bainotti, J. Fraschina, J. Salines, E. Alberione, D. Gómez, G. Donaire, J. Nisi, B. Masiero, B. Conde, C. Gutiérrez, M. Cuniberti, L. Mir, S. Macagno, O. Berra, H. Paolini and F. Reartes, “Evaluation of Wheat Cultivars in the EEA Marcos Juárez. Crop Season 2010,” INTA-EEA Marcos Juárez, Marcos Juárez, Cba., Argentina, 2011 (in Spanish).
- Integrated Agricultural Information System (SIIA), Ministry of Agriculture, Livestock and Fisheries of Argentina, 2013. http://www.siia.gov.ar/index.php/series-por-provincia/cordoba
- D. M. Howard, B. K. Wylie and L. L. Tieszen, “Crop Classification Modelling Using Remote Sensing and Environmental Data in the Greater Platte River Basin, USA,” International Journal of Remote Sensing, Vol. 33, No. 19, 2012, pp. 6094-6108. http://dx.doi.org/10.1080%2F01431161.2012.680617
- L. Zhong, T. Hawkins, G. Biging and P. Gong, “A Phenology Based Approach to Map Crop Types in the San Joaquin Valley, California,” International Journal of Remote Sensing, Vol. 32, No. 22, 2011, pp. 7777-7804. http://dx.doi.org/10.1080%2F01431161.2010.527397
- Agriculture Ministry of Córdoba Province, “Statistics of Crop Acreage and Yields,” Córdoba, Argentina, 2010. http://magya.cba.gov.ar/Umsiia.aspx#anterior
- M. Turker and A. Ozdarici, “Field-Based Crop Classification Using SPOT4, SPOT5, IKONOS and Quickbird Imagery for Agricultural Areas: A Comparison Study,” International Journal of Remote Sensing, Vol. 32, No. 24, 2011, pp. 9735-9768. http://dx.doi.org/10.1080%2F01431161.2011.576710
- A. J. Stern, P. C. Doraiswamy and P. W. Cook, “Spring Wheat Classification in an AVHRR Image by Signature Extension From a Landsat TM Classified Image,” Photogrammetric Engineering & Remote Sensing, Vol. 67, No. 2, 2001, pp. 207-211.
- D. B. Lobell and G. P. Asner, “Cropland Distributions from Temporal Unmixing of MODIS Data,” Remote Sensing of Environment, Vol. 93, No. 3, 2002, pp. 412-422. http://dx.doi.org/10.1016%2Fj.rse.2004.08.002
NOTES
*Corresponding author.