International Journal of Geosciences
Vol. 3 No. 4 (2012) , Article ID: 22464 , 9 pages DOI:10.4236/ijg.2012.34071
Dissolved Organic Matter-Complexed Iron in Two Rivers with Different Types of Soils in Watershed Area
1Graduate School of Bioagricultural Sciences, Nagoya University, Nagoya, Japan
2NPO Symfosea Network, Oita, Japan
Email: *moroi.kunio@e.mbox.nagoya-u.ac.jp
Received April 20, 2012; revised May 25, 2012; accepted June 3, 2012
Keywords: Dissolved organic matter (DOM); dissolved humic substances (DHS); DOM-complexed Fe (DOM-Fe); watershed area
ABSTRACT
Concentrations of dissolved organic matter (DOM), dissolved humic substances (DHS), and DOM-complexed Fe (DOM-Fe) in Yamakuni and Oita Rivers, Japan, of which headstream is near in location, flow pass length is similar, but watershed soil type differs, were investigated. Soil organic matter level was higher in black Andosols distributing 67% of the watershed area of the Oita River than in Cambisols covering 90% of the watershed area of Yamakuni River. However, the DOM concentration in the Yamakuni River (0.44 - 1.62 mg∙C∙L−1) tended to be higher than that in the Oita River (0.13 - 1.37 mg∙C∙L−1). DHS accounted for 49% - 80% of DOM in both rivers. Fe and DOM-Fe concentrations showed a trend to increase toward downstream but decrease at the estuary in both rivers. DOM-Fe accounted for 26% - 90% and 55% - 93% of dissolved Fe in the Yamakuni and Oita Rivers, respectively. Correlation analysis suggested that the DOM-Fe concentration in the river water was controlled by the capacity for supplying Fe ions rather than that for supplying DOM. Although the ability to form a complex with Fe was suggested to be greater in the DOM in the Oita River than that in the Yamakuni River, the DOM-Fe concentration at the estuary was similar in the two rivers. Thus, the effect of soil organic matter level in the watershed area on the supply of Fe or DOM-Fe to the estuarine ecosystem was not significant.
1. Introduction
Dissolved organic matter (DOM) in aquatic environments has a number of biogeochemical functions, including supplying energy and nutrients to aquatic biota [1-3]. In aquatic environments, trace elements such as Fe and Cu are supplied from sediment and terrestrial sources, the chief component of which is soil in the watershed area. The Fe ions necessary for photosynthesis in algae exist in natural water in the form of divalent and trivalent ions. Ferrous ions are readily oxidized to ferric ions, and then hydrolyzed and precipitated under neutral or basic conditions. However, ferric ions in a water body can remain dissolved by forming water-soluble complexes with DOM, which then act as the Fe source for aquatic biota [4-6].
Humic substances (HS) are dark-colored natural organic matter produced secondarily from the dead bodies and metabolites from various organisms in the environment. Dissolved HS (DHS) in water are classified as humic and fulvic acids on the basis of their differences in solubility at low pH. Fulvic acids, which are soluble at any pH, are a major DOM component in the aquatic environment [2,7]. Highly reactive functional groups in fulvic acids can form stable complexes with polyvalent metals [8,9]. It was determined that most of the Fe in seawater is bound to DOM [10,11], and that terrestrial DHS in seawater exhibits strong Cu-binding behavior [12]. As such, it is considered that the DHS significantly contribute to the maintenance of ecosystems in estuarine and coastal areas through the delivery of Fe and other nutritional elements.
Sources of DOM and DHS in river water are basin soil, sediment, atmospheric deposits, and aquatic organisms. In Japan, mountainous areas covered with forest occupy approximately 60% of the land. Cambisols formed in these mountainous areas under broadleaf tree forests or secondary forests of Japanese cedar and cypress trees constitute the major soil type (53% of total area; [13]). Black Andosols, which are formed in volcanic products and are rich in HS, are also widely distributed (17%), whereas peat soil, another humus-rich soil associated with wetlands, is found in a small proportion (4%). Rivers rise from steep mountains, flow through narrow hills and plain areas, and empty into the sea. Thus, the flow rate of river water is generally high. Under these circumstances, basin soils are considered to be the main source of DOM in river water [14,15].
Soil-derived DOM can be transferred to rivers through leaching after percolation into soil layers and by the inflow of surface water. The inflow also carries soil particles, and some of the organic matter attached to the particles may be extracted by rivers. The main transport route of DOM may vary depending on climatic conditions, vegetation, and soil properties [16-18], which may influence the quantity and quality of DOM in rivers. However, the influence of the watershed soil type on the supply of DOM and DOM-associated metals to rivers has not been evaluated. To access this unsolved problem, comparison of rivers with similar climatic conditions and different types of watershed soils is a way. In the present study, the concentrations of DOM and DOM-complexed Fe (DOM-Fe) in two major rivers flowing through Oita Prefecture, Kyushu Island, Japan, were investigated. These rivers contain Cambisols and Andosols as major soils in their basins. The organic C content was generally larger in Andosols than in Cambisols especially in the A horizon. Although no technique is available to determine the concentration of DHS-complexed Fe, DHS concentration was also measured because of their strong ability to form complexes with Fe.
2. Materials and Methods
2.1. Sampling Sites
Water samples were collected from two rivers in Oita Prefecture, Japan: Yamakuni and Oita (Figure 1). The headstream of the Yamakuni River is in Mt. Hiko, and Cambisols have formed along the basin (90% coverage; [19]). Yamakuni River has a 56 km flow pass and 540 km2 catchment area, and flows into the Suo Rough Sea in the northern part of Kyushu Island. Its annual discharge was 6.20 × 10⁸ m3 in 2007 [20]. The following five locations near the headstream to the estuary were chosen as sampling points: Point 1, 33˚29'46.81''N, 131˚58'02.05''E; Point 2, 33˚24'25.99''N, 131˚02'05.26''E; Point 3, 33˚27' 45.22''N, 131°06'51.67''E; Point 4, 33˚30'08.70''N, 131˚ 10'12.68''E; and Point 5, 33˚36'18.68''N, 131˚10'41.85''E. Points 2-4 were chosen among places where distances from the next points are 10 - 20 km and a footpath or a bridge is available.
The Oita River rises from the Kuju Mountains and flows into the Gulf of Beppu in the eastern part of Kyushu Island. The flow pass length is similar to the Yamakuni River, 55 km, and catchment area is 650 km2 with 67% coverage by Andosols [21,22]. The annual discharge of the Oita River was 9.57 × 10⁸ m3 in 2007 [20]. The following five sampling points near the headstream to the estuary with similar distances to those between the
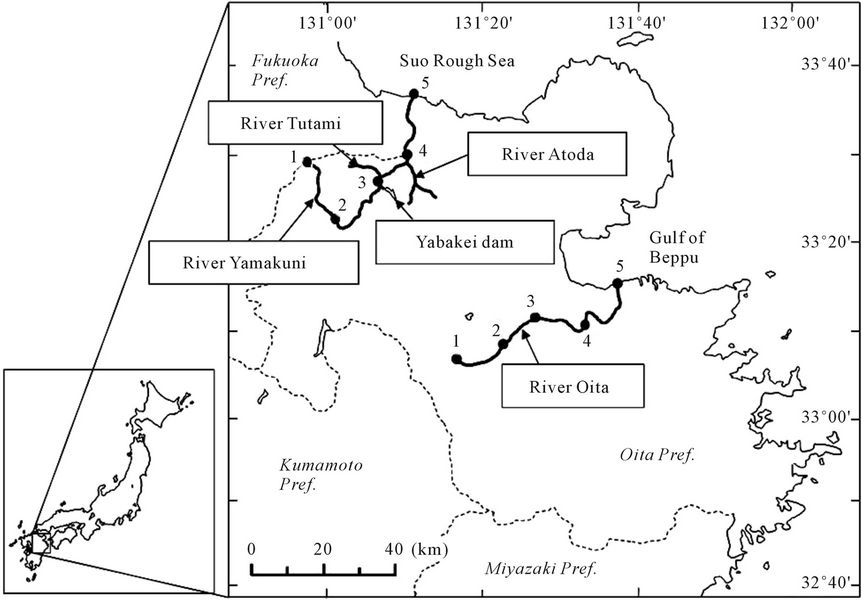
Figure 1. Locations of the Yamakuni and Oita Rivers. These rivers flow to Suo Rough Sea and Gulf of Beppu, respectively. Broad lines indicate rivers. Dotted lines indicate the boundary of prefectures. Closed circles indicate sampling points.
sampling points in the Yamakuni River were chosen: Point 1, 33˚7'29.89''N, 131˚17'38.88''E; Point 2, 33˚7'49.25''N, 131˚20'48.15''E; Point 3, 33˚11'2.28''N, 131˚27'7.93''E; Point 4, 33˚11'27.77''N, 131˚33'14.04''E; and Point 5, 33˚14'48.41''N, 131˚37'11.71''E.
2.2. Sample Collection
Duplicate water samples (500 mL) were collected in August (summer) and November (autumn) in 2007, and February (winter) and May (spring) in 2008, in polypropylene bottles previously washed with 8 M HNO3. Samples were collected directly (Points 1 and 2) or transferred from those collected in a polypropylene prewashed bucket (Points 3-5) into the bottles. The bottles were carried to the laboratory under refrigerated conditions. The summer samples were accidentally frozen before the analysis was completed; therefore, another series of samples was collected in August in 2009.
In August 2009, duplicate samples were also collected from three tributary streams ahead of (stream from Yabakei Dam) and beyond (the Tutami and Atoda Rivers) Point 3 in the Yamakuni River (Figure 1) as well as from the coastal levees near Point 5 of the Yamakuni and Oita Rivers. The stream from Yabakei Dam flows into the Yamakuni River throughout the year.
2.3. Measurements of DOC and General Water Chemistry
Portions of water samples were used for measuring pH (M-12, Horiba, Tokyo, Japan) and transmitted light (turbidity) at 660 nm (UV-2450, Shimadzu, Kyoto, Japan). The remaining samples (400 mL) were filtered through precombusted glass fiber filters with a pore size of 0.40 μm (GB-140, Advantec, Tokyo). The filters used were dried at 105˚C for two hours and weighed to determine the amount of suspended solids (SS).
The DOC concentration in the filtered water samples was measured using a total organic carbon analyzer (TOC-VCPH, Shimadzu) after the pH of sample was adjusted to around 1.5 with 3 M H2SO4 and CO2 in the sample was excluded by sparging with N2. Concentrations of various elements in the samples acidified with 1 M NO3 were determined using an inductively coupled plasma spectrometer (ICP-AES; IRIS-AP, Nippon JarrellAsh, Kyoto). Anion concentrations were determined using an ion chromatograph (PIA-1000, Shimadzu).
2.4. Measurements of DHS and DOM-Complexed Metals
To determine the concentration of DHS, 40-mL filtered water samples were acidified (pH 1.5) with 3 M H2SO4 and passed through a column packed with prewashed 3 mL Supelite DAX-8 (SUPELCO, Bellefonte, PA, USA). The resin was then washed with 9 mL of 0.1 M H2SO4. The eluate and the washing fluid were combined and filled up to a volume of 50 mL (DAX-8 non-adsorbed fraction). The DOC concentration in the DAX-8 nonadsorbed fraction was determined using TOC-VCPH. The DOC concentration in ultrapure water after the same procedures (triplicate) was measured as a reference. The DHS concentration was estimated from the difference between total DOC and DOC in the DAX-8 non-adsorbed fraction, corrected for the C concentration in the reference.
The concentration of DOM-Fe was determined in a similar manner with these differences: 3 mL of prewashed Q Sepharose Fast Flow (Amersham Bio-Sciences, Uppsala, Sweden), an anion exchange resin, was used instead of DAX-8, and the water sample was applied without pH regulation. In this procedure, approximately 90% of DOM was adsorbed onto the resin. Metal concentrations in the Q Sepharose non-adsorbed fraction were determined using IRIS-AP. The difference in Fe concentration between the original samples and the Q Sepharose non-adsorbed fractions was regarded as the DOM-Fe concentration [23,24]. Concentration of Fe in the ultrapure water blank treated by the same method as the DOM samples was lower than the detection limit.
2.5. Statistical Analysis
Average of duplicated samples was used as one data in statistical analysis. The significance of the differences in concentrations of DOC, DHS, dissolved Fe, DOM-Fe, and the other water chemistry among the five sampling points in the two rivers was estimated by two-way ANOVA, in which four data from different seasons were regarded as replicates. Relationships between two properties were examined by correlation or regression analysis.
3. Results
3.1. DOC and DHS Concentrations in Yamakuni and Oita Rivers
The DOC concentration in the Yamakuni River was 0.44 - 1.62 mg∙C∙L−1 and that in the Oita River was 0.13 - 1.37 mg∙C∙L−1 (Figure 2(a)). The DHS concentration in the Yamakuni River was 0.29 - 1.29 mg∙C∙L−1 (49% - 80% of DOM) and that in the Oita River was 0.09 - 1.04 mg∙C∙L−1 (49% - 79% of DOM) (Figure 2(b)). In the Oita River, both the DOC and DHS concentrations tended to increase from the headstream toward the estuary. Although similar trends were observed in the Yamakuni River, the DOC and DHS concentrations at Point 3 (1.38 - 1.49 and 0.74 - 1.07 mg∙C∙L−1, respectively)
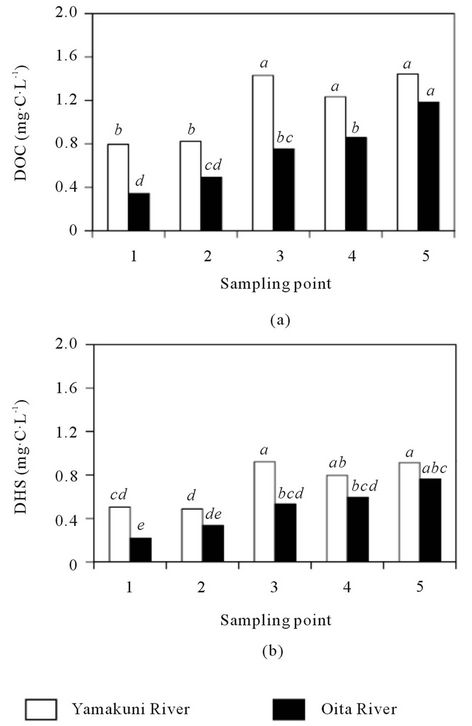
Figure 2. Concentrations of DOC (a) and DHS (b) in the Yamakuni and Oita Rivers. Different letters indicate significant differences at P < 0.05.
were consistently greater than those at Point 4 (1.02 - 1.47 and 0.62 - 1.16 mg∙C∙L−1, respectively).
In August 2009, DOC and DHS concentrations in river water samples collected from the tributary streams of the Yamakuni River and in seawater samples collected at coastal levees close to Point 5 of the two rivers were also determined (Table 1). The DOC and DHS concentrations in the stream flowing from Yabakei Dam ahead of Point 3 were 2.76 and 2.15 mg∙C∙L−1, respectively, which were larger than those at any of the sampling points in the Yamakuni River. On the other hand, the DOC and DHS concentrations in the Tsutami River flowing into the Yamakuni River between Points 3 and 4, 0.98 and 0.62 mg∙C∙L−1, respectively, were smaller than those at Points 3 and 4. The DOC and DHS concentrations in the Atoda River, which also flows into the Yamakuni River between Points 3 and 4, were similar to those at Point 3, 1.67 and 1.13 mg∙C∙L−1, respectively. The DOC and DHS concentrations in the seawater samples were 1.66 - 2.42 and 1.10 - 1.62 mg∙C∙L−1, respectively. These values were similar to those at Point 5 in the Yamakuni River while greater than those at Point 5 in the Oita River.
3.2. DOM-Fe Concentration in Yamakuni and Oita Rivers
The dissolved Fe concentrations in the Yamakuni and Oita Rivers were 0.001 - 0.021 and 0.001 - 0.035 mg∙L−1, respectively; these concentrations showed a trend to increase from Point 1 to Point 3 or 4 and then decrease at Point 5 (Figure 3(a)). The DOM-Fe concentrations accounted for 26% - 90% and 55% - 93% of dissolved Fe in the Yamakuni and Oita Rivers, respectively; these concentrations also tended to increase from Point 1 to Point 3 or 4 and then decreased at Point 5 (Figure 3(b)).
The dissolved Fe and DOM-Fe concentrations in the stream from Yabakei Dam in August 2009 (Table 1) were 0.048 and 0.043 mg∙L−1, respectively, which were larger than those at any sampling point in the Yamakuni River. The Fe and DOM-Fe concentrations at the Tutami (0.005 and 0.004 mg∙L−1) and Atoda Rivers (0.019 and 0.017 mg∙L−1) were smaller than or similar to those at Point 3. The Fe and DOM-Fe concentrations in the seawater samples were 0.006 - 0.011 and 0.003 - 0.008
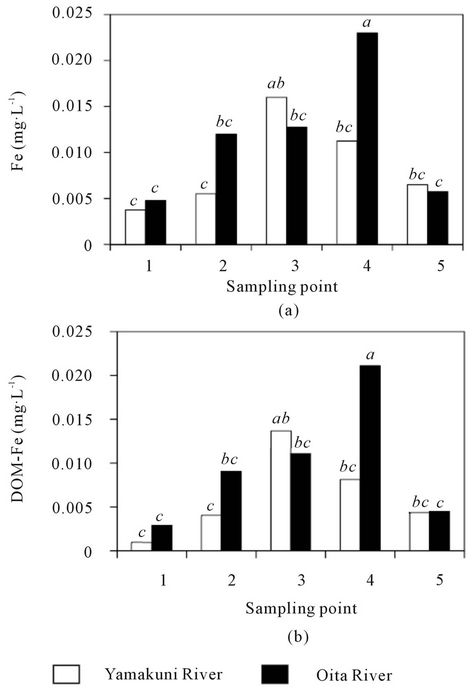
Figure 3. Concentrations of dissolved Fe (a) and DOM-Fe (b) in the Yamakuni and Oita Rivers. Different letters indicate significant differences at P < 0.05.
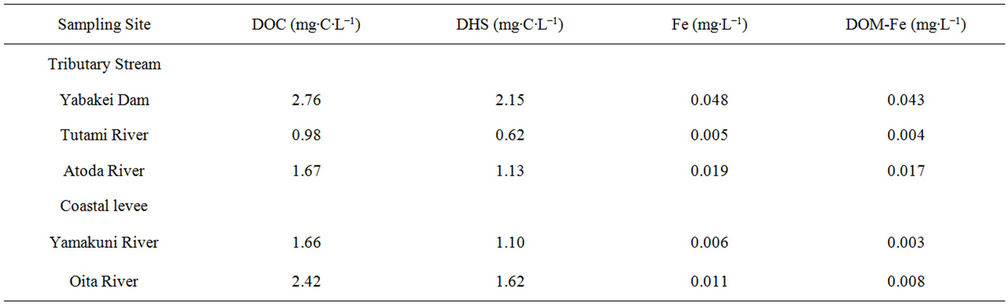
Table 1. Concentrations of dissolved organic carbon (DOC), dissolved humic substances (DHS), dissolved Fe, and DOMcomplexed Fe samples collected from tributary streams of the Yamakuni River and coastal levees near Point 5 of the Yamakuni and Oita Rivers in August 2009.
mg∙L−1, respectively (Table 1). These values were similar to those at Point 5 in the Yamakuni River but larger than those at Point 5 in the Oita River.
3.3. Water Chemistry of Yamakuni and Oita Rivers
The chemistry of water samples taken from the Yamakuni and Oita Rivers is presented in Table 2. Cd, Cr, Mn, Mo, Ni, Pb, and Zn were not detected in most samples. The predominant inorganic anions were Cl−,  , and
, and . The spatial variation in pH of the Yamakuni River was small, while
 , Ca, and Mg concentrations increased drastically between Points 1 and 2. An increase in turbidity, SS, K, and Si and a decrease in
  and Ca were observed between Points 2 and 3. In the Oita River, the maximum concentration of
  was recorded at Point 1, while those of Ca, K, and Mg were observed at Point 2, except for Point 5, where the influence of seawater was clear. Thus, these properties and the concentrations of other trace elements did not show a similar pattern of spatial variation as those of DOM and Fe concentrations. The SS in the Oita River increased toward the estuary. Although turbidity frequently showed a similar trend as the SS, there was no significant correlation between them in either river.
4. Discussion
In previous reports, the DOC concentrations in clear river water ranged from 0.52 to 2.1 mg∙C∙L−1 [25-27], and the proportion of DHS in DOM was 20% - 70% [28,29]. The present results are mostly within those previously reported. The increase in DOC and DHS concentrations from the headstream toward the estuary in Oita River indicate their gradual loading from the basin. The tendency of DOC and DHS concentrations to increase toward downstream in the Yamakuni River was disrupted between Points 2 and 4 (Figure 2). Based on the additional analysis of the tributary stream water, the introductions of dam water before Point 3 and Tutami stream water before Point 4 were possible causes of the abrupt increase in DOC concentration and decrease in DHS concentration (Table 1). Thus, the different patterns in the spatial variation in DOC and DHS concentrations between the Yamakuni and Oita Rivers were attributable to the difference in the influence of tributary streams.
When the DOC and DHS concentrations in the two rivers were compared, they were larger in the Yamakuni River than in the Oita River (P < 0.05). It was also true for upper streams (Points 1 and 2) that have no influence of tributary streams. Andosols, which are distributed in the basin of the Oita River, contain larger amounts of soil organic matter (15 - 37 kg∙C∙m−2 within 50 cm depth) than Cambisols, which are distributed in the basin of the Yamakuni River (4.6 - 24 kg∙C∙m−2 within 50 cm depth) [19,22]. It was therefore considered that the difference in the level of soil organic matter did not have a significant effect on the DOC and DHS concentrations in river water.
In the present study, the proportion of Fe occurring as an organically bound form (50% - 100%) was comparable with that in lake waters (30% - 60%; [30,31]) and in other Japanese rivers (70% - 100%; [4]). As shown in Figure 4, there was a positive correlation between the concentrations of total dissolved Fe and DOM-Fe (P < 0.01). However, the concentration of neither DOC nor DHS correlated to the DOM-Fe concentration, even when the data from Point 5 was excluded. These results suggest that the concentration of DOM-Fe in these river waters was limited not by the capacity for supplying DOM but by the capacity for supplying Fe ions in the basin soil. The slope of the regression lines in Figure 4 was 0.90 for the Oita River and 0.80 for the Yamakuni River, suggesting that the affinity of Fe to DOM, i.e. the ability to form a complex with Fe of the DHS, non-humic DOM, or both, was greater in the Oita River than in the
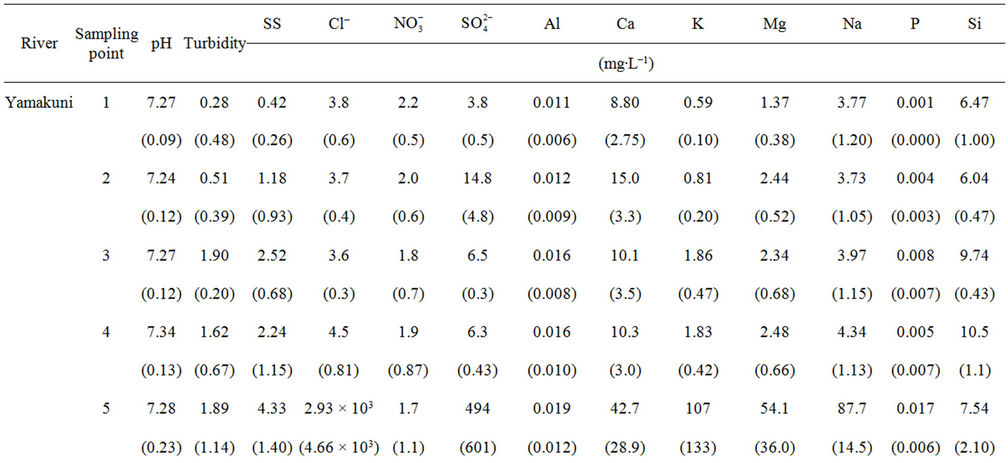
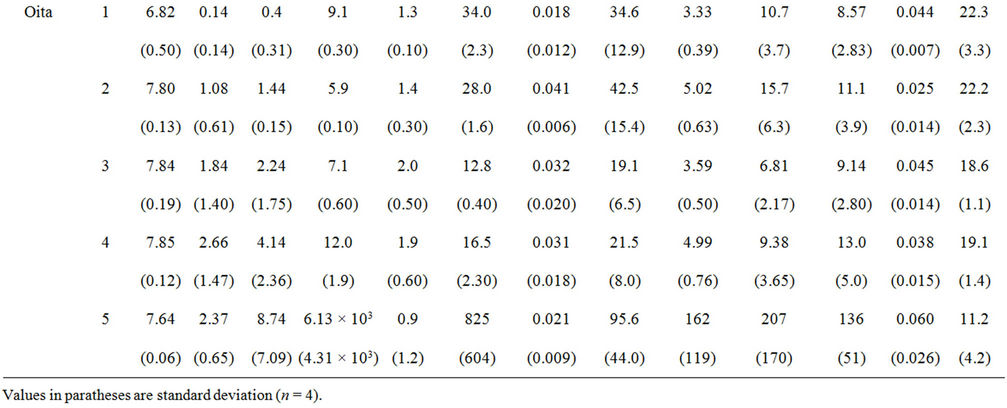
Table 2. pH, turbidity, and concentrations of suspended solids (SS), inorganic anions and dissolved elements in the Yamakuni and Oita Rivers.
Yamakuni River, since concentrations of both DHS and non-humic DOM were similar in the two rivers.
To analyze the cause of the decrease in DOM-Fe concentration at Point 5 in the Yamakuni and Oita Rivers, the mixing ratio of river water with seawater was calculated from the Cl− concentration at Point 4 and that in seawater (19.35 g∙L−1). The calculated mixing ratio range was 9% - 59% in the Yamakuni River and 6% - 68% in the Oita River. This suggests that the decreasing proportions of DOM-Fe at Point 5, 27% - 100% and 55% - 100%, were consistently greater than those due to dilution with seawater. Hence, if the DOM-Fe concentration did not change between Points 4 and 5, the removal of DOM-Fe occurred at the estuary. The decrease in DOMFe concentration at estuaries has been reported by [32] and [33]. According to [33], the decrease in DOM-Fe is due to co-precipitation with suspended particles or colloidal materials with increasing salt concentration. However, this factor did not likely affect the present results because none of several parameters—turbidity, SS, DOC, and DHS—decrease between Points 4 and 5. A possible mechanism of the decrease in DOM-Fe is the replacement of Fe with polyvalent cations in seawater, such as Ca and Mg. Although the affinity of Ca and Mg to DHS is much smaller than that of Fe, Ca and Mg may be able to compete with Fe because they are present at much higher concentrations than Fe (1000- to 45,000-times more) [34]. The smaller ratio of DOM-Fe to total Fe at Point 5 (50% - 80%) compared with those at Points 1-4 (70% - 100%) does not contradict this mechanism. Otherwise, the addition of Fe-poor DOM between Points 4 and 5 or from the coastal sea might have masked the
Figure 4. Relationship between concentrations of total dissolved Fe and DOM-Fe in the Yamakuni River (a) and the Oita River (b).
flocculation or precipitation of Fe-rich DOM. Finally, the DOM-Fe concentration at the estuary was similar between the two rivers.
5. Conclusion
DOC, DHS, and DOM-Fe concentrations in the water obtained from two rivers in Oita, Japan, showed increasing tendencies from the headstream toward downstream. Disruption of these tendencies in the middle of the Yamakuni River could be due to the influence of tributary streams. A difference in the level of soil organic matter in the watershed area did not affect the DOC or DHS concentrations in river water. The dissolved Fe concentration in river water was suggested to be controlled by the Fe-supplying capacity of soils, while that at the estuary was controlled by the solubility of DOM-Fe in seawater.
6. Acknowledgements
This research was conducted as a Forest Environmental Preservation Promotion Project by the Oita Prefectural Government. The authors are grateful to the staff members of NPO Symfosea Network for their technical assistance.
REFERENCES
- L. J. Tranvik, “Allochthonous Dissolved Organic Matter as an Energy Source for Pelagic Bacteria and the Concept of the Microbial Loop,” Hydrobiology, Vol. 229, 1992, pp. 107-114. doi:10.1007/BF00006994
- D. M. McKnight and G. R. Aiken, “Sources and Age of Aquatic Humus,” In: D. O. Hessen and L. J. Tranvik, Ed., Aquatic Humic Substances, Ecology and Biogeochemistry, Springer, Berlin, 1998, pp. 9-39.
- K. Matsunaga, T. Kawaguchi, Y. Suzuki and G. Nigi, “The Role of Terrestrial Humic Substances on the Shift of Kelp Community to Crustose Coralline Algae Community of the Southern Hokkaido Island in the Japan Sea,” Journal of Experimental Marine Biology and Ecology, Vol. 241, 1999, pp. 193-205. doi:10.1016/S0022-0981(99)00077-5
- K. Matsunaga, J. Nishioka, K. Kuma, K. Toya and Y. Suzuki, “Riverine Input of Bioavailable Iron Supporting Phytoplankton Growth in Kesennuma Bay (Japan),” Water Research, Vol. 32, No. 11, 1998, pp. 3436-3442. doi:10.1016/S0043-1354(98)00113-4
- G. Nigi, K. Kuma and K. Matsunaga, “Effect of Natural Organic-Fe(III) Complex on Iron Uptake and Growth of a Brown Alga Laminaria Religiosa Miyabe,” Fisher Scientific, Vol. 66, No. 5, 2000, pp. 986-988. doi:10.1046/j.1444-2906.2000.00156.x
- G. Deein, W. Thimdee and K. Matsunaga, “Bioavailable Colloidal Iron in River Originated from the Forest,” Marine and Freshwater Research, Vol. 53, 2002, pp. 43-47. doi:10.1071/MF00145
- S. Nagao, N. Fujitake, H. Kodama and H. Yamazawa, “Association of Am with Humic Substances Isolated from River Waters with Different Water Quality,” Journal of Radioanalytical and Nuclear Chemistry, Vol. 255, No. 3, 2003, pp. 459-464. doi:10.1023/A:1022559727286
- E. Tipping, C. R. Castro, S. E. Bryan and T. J. Hamilton, “Al (III) and Fe (III) Binding by Humic Substances in Freshwaters, and Implications for Trace Metal Speciation,” Geochimica et Cosmochimica Acta, Vol. 66, No. 18, 2002, pp. 3211-3224. doi:10.1016/S0016-7037(02)00930-4
- D. Bastviken, “Degradation of Dissolved Organic Matter in Oxic and Anoxic Lake Water,” Limnology and Oceanography, Vol. 49, No. 1, 2004, pp. 109-116. doi:10.4319/lo.2004.49.1.0109
- L. S. Wen, P. Santschi, G. Gill and C. Paterostro, “Estuarine Trace Metal Distributions in Galveston Bay: Importance of Colloidal Forms in the Speciation of the Dissolved Phase,” Marine Chemistry, Vol. 63, No. 3-4, 1999, pp. 185-212. doi:10.1016/S0304-4203(98)00062-0
- L. M. Laglera and C. M. G. van den Berg, “Evidence for Geochemical Control of Iron by Humic Substances in Seawater,” Limnology and Oceanography, Vol. 54, No. 2, 2009, pp. 610-619.
- A. L. R. Sekaly, R. Mandal, N. M. Hassan, J. Murimboh, C. L. Chakrabarti, M. H. Back, D. C. Gregoire and W. H. Schroeder, “Effect of Metal/Fulvic Acid Mole Ratios on the Binding of Ni(II), Pb(II), Cu(II), Cd(II), and Al(III) by Two Well-Characterized Fulvic Acids in Aqueous Model Solutions,” Analytica Chimica Acta, Vol. 402, 1999, pp. 211-221. doi:10.1016/S0003-2670(99)00534-6
- Committee for Soil Classification and Nomenclature, “Unified Soil Classification System of Japan (2nd Approximation): An Interim Report (7),” Pedologist, Vol. 45, 2001, pp. 65-68.
- Y. Suzuki, K. Kuma, I. Kudo, K. Hasebe and K. Matsunaga, “Existence of Stable Fe(III) Complex in Oxic River Water and Its Determination,” Water Research, Vol. 26, 1992, pp. 1421-1424. doi:10.1016/0043-1354(92)90060-H
- J. A. Leenheer, M. A. Nanny and C. McIntyre, “Terpenoids as Major Precursors of Dissolved Organic Matter in Landfill Leachates, Surface Water, and Groundwater,” Environmental Science & Technology, Vol. 37, No. 11, 2003, pp. 2323-2331. doi:10.1021/es0264089
- K. Kaiser, G. Guggenberger and W. Zech, “Organically Bound Nutrients in Dissolved Organic Matter Fractions in Seepage and Pore Water of Weakly Developed Forest Soils,” Acta Hydrochimica et Hydrobiologica, Vol. 28, No. 7, 2001, pp. 411-419. doi:10.1002/1521-401X(20017)28:7<411::AID-AHEH411>3.0.CO;2-D
- J. Hejzlar, M. Dubrovsky, J. Buchtele and M. Ruzicka, “The Apparent and Potential Effects of Climate Change on the Inferred Concentration of Dissolved Organic Matter in a Temperate Stream (the Malse River, South Bohemia),” Science of the Total Environment, Vol. 310, 2003, pp. 143-152. doi:10.1016/S0048-9697(02)00634-4
- E. Hood, M. W. Williams and D. M. McKnight, “Sources of Dissolved Organic Matter (DOM) in a Rocky Mountain Stream Using Chemical Fractionation and Stable Isotopes,” Biogeochemistry, Vol. 74, No. 2, 2005, pp. 231-255. doi:10.1007/s10533-004-4322-5
- “Oita Prefectural Forest Experiment Station, Hita and Yamakei Areas,” The Bulletin of the Soil Survey in Oita Prefecture, Vol. 5, 1976, pp. 27-32.
- Ministry of Land, Infrastructure, Transport and Tourism, Japan (MLITJ), “Water Information System. MLITJ, Tokyo,” 2002. http://www1.river.go.jp/
- “Oita Prefectural Forest Experiment Station, Kuju and Yuhu Mountain Areas,” The Bulletin of the Soil Survey in Oita Prefecture, Vol. 1, 1972, pp. 55-58.
- “Oita Prefectural Forest Experiment Station, Midland and Oita Areas,” The Bulletin of the Soil Survey in Oita Prefecture, Vol. 4, 1975, pp. 26-30.
- P. Alberic, E. Viollier, D. Jezequel, C. Grosbois and G. Michard, “Interactions between Trace Elements and Dissolved Organic Matter in the Stagnant Anoxic Deep Layer of a Meromictic Lake,” Limnology and Oceanography, Vol. 45, No. 5, 2000, pp. 1088-1096. doi:10.4319/lo.2000.45.5.1088
- M. Hiraide, S. Hiramatsu and H. Kawaguchi, “Evaluation of Humic Complexes of Trace Metals in River Water by Adsorption on Indium-Treated XAD-2 Resin and DEAESephadex A-25 Anion Exchanger,” Fresenius Journal of Analytical Chemistry, Vol. 348, No. 11, 1994, pp. 758- 761. doi:10.1007/BF00323700
- A. S. H. Derbalah, N. Nakatani and H. Sakugawa, “Distribution, Seasonal Pattern, Flux and Contamination Source of Pesticides and Nonylphenol Residues in Kurose River Water, Higashi-Hiroshima, Japan,” Geochemical Journal, Vol. 37, No. 2, 2003, pp. 217-232. doi:10.2343/geochemj.37.217
- K. M. G. Mostofa, T. Yoshioka, E. Konohira and E. Tsnoue, “Dynamics and Characteristics of Fluorescent Dissolved Organic Matter in the Groundwater, River amd Lake Water,” Water, Air, & Soil Pollution, Vol. 184, 2007, pp. 157-176. doi:10.1007/s11270-007-9405-1
- Y. Nakagawa, H. Shibata, F. Satoh and K. Sasa, “Riparian Control on NO3-, DOC, and Dissolved Fe Concentrations in Mountainous Streams, Northern Japan,” Limnology, Vol. 9, No. 3, 2008, pp. 195-206. doi:10.1007/s10201-008-0251-7
- G. Mc. D. Day, R. Beckett, B. T. Hart and I. D. McKelvie, “Characterization of Natural Organic Matter from Four Victorian Freshwater Systems,” Marine & Freshwater Research, Vol. 42, No. 6, 1991, pp. 675-687. doi:10.1071/MF9910675
- B. Martin-Mousset, J. P. Croue, E. Lefebvre and B. Legube, “Distribution and Characterization of Dissolved Organic Matter of Surface Waters,” Water Research, Vol. 31, No. 3, 1997, pp. 541-553. doi:10.1016/S0043-1354(96)00259-X
- E. Tipping, C. Woof and M. Ohnstad, “Forms of Iron in the Oxygenated Waters of Esthwaite Water, UK,” Hydrobiology, Vol. 92, 1982, pp. 383-393.
- L. E. Sojo and H. De Haan, “Multicomponent Kinetic Analysis of Iron Speciation in Humic Lake Tjeukemeer: Comparison of Fulvic Acid from the Drainage Basin and Lake Water Samples,” Environmental Science & Technology, Vol. 25, No. 5, 1991, pp. 935-939. doi:10.1021/es00017a017
- M. R. Grace, T. M. Hislop, B. T. Hart and R. Beckett, “Effect of Saline Groundwater on the Aggregation and Settling of Suspended Particles in a Turbid Australian River,” Colloids and Surfaces, Vol. 120, 1997, pp. 123- 141. doi:10.1016/S0927-7757(96)03863-0
- M. Fujii, H. Ito, A. L. Rose, T. D. Waite and T. Omura, “Transformation Dynamics and Reactivity of Dissolved and Colloidal Iron in Coastal Waters,” Marine Chemistry, Vol. 110, 2008, pp. 165-175. doi:10.1016/j.marchem.2008.04.005
- T. Hiemstra and W. H. van Riemsdijk, “Biogeochemical Speciation of Fe in Ocean Water,” Marine Chemistry, Vol. 102, No. 3-4, 2006, pp. 181-197. doi:10.1016/j.marchem.2006.03.008
Abbreviations
Dissolved organic matter (DOM)
Dissolved humic substances (DHS)
Dissolved organic matter-complexed iron/Fe (DOM-Fe)
NOTES
*Corresponding author.