Journal of Minerals and Materials Characterization and Engineering
Vol.03 No.03(2015), Article ID:56078,9 pages
10.4236/jmmce.2015.33018
Effects of Anodizing Parameters in Tartaric-Sulphuric Acid on Coating Thickness and Corrosion Resistance of Al 2024 T3 Alloy
Mohammad Zaki Mubarok1*, Wahab2, Sutarno3, Soleh Wahyudi4
1Department of Metallurgical Engineering, Faculty of Mining and Petroleum Engineering, Institut Teknologi Bandung, Bandung, Indonesia
2Department of Chemistry, Faculty of Mathematic and Natural Sciences, Halu Oleo University, Kendari, Indonesia
3Mineral and Metallurgical Engineering Specialization, Postgraduate Program of Mining Engineering, Faculty of Mining and Petroleum Engineering, Institut Teknologi Bandung, Bandung, Indonesia
4PT. Rekayasa Plating, Cimahi, Jawa Barat, Indonesia
Email: *zaki@mining.itb.ac.id
Copyright © 2015 by authors and Scientific Research Publishing Inc.
This work is licensed under the Creative Commons Attribution International License (CC BY).
http://creativecommons.org/licenses/by/4.0/


Received 14 April 2015; accepted 27 April 2015; published 4 May 2015
ABSTRACT
2024 T3 is one of aluminium alloys which are widely used in the aircraft structures. Anodizing of alluminium alloy in tartaric-sulphuric acid (TSA) electrolyte is developed to obtain more envi- ronmentally-friendly process and to produce anodize layer with better corrosion resistance. In this research work, the influences of anodizing parameters of Al 2024 T3 in TSA on the thickness, weight and corrosion resistance of the anodize layer are studied. Corrosion resistance test was carried out by conducting salt spray test for 336 hours and anodic polarization measurements using potentiostat. Results of three-factor analysis of variance (ANOVA) demonstrated that the most influencing factor that determines the thickness and weight of the anodize layer is temperature, followed by applied voltage, duration of anodizing, voltage-temperature interaction, interaction of temperature-duration of anodizing, interaction of voltage-temperature-duration of anodizing, and interaction of voltage and duration of anodizing. The pit density and corrosion current density (icorr) were found to be dependent on the coating thickness. The anodize layer with a thickness of higher than 3 μm was not experienced to pitting corrosion during 336 hours of salt spray test.
Keywords:
Aluminium Alloy, Anodizing, TSA, Corrosion, Polarisation, Pitting

1. Introduction
Aluminium alloy of 2xxx is widely used in aircraft structures due to its light weight and high specific strength [1] [2] . Alloying with elements such as copper improves mechanical properties of the alloy, but decreases its corrosion resistance due to microscopic galvanic effect [2] . In order to improve their corrosion resistance, anodizing of 2xxx series aluminium alloys in chromic acid has traditionally been used for application in aircraft structures. Chromic acid (CA) anodizing provides excellent corrosion protection to the alloy with relatively low impact on its fatigue life compared to anodization in other acid baths [2] [3] . Hexavalent chromium ions are the major component of CA electrolyte that is able to create conversion layers and gives corrosion protection in addition to that provided by aluminium oxide layer. Despite its excellent performance in providing the corrosion resistance of the anodize layer, hexavalent chromium species are known to be toxic and hazardous materials. Research efforts have been performed to replace chromates in surface treatment technology and to look for more environmentally-friendly anodizing processes [1] - [5] . During the last decade, numerous investigations of anodizing in sulphuric acid and boric acid have been made for replacing CA anodizing. Anodizing in dilute sulphuric acid (DSA) is performed to obtain thin anodize layer (1 - 5 mm) that gives lower impact on the fatigue strength of the alloy. However, despite an improvement of fatigue strength of the alloy, its corrosion resistance is still lower than the alloy being anodized in CA [6] .
Anodization of aluminium alloy in tartaric-sulphuric acid (TSA) is recent development for chromate-free anodizing that is regarded as environmentally-friendly, offering shorter duration of electrolysis and producing excellent corrosion resistance [1] - [3] . Following Curioni et al. [7] , tartaric acid (C4H6O6) reduces the growth rate of porous oxide film during TSA anodizing without significantly affecting the mechanism of the porous film formation. It was reported that tartaric acid forms residue in pore solution of the anodize film which limits anodic reaction of aluminium dissolution in nearly neutral, chloride-rich environment [7] . Boisier et al. [6] have conducted FESEM and EIS study of sealed AA2024 T3 alloy anodized in sulphuric acid electrolyte to investigate the influence of tartaric acid on anodic film morphology and on corrosion resistance of hydrothermally sealed anodized alloy. It was concluded that the presence of tartaric acid results in the formation of anodic films with lower porosity than those produced by DSA anodizing. The EIS study revealed that corrosion resistance of sealed anodize film in TSA is significantly better than the sealed film obtained by DSA anodizing which is mainly associated with the higher compactness of the porous layer and higher resistance of the hydrothermally- sealed barrier layer [6] .
Despite known beneficial effect of tartaric acid addition in sulphuric acid bath in improving corrosion resistance of the aluminium alloy, the effect of anodizing parameters during TSA anodizing (i.e. temperature, voltage, and duration of electrolysis) on the coating properties is still poorly reported. At the present paper, the effects of anodizing parameters of Al 2024 T3 Alloy in TSA solution on the coating weight, thickness, surface morphology and its corrosion resistance are discussed. Three-factor analysis of variance method (ANOVA) is conducted to evaluate the most influential parameters that affect the coating thickness and weight as well as its corrosion resistance.
2. Experimental
The specimens, chemicals for surface preparation and the electrolyte were kindly donated by PT. Dirgantara Indonesia, the only aircraft manufacturing company in Indonesia. Chemical composition of AA 2024 T3 aluminium alloy used in the investigations is presented in Table 1. The specimens have dimensions of 80 × 30 × 1 mm3. Prior to be anodized, the specimens were subjected to series of surface preparation. The specimens were polished by SiC abrasive paper (i.e. from 1000 to 2000 grid), ultrasonic-cleaned in alcohol 95%, washed with distilled water and then air dried. Degreasing was then carried out by using a commercial alkaline cleaner bath of Turco 4215 NCLT® at 50˚C for 15 minute. At the final stage of the surface preparation, the specimens were dipped in Ardrox 295 GD® at room temperature for 5 minute. The major component of Ardrox 295 GD® solution is nitric acid (HNO3) which was used to remove residual oxide layer on the surface of the specimens prior to be anodized. After each step of the surface preparation, the specimens were rinsed by distilled water.
Series of anodizing experiments in TSA solution were carried out under variations of applied voltages (10 V, 15 V, 20 V), temperatures (20˚C, 30˚C, 40˚C) and duration of anodizing (20, 40, 60 minute). The electrolyte used was 1500 mL TSA which contains 44.7% (v/v) tartaric acid (C4H6O6) 80 wt% and 21.7% (v/v) 40 wt% sulphuric acid (H2SO4). After anodizing was finished, sealing was performed by immersing the anodized speci-

Table 1. Chemical composition of AA2024 T3 aluminium alloy used in the investigation.
men in Alodine® solution for 1 minute. The thickness of anodize layer was measured at three different points, namely on the top, middle and bottom of the surface of the anodized specimens by using elcometer that works based on eddy current measurements. Analysis using scanning electron microscope (SEM) and energy-disper- sive X-ray (EDX) was performed to elucidate the surface morphology of the anodize layer and its chemical composition.
Corrosion resistance of the anodize layer was measured by conducting salt spray tests for 336 hour and cyclic- anodic polarization measurements using potentiostat. The salt spray test was aimed at evaluating the resistance of the anodize layer to pitting corrosion and measuring the pit density (i.e. the number of pit per unit area), while polarization measurements using potentiostat is done to obtain corrosion parameter data which include corrosion current density (icorr), corrosion potential (Ecorr) and pitting potential (Epit). The specimens for polarization measurements were mounted in resin and have active area of 1 cm2 prior to be anodized and used in the polarization measurements. The polarization measurements were done in solution which contains 35.6 gram/liter of NaCl. saturated calomel electrode (SCE) and a graphite rod were used as reference electrode and counter-electrode, respectively. Three-factor analysis of variance (ANOVA) was performed to evaluate the significance influences of applied voltage (A), temperature (B) and duration of anodizing (C), as well as the interactions between these variables on the thickness, weight and corrosion resistance of the anodize layer.
3. Results and Discussion
3.1. Correlation between Anodizing Current Density and Applied Voltage
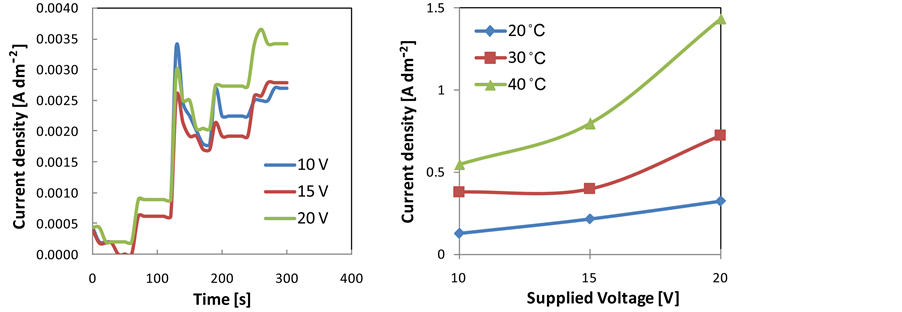
Applied voltages were raised from open circuit potential (OCP) with a sweep potential of 2 V/min up to holding voltages of 10, 15, and 20 V for 20, 40, and 60 minute at 20˚C, 30˚C, and 40˚C. Current flow through the cell during anodizing was measured. Profiles of current density versus time recorded during the first 300 minute of anodizing under variations of applied voltages at 20˚C and averages current density versus applied voltages at temperatures of 20˚C, 30˚C and 40˚C are depicted in Figure 1(a) and Figure 1(b), respectively. Profiles of current density follows general trend of that commonly observed during anodizing of aluminium alloy. The alterations of current density during initial periods of anodizing indicate stages occur during the formation of anodize layer. As applied voltage was increased from 0 to target voltages (i.e. 10, 15 and 15 V) with ram rate of 2 V/min, the currents fluctuate. This fluctuation indicates simultaneous formations of barrier layer and porous layer on the surface of the specimen. The porous layer forms due to partial dissolution of Al2O3 layer in acidic solution. As the voltage reaches the targeted voltage, the current density slightly increases then decreases and finally constant at certain level as illustrated by Figure 1(a). At a constant current density, the growth of barrier layer and porous layer performs at steady state. The current density increases by the increased of applied voltage and anodizing temperature as illustrated by Figure 1(b). Increasing temperature reduces electrolyte resistance that consequently enhances current flow through the circuit at certain voltage.
3.2. Effect of TSA Anodizing Parameters on Thickness and Weight of the Anodize Layer
Applied voltage is one of key factors that determine the thickness and weight of anodize layer. The influences of applied voltage on the thickness and weight of anodize layer are shown in Figure 2 and Figure 3, respectively. The increase of applied voltage resulted in an enhanced of current density as has been illustrated in Figure 1(b).
 (a) (b)
Figure 1. (a) Profiles of current density versus time recorded during the first 300 minute of anodizing under variations of applied voltages at 20˚C; (b) Averages current density versus applied voltages at temperatures of 20˚C, 30˚C and 40˚C.
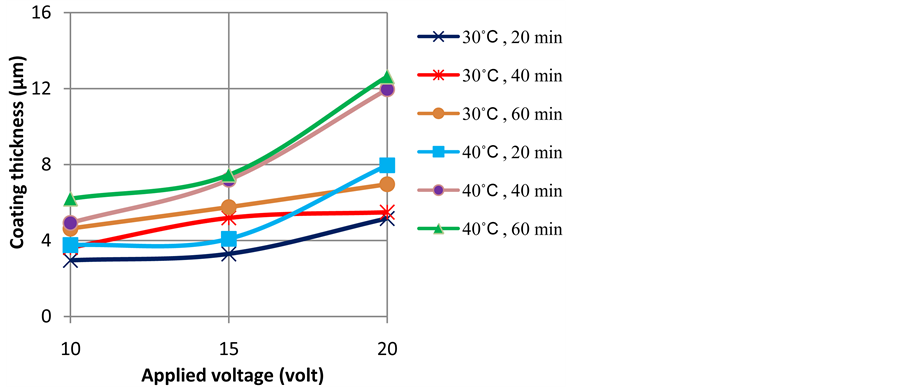
Figure 2. Profiles of coating thickness as a function of applied voltage at temperatures of 30˚C and 40˚C and various anodizing time.
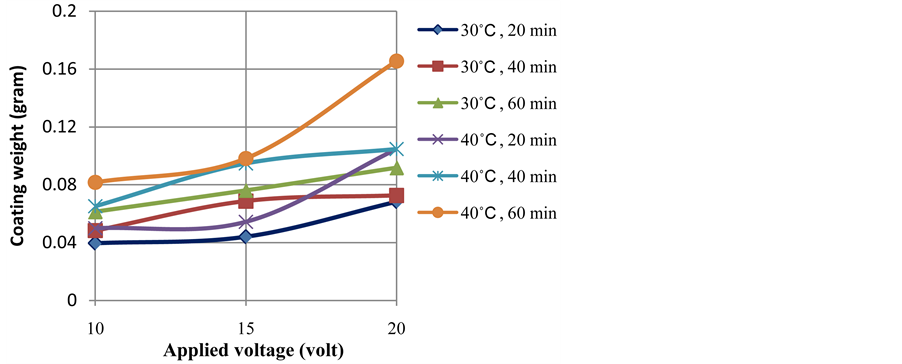
Figure 3. Profiles of coating weight as a function of applied voltage at temperatures of 30˚C and 40˚C and various anodizing time.
Current flows through electrolyte are associated with ionic mobility in the electrolyte. The formation of anodize layer (Al2O3) is contributed by O2− ion from water decomposition (3H2O → 3O2− + 6H+) in the interface of anodize layer and the electrolyte and Al3+ from the oxidation of the surface of aluminium alloy (2Al → 2Al3+ + 6e−) takes place at the interface of the alloy and the oxide layer. A higher applied voltage leads to a higher O2− and Al3+ mobility and resulted in the higher coating thickness and weight after certain time of anodizing as can be seen in Figure 2 and Figure 3.
Figure 4 and Figure 5 show the effect of temperature on the thickness and weight of anodize layer, respectively. It can be seen that the increase of temperature tends to increases the thickness and weight of anodize layer. The effect of anodizing temperature is associated with the mass transfer rates of O2− and Al3+ ions during coating formation. The increased of temperature accelerates inward diffusion of O2− ions through oxide layer that further reacts with Al3+ ions to form Al2O3 layer at the interface of the alloy and the oxide layer. Similarly, the enhanced of temperatures also accelerates outward diffusion of Al3+ ions from the surface of the alloy to the interface of oxide layer-electrolyte that further react with O2− ions at the interface of oxide layer-electrolyte. However, there has been a certain level of anodizing temperature, beyond which the increased of temperature would give negative impact to the thickness and weight of anodize layer due to overheating. At this condition, the dissolution of anodize layer takes preferentially than the formation of the anodize layer, thus results in porous anodize layer with lower thickness [8] [9] .

Figure 4. Profiles of coating thickness as a function of anodizing temperatures and duration of anodizing at applied voltage of 15 and 20 V.

Figure 5. Profiles of coating weight as a function of anodizing temperature and duration of anodizing at applied voltages of 15 and 20 V.
Based on the results of three-factor analysis of variance (ANOVA), the most influential factor that determines the thickness and weight of the anodize layer is temperature (B), followed by applied voltage (A), duration of anodizing (C), interaction of voltage and temperature (AB), interaction of temperature and anodizing duration (BC), interaction of voltage-temperature-anodizing duration (ABC), and interaction of voltage and anodizing duration (AC). Correlations between applied voltage (x1), duration of anodizing (x2) and interaction between these parameters (x1x2) and the thickness and weight of anodize layer for anodizing temperatures of 20˚C, 30˚C and 40˚C are presented in Table 2 and Table 3, respectively.
3.3. Effect of TSA Anodizing Parameters on Corrosion Resistance of the Anodize Layer
Applied voltage during TSA anodizing was found to have notable influence on the corrosion resistance of Al 2024 T3 aluminium alloy. Cyclic-anodic polarization curves of un-anodized and anodized specimens at various applied voltage in 35.6 g/l NaCl solution at room temperatures are presented in Figure 6. It can be seen that anodized specimens have significantly lower corrosion current density (icorr) in comparison to that of un-ano- dized. The specimen being anodized at applied voltage of 10 V, temperature 30˚C for 60 minute exhibits the lowest corrosion current density among the anodized specimens with various voltages at similar anodizing temperature and time. Polarization behaviour of the anodized specimens is correlated with the quality of the anodize layer, specifically its porosity. As the anodize layer of Al2O3 is electrically non-conductive, more porous layer will result in higher corrosion and passivation current densities. In this regard, anodizing at 10 V, temperature 30˚C for 60 minute gives the best anodize layer that have the lowest corrosion and passivation current densities in comparison to those done at 15 and 20 V under similar temperature and anodizing time. Following the investigation results of Sabry and Alobaid [9] , anodizing at lower voltage leads to the formation of thicker barrier layer and smaller pore size. Smaller pore size reduces the sites that can be occupied by chloride ions that initiate pitting corrosion. In addition to the anodizing variables, the effectiveness of sealing after anodizing would also affect the corrosion resistance of the anodize layer. If the sealing process does not properly close the pores of anodize layer, chloride ions will penetrate and being accumulated within the pores of the anodize layer and starts to depassivate the anodize layer.
Figure 7 shows cyclic-anodic polarization curves of un-anodized and anodized specimens from anodizing at various temperatures, applied voltage of 10 V and anodizing duration of 40 minute. It was found that anodizing temperature of 30˚C gives the best corrosion resistance of the anodized specimen which is represented by the lowest corrosion current density, followed by anodizing at 20˚C and 40˚C. Cyclic-anodic polarization measurements were also carried out on anodized specimens resulted from the anodizing with various durations at applied voltage of 15 V and temperature 40˚C. It was found that thicker anodize layers resulted by longer anodizing times exhibits better corrosion resistance indicated by lower corrosion current densities. It is clearly understood that the thicker the anodize layer, the longer the aggressive ions reach the surface of the specimen. However, the thickness of the anodize layer is not the solely factor that determines the corrosion resistance of the specimen and it is still dependent on the quality of the anodize layer, specifically its porosity. Based on the thickness data
Table 2. Correlation between applied voltage, duration of anodizing and interaction between them with the thickness of anodize layer for anodizing temperatures of 20˚C, 30˚C and 40˚C.
in which R is correlation coefficient and S represents error level of the calculation.
Table 3. Correlation between applied voltage, duration of anodizing and interaction between them with the weight of anodize layer for anodizing temperatures of 20˚C, 30˚C and 40˚C.
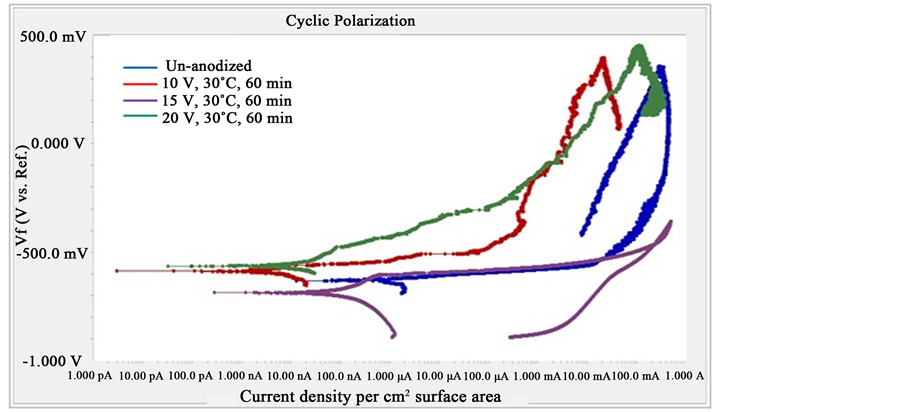
Figure 6. Cyclic-polarization of un-anodized and anodized specimens from anodizing at various applied voltages at 30˚C for 60 minute.
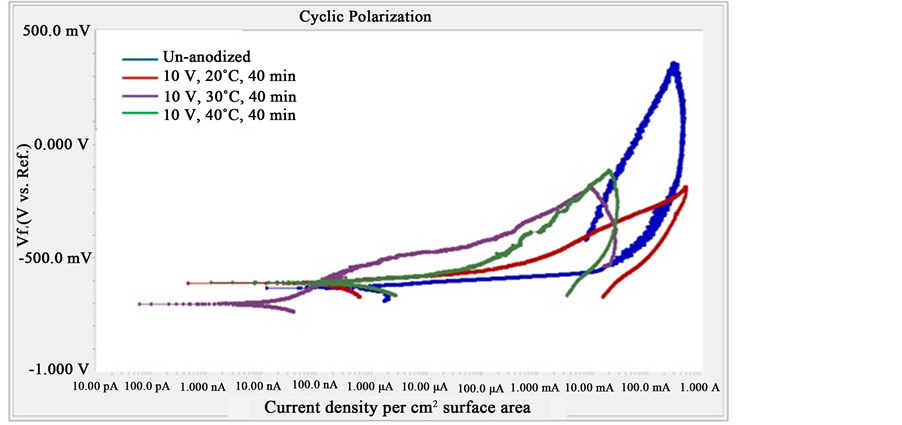
Figure 7. Cyclic polarization of un-anodized and anodized specimens under various temperatures at applied voltages of 10 V and anodizing time 40 minute.
obtained at various applied voltage, temperature and anodizing time, the thickness of anodize layer has low correlation with corrosion current density with R2 of 0.057 as can be seen in Figure 8.
Results of salt spray tests for 336 hour show that the anodized specimens with thicknesses of more than 3 μm did not exhibit pitting (Figure 9). This is in contrast to un-anodized specimen which was severely experienced to chloride attack. Based on ANNOVA result, it was found that anodizing temperature is the most decisive factor determined the resistance of the anodize layer to pitting corrosion. The highest pit density was obtained on the anodize layer from the anodizing at temperature of 20˚C, while the anodize layers produced by anodizing temperatures of 30˚C and 40˚C were not experienced to pitting corrosion after 336 hour of salt spray tests. Based on ANNOVA result, correlation between applied voltage (x1) and duration of anodizing (x2) as well as interaction between them and the pit density (y) for anodizing temperature of 20˚C is as follow:

The salt spray test results demonstrated that TSA anodizing of Al 2024 T3 specimens resulted in the anodize
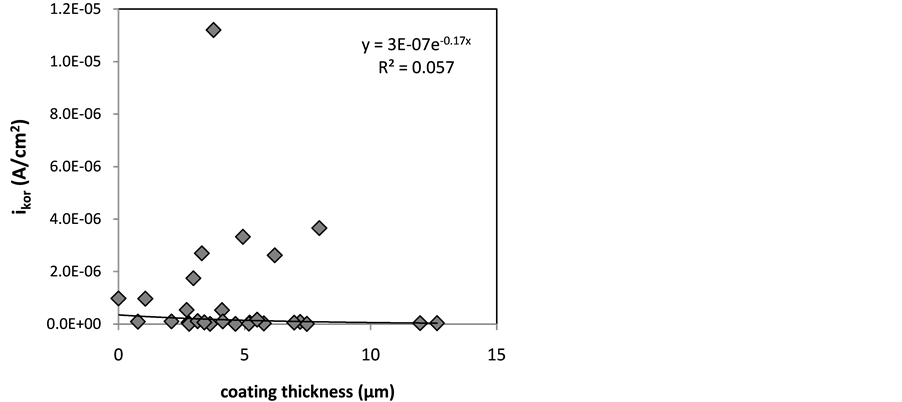
Figure 8. Correlation between corrosion current density versus coating thickness.
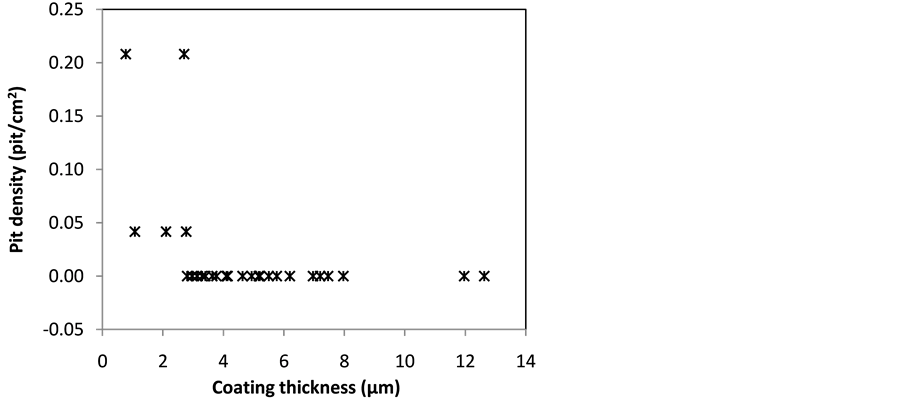
Figure 9. Correlation between pit density versus coating thickness.
layer which meets the standard specification of Military Specification Anodizing (MIL-A-8625) with pit number of less than 15 per 9 dm2 or 5 pit per 2 dm2 after being subjected to salt spray test for 336 hour.
3.4. Surface Morphology of the Anodize Layer
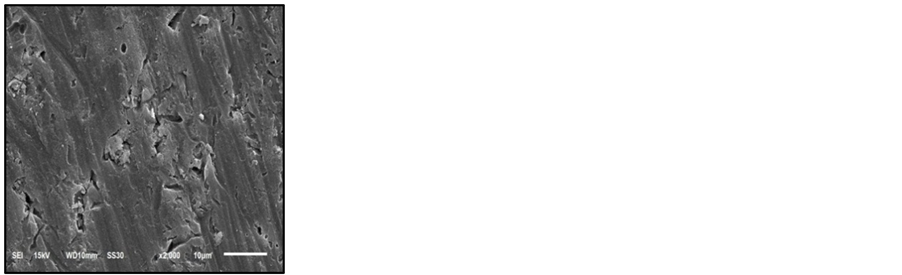
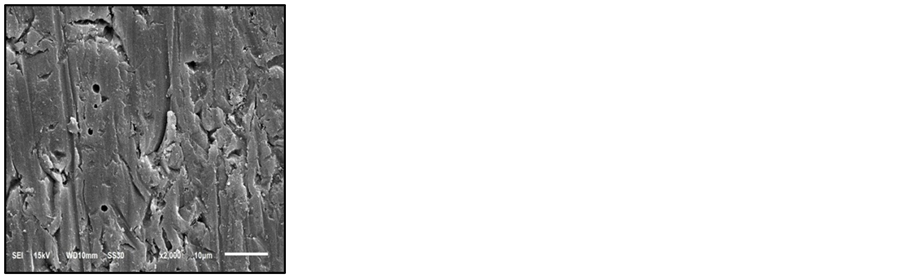
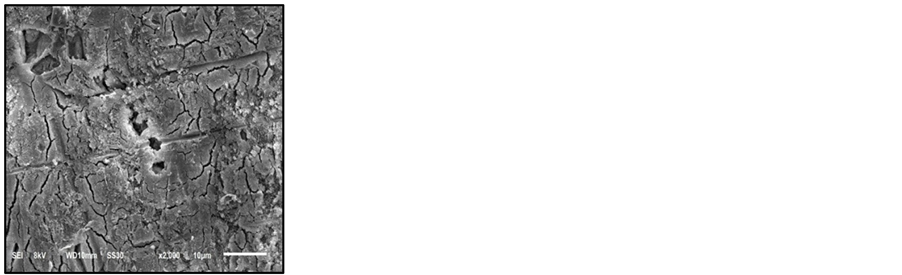
Effect anodizing temperature on the surface morphology of the anodize layer was evaluated by surface analysis of the anodized specimens from different temperature by scanning electron microscope (SEM). SEM micrographs of the surface of anodized layers obtained from anodizing at various temperatures, applied voltage of 15 volt for 40 minutes are presented in Figures 10(a)-(c). The surface of anodized specimen from anodizing at 20˚C exhibits the most compact layer with fewer surface pores. At lower anodizing temperature, dissolution of oxide layer takes place slower than that at higher temperatures which results in fewer pores and more compact layer. Microcracks were detected on the surface of anodize layer from anodizing at 40˚C (Figure 10(c)). These microcracks are associated with local heat effect on the surface of the anodize layer at high local current density and temperature. The local heat causes an inhomogeneous electric field distribution that leads to local breakdown of the oxide layer [10] [11] . Hence, it is demonstrated that temperature is the most decisive factor that must be carefully controlled during anodizing.
 (a) (b) (c)
Figure 10. SEM micrographs of the surface of anodize layer obtained from anodizing with applied voltage of 15 volt for 40 minutes at (a) 20˚C; (b) 30˚C and (c) 40˚C.
4. Conclusion
Results of three-factor analysis of variance (ANOVA) revealed that the most influencing factor determining the thickness and weight of the anodize layer is temperature, followed by applied voltage, duration of anodizing, interaction of voltage and temperature, interaction of temperature and anodizing duration, interaction of voltage- temperature and anodizing duration and interaction of applied voltage-anodizing duration. Corrosion current density (icorr) and pit density were found to be dependent on the coating thickness. The anodize layer with a thickness of higher than 3 μm was not experienced to pitting during 336 hours of salt spray test. The anodizing process of Al 2024 T3 aluminium alloy in TSA offers an alternative to chromic acid which uses organic acid rather than poisonous chromium species, operated at lower temperatures and results in the anodize layer which has excellent corrosion resistance. Based on the data of pit density obtained from salt spray test for 336 hours, the anodize layer meets the standard specification of MIL-A-8625 with pit number of less than 15 per 9 dm2 or 5 pit per 2 dm2.
Acknowledgements
The authors thank PT. Dirgantara Indonesia for providing Al 2024 T3 specimen, chemicals for surface treat- ments and the electrolyte used in this investigation.
References
- Rubio, M.G., et al. (2009) Influence of Molybdate Species on the Tartaric Acid/Sulphuric Acid Anodic Films Grown on AA2024 T3 Aerospace Alloy. Corrosion Science, 51, 2034-2042. http://dx.doi.org/10.1016/j.corsci.2009.05.034
- Capelossi, V.R., Poelman, M., Hernandez, R.P.B., Melo, H.G.D. and Olivier, M.G. (2014) Corrosion Protection of Clad 2024 Aluminum Alloy Anodized in Tartaric-Sulfuric Acid Bath and Protected with Hybrid Sol-Gel Coating. Electrochimica Acta, 124, 60-79. http://dx.doi.org/10.1016/j.electacta.2013.09.004
- Rubio, M.G., et al. (2009) Effect of Postreatment on the Corrosion Behaviour of Tartaric-Sulphuric Anodic Films. Electrochimica Acta, 54, 4789-4800. http://dx.doi.org/10.1016/j.electacta.2009.03.083
- Harscoet, E. and Froelich, D. (2008) Use of LCA to Evaluate the Environmental Benefits of Substituting Chromic Acid Anodizing (CAA). Journal of Cleaner Production, 16, 1294-1305. http://dx.doi.org/10.1016/j.jclepro.2007.06.010
- Zhang, J., Zhao, X., Zuo, Y. and Xiong, J. (2008) The Bonding Strength and Corrosion Resistance of Aluminum Alloy by Anodizing Treatment in a Phosphoric Acid Modified Boric Acid/Sulfuric Acid Bath. Surface & Coating Technology, 202, 3149-3156. http://dx.doi.org/10.1016/j.surfcoat.2007.10.041
- Boisier, G., Pébère, N., Druez, C., Villatte, M. and Suel, S. (2008) FESEM and EIS Study of Sealed AA2024 T3 Anodized in Sulfuric Acid Electrolytes: Influence of Tartaric Acid. Journal of the Electrochemical Society (JES), 155, 521-529. http://dx.doi.org/10.1149/1.2969277
- Curioni, M., Skeldon, P., Koroleva, E., Thompson, G.E. and Ferguson, J. (2009) Role of Tartaric Acid on the Anodizing and Corrosion Behavior of AA 2024 T3 Aluminum Alloy. Journal of the Electrochemical Society (JES), 156, 147-153. http://dx.doi.org/10.1149/1.3077602
- Theohari, S. and Kontogeorgou, C. (2013) Effect of Temperature on the Anodizing Process of Aluminum Alloy AA 5052. Applied Surface Science, 284, 611-618. http://dx.doi.org/10.1016/j.apsusc.2013.07.141
- Sabry, R.S. and Alobaid, R. (2012) Effect of Preparation Conditions on Anodic Aluminium Oxide (AAO) Shape’s and Size. International Journal of Science and Research (IJSR), 3, 866-872.
- Aerts, T., Jorcin, J.B., Graeve, D.I. and Terryn, H. (2010) Comparison between the Influence of Applied Electrode and Electrolyte Temperatures on Porous Anodizing of Aluminium. Electrochimica Acta, 55, 3957-3965. http://dx.doi.org/10.1016/j.electacta.2010.02.044
- Aerts, T., De Graeve, I. and Terryn, H. (2008) Study of Initiation and Development of Local Burning Phenomena during Anodizing of Aluminium under Controlled Convection. Electrochimica Acta, 54, 270-279. http://dx.doi.org/10.1016/j.electacta.2008.08.004
NOTES

*Corresponding author.