Journal of Minerals and Materials Characterization and Engineering
Vol.1 No.4(2013), Article ID:35100,7 pages DOI:10.4236/jmmce.2013.14026
Comparative Kinetics of Iron Ore Dissolution in Aqueous HCl-HNO3 System
Mineral Processing Unit, Department of Chemistry, Federal University of Technology, Owerri, Nigeria
Email: *gonyedik@mtu.edu
Copyright © 2013 Onyedika Gerald et al. This is an open access article distributed under the Creative Commons Attribution License, which permits unrestricted use, distribution, and reproduction in any medium, provided the original work is properly cited.
Received April 2, 2013; revised May 4, 2013; accepted May 16, 2013
Keywords: Kinetics; Dissolution; Iron Ore; Shrinkage Core Model
ABSTRACT
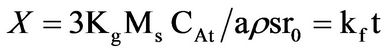
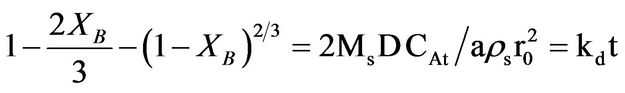
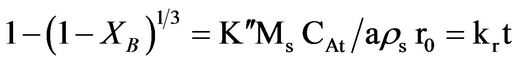
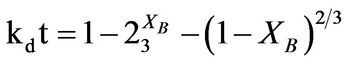
The dissolution kinetics of the dissolution of iron ore in aqueous HCl/HNO3 solution was studied. The elemental composition of the ore was carried out using the inductively coupled plasma-optical emission spectrophotometer (ICP-OES). The result showed that the iron ore contain; Fe (62.1%), O (21.7%), Cu (11.1%), Mg (2.39%), Na (1.51%), Mn (1.47%), K (0.78%), Ca (0.58%) and Zn (0.01%). It was determined that the dissolution rate increased with increased solution concentration, temperature, time and decreased particle size of the ore. The optimum conditions for effective dissolution of 88% of the iron ore were found to be 8 M of the solution, 353 K, 100 min and ore particle size of less than 75 µm. The kinetic evaluation of the dissolution process was studied using three different shrinking core models (SCM); Film diffusion: kft = XB; interfacial chemical reaction krt =  and ash/product layer diffusion: kdt =
 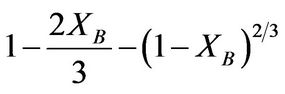 for spherical materials was performed. The results obtained showed that the rate determining step for the dissolution process was the product layer diffusion and therefore, the reaction followed this mechanism. The apparent activation energy (Ea) and the order of reaction were found to be 20.48 kJ/mol and 0.7 respectively.
1. Introduction
Dissolution processes have been extensively utilized to separate valuable minerals from their ores. Several researches [1-5] have been carried out on either the dissolution or both the dissolution and kinetic study of iron ore in different reagents such as HCl, H2SO4, oxalic acid et cetera. It was observed that the dissolution of iron ore or even the extraction of iron from an ore containing it increases as the concentration, temperature, time and stirring speed increases but decreases as the particle size increases due to its decreasing surface area [3-5]. Baba et al. [1,2] observed that iron ore dissolves easily and more efficiently in HCl than in H2SO4 or HNO3 and it was believed to be as a result of ferric-chloride complexes formation. It therefore required less energy for the reaction to occur comparing the activation energies of 13.63 kJ/mol in HCl and 38.29 kJ/mol in H2SO4 respectively. The kinetic study of these dissolutions reaction processes were carried out using the shrinking core models to interpret the processes involved in either the leaching or dissolution [1,3,4,6]. During the leaching process, three major steps occur; diffusion or mass transfer through the liquid film surrounding a solid particle, chemical reaction on the surface of the un-reacted core, and diffusion through the ash/inert solid layer. The slowest between these steps is considered the rate determining step. The model first developed by Yagi and Kunii [6-8] helped to derive the rate determining step from the experimental data using the equations below:
 (1)
(1)
 (2)
(2)
 (3)
(3)
where Kf, Kd, and Kr are the rate constants for the liquid film diffusion, ash/inert solid layer diffusion, and surface chemical reaction respectively. XB is the fraction reacted, MS is the molecular weight of the solid, CA is the concentration of the dissolved lixiviant A in the bulk of the solution, “a” is the stoichiometric coefficient of reagent in the leaching reaction, r0 is the initial radius of the solid particle, ρs is the density of the solid, D is the diffusion coefficient in the porous product layer, Kg is the mass transfer coefficient between fluid and solid particle, “K” is the first-order rate constant for the surface reaction and t is the contact time. This research work is intended to study the dissolution of iron ore in a 3:1 HCl-HNO3 system (similar to aqua regia) which is a well known reagent for dissolving un-reactive metal minerals such as gold, silver, et cetera and also the kinetic evaluation using three different shrinking core models (SCM). So far, there is no data to this effect viz-a-viz the use of Nigerian iron ore is concerned.
2. Materials and Methods
2.1. Materials
Iron ore from the Toto Muro iron ore deposit in Nasarawa State of Nigeria was used for this study. Chemical analysis of the sample ore was done with Leeman Model of Inductively coupled plasma-optical emission spectrophotometer. Different particle sizes (<75 µm, 75 µm, 125 µm and 150 µm) were obtained with the use of 8 inch diameter size mechanical sieve shaker. Distilled water and analytical grade chemicals (BDH) were used as provided to prepare all the solutions.
2.2. Methods
Particle sizes of less than 75 µm sample of the iron ore was used for the experiment at a constant concentration HCl-HNO3 solution and a fixed temperature of 331 K but at different contact time. 1.0 g of the given particle size sieve sample was weighed and then transferred into a 250 ml beaker containing 15 ml of 8 M HCl and 5 ml of 8 M HNO3 and made to 100 ml with distilled water. The mixture was agitated manually with a glass stirrer. The mixture was stirred and heated to 331 K for various contact times of 20, 30, 60 and 100 min. At the end of each period, the solution was cooled and filtered into a 100 ml standard flask and analyzed.
The same procedure was also repeated for different acid (HCl-HNO3) concentrations of 4 M, 2 M and 1 M at 331 K for 20, 30, 60 and 100 min. This same procedure described above was repeated for 343 K and 353 K for 20, 30, 60 and 100 min with 8 M acid concentration. The following particle size fractions were examined 75 µm, 125 µm and 150 µm at a fixed temperature of 353 K for 30 min with 8 M acid concentration. The kinetics of the ore dissolution was also investigated for the effects of temperature, acid concentration, particle size and contact time.
3. Results and Discussion
3.1. Chemical Analysis
The iron ore was analyzed chemically using the inductively coupled plasma-optical emission spectrophotometer and the results are shown in Table 1. The primary elements found in the sample included 62.10% Fe, 21.7% O, 11% Cu. Other elements such as Mn, Mg, K, Ca et cetera make up the 5.2% of the sample. From these analytical results, it is concluded that the ore was an iron ore.
3.2. Effect of Acid Concentration
The effect of 3:1 HCl-HNO3 solution concentration on the dissolution of the iron ore was studied using the following concentrations; 1 M, 2 M, 4 M, and 8 M. Figure 1 is the graphical presentation of the result. From the figure, it can be seen that the iron dissolution rate increases as the concentration of the HCl-HNO3 system increases from 1 M to 8 M at the same contact time. The optimum dissolution of 81% iron was achieved at the system concentration of 8 M.
3.3. Effect of Temperature and Time
The effects of temperature and contact time on iron dissolution were studied at varying temperatures (331 K, 343 K and 353 K) and at varying time (20 min, 30 min, 60 min, and 100 min). The results are shown in Figure 2. From Figure 2 it is observed that as the temperature increases, dissolution of the iron increased with tempera-
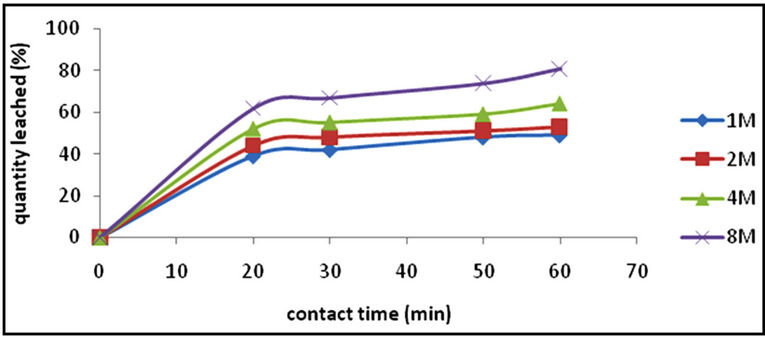
Figure 1. A graph of quantity of iron leached (%) vs contact time (min) with respect to concentration [particle size, <75 µm; temperature, 351 K; mass of ore, 1 g].
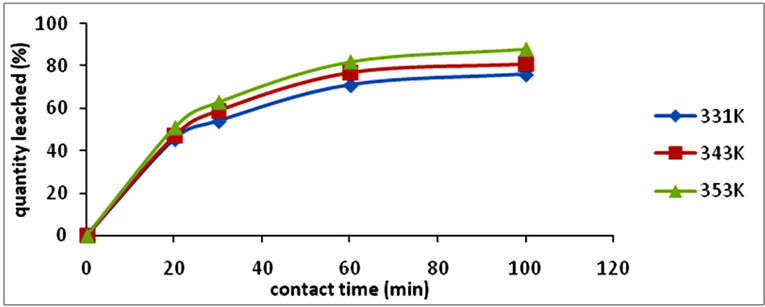
Figure 2. A graph of iron leached (%) vs contact time (min) with respect to temperature [particle size, <75 µm; conc., 8 M; mass of ore, 1 g].

Table 1. Elemental analysis of the iron ore sample.
ture and period of contact. When the temperature was increased from 331 K to 343 K at a particular period (20 min) only 2.5% increase in the quantity of iron leached was achieved. At temperature 331 K, there was 8.5% increase in the quantity of iron leached. Optimum temperature and period was found to be 353 K and 100 min respectively in which 88% of the iron was leached.
3.4. Effect of Particle Size
Table 2 shows the experimental data when different particle sizes were investigated at 8 M HCl-HNO3 solution, temperature of 353 K and contact time of 60 min. Four particle sizes were studied—<75 µm, 75 µm, 125 µm and 150 µm and from the data it was observed that the smallest particle size (<75 µm) gave the highest percentage of iron leached (87%) which is expected due to higher surface area for smaller particle size.
3.5. Kinetic Analysis
The dissolution of the iron ore under study was analyzed using the shrinking core model (SCM) based on the assumption that the material is spherical [3,6,9] and the linearization of a plot of iron dissolved at various temperature and at various contact time was investigated using the three common shrinking core model for spherical material [6]. The Equations (1), (2), and (3) for the models are;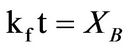 ,
,  ,
,
 respectively used to test the best fit for the experimental data in which the slowest step is the rate determining step. Where Equations (1)-(3) are film diffusion control mechanism, interfacial chemical reaction control mechanism and ash/product layer diffusion control mechanism respectively with kf, kr and kd as their respective rate constants, t is contact time and XB is the fraction of iron leached. The activation energy and the order of reaction were also calculated.
3.6. Determination of the Reaction Mechanism
The fraction of iron dissolved (XB) obtained from the Figure 2 with respect to the various contact time for various temperature was substituted into Equations (1)-(3) and the results are recorded in Table 3. The respective plots of the film diffusion, interfacial chemical reaction and product/ash layer diffusion control mechanisms vs contact time with respect to temperature is given in Figures 3-5. Table 4 give a comparative values of the rate
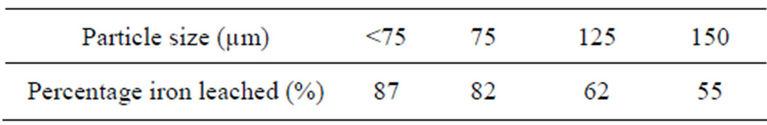
Table 2. Percentage of iron leached at varying particle sizes. [Temp., 353 K; contact time, 60 min; mass of ore, 1 g].
constants kf, kr and kd and their respective regression correlation coefficients (R2). From the values of the apparent rate constants and their respective R2 values, it is observed that the experimental data best fit the product/ash layer diffusion control mechanism and therefore is the rate determining step.
3.7. Activation Energy
The relationship between the rate constant kd and the temperature is given by the Arrhenius equation given by the expression;
 (4)
(4)
where A is the frequency factor and Ea is the apparent activation energy.
The rate constants were calculated from Figure 5 which is the slopes from the graph and are given in Table 5. To determine the activation energy for the dissolution of the iron ore in HCl-HNO3 system, an arrehnius graph of lnkd vs 1/T (K−1) was plotted which an Arrhenius plot is obtained and the activation energy also obtained from the slope of the graph (Figure 6) using Equation (4) to obtain Equation (5).
 (5)
(5)
This is equivalent to y = mx + c and therefore the slope from the graph of lnkd vs 1/T (K−1) is equivalent to Ea/R, which means Ea = slope × R.
From Figure 6 the apparent activation energy was calculated to be 20.46 kJ/mol which is within the range of activation energy for product layer diffusion controlled mechanism.
3.8. Order of Reaction
The results from the effect of acid concentration in Figure 1, was applied to Equation (2) which is the product layer diffusion controlled process as was determined to be the mechanism for the reaction and the results are recorded in Table 6. They were used in making a plot against time in Figure 7 to obtain the kd values.
The kd values were used to plot a graph of lnkd vs ln[HCl-HNO3] as shown in Figure 8 from which the
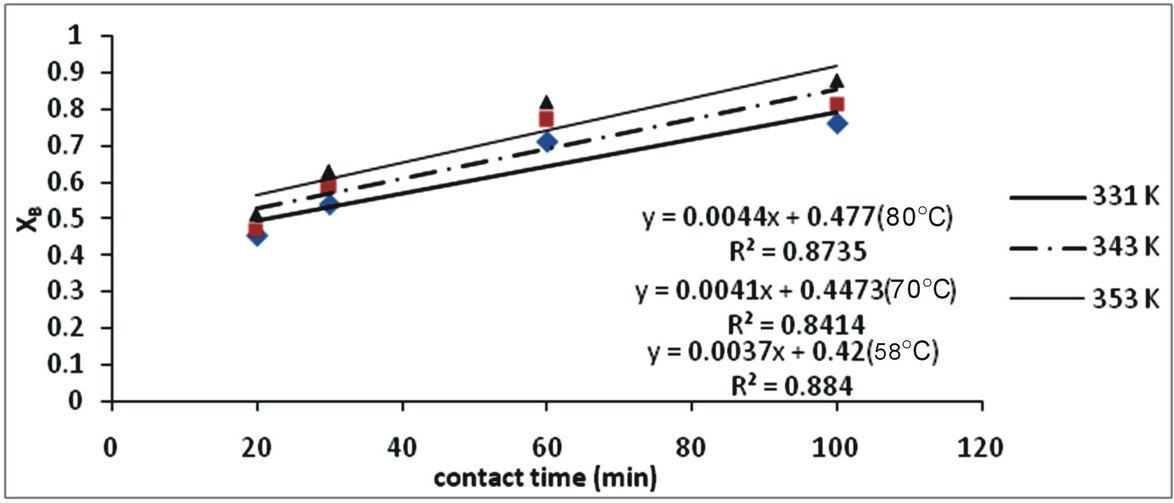
Figure 3. Plot of XB vs contact time with respect to temperature.
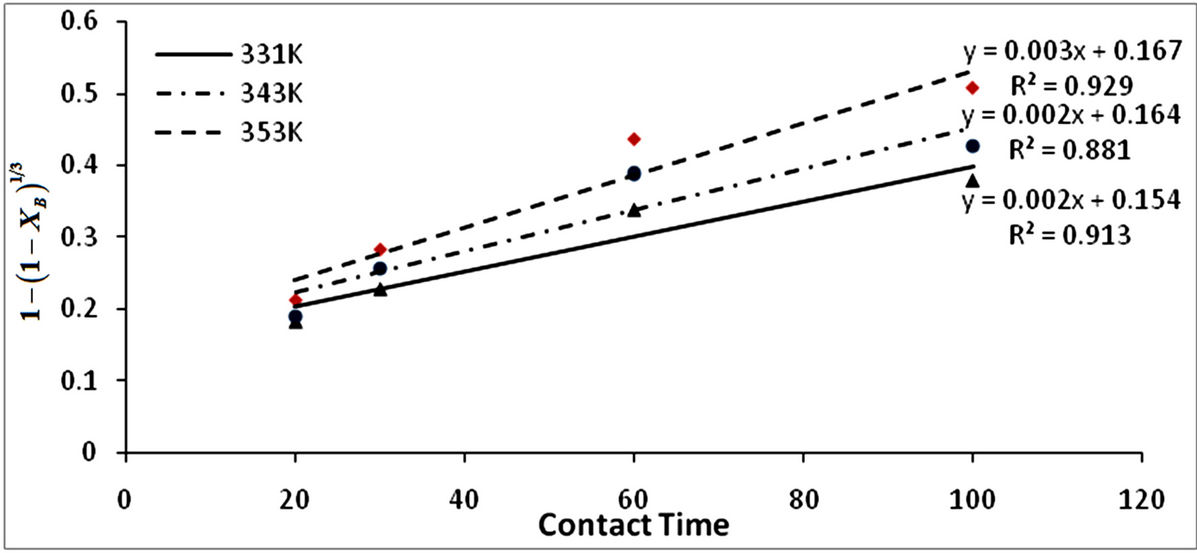
Figure 4. Plot of 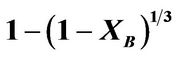 vs contact time (min) with respect to temperature.
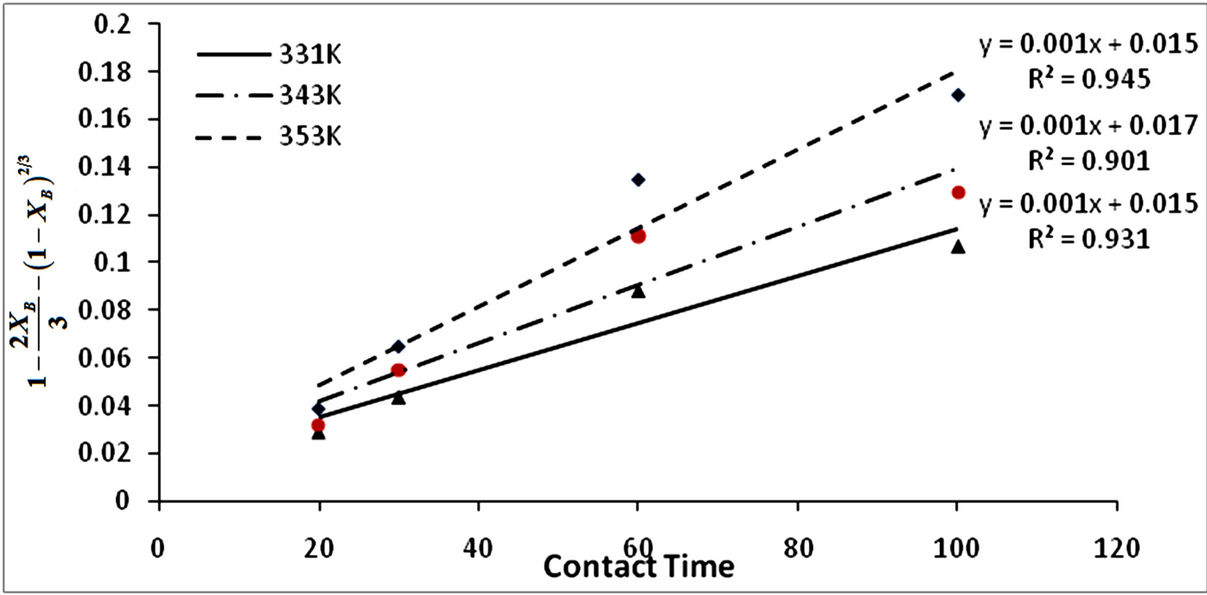
Figure 5. Plot of  vs contact time (min) with respect to temperature.
order of reaction was calculated to be the slope of the plot and equal to 0.7. Therefore the order of reaction for the dissolution of the iron ore in HCl-HNO3 solution is 0.7 indicating a pseudo first order reaction.
4. Conclusion
From the kinetic evaluation for the dissolution of iron ore (obtained from Toto Muro iron ore deposit in Nasarawa
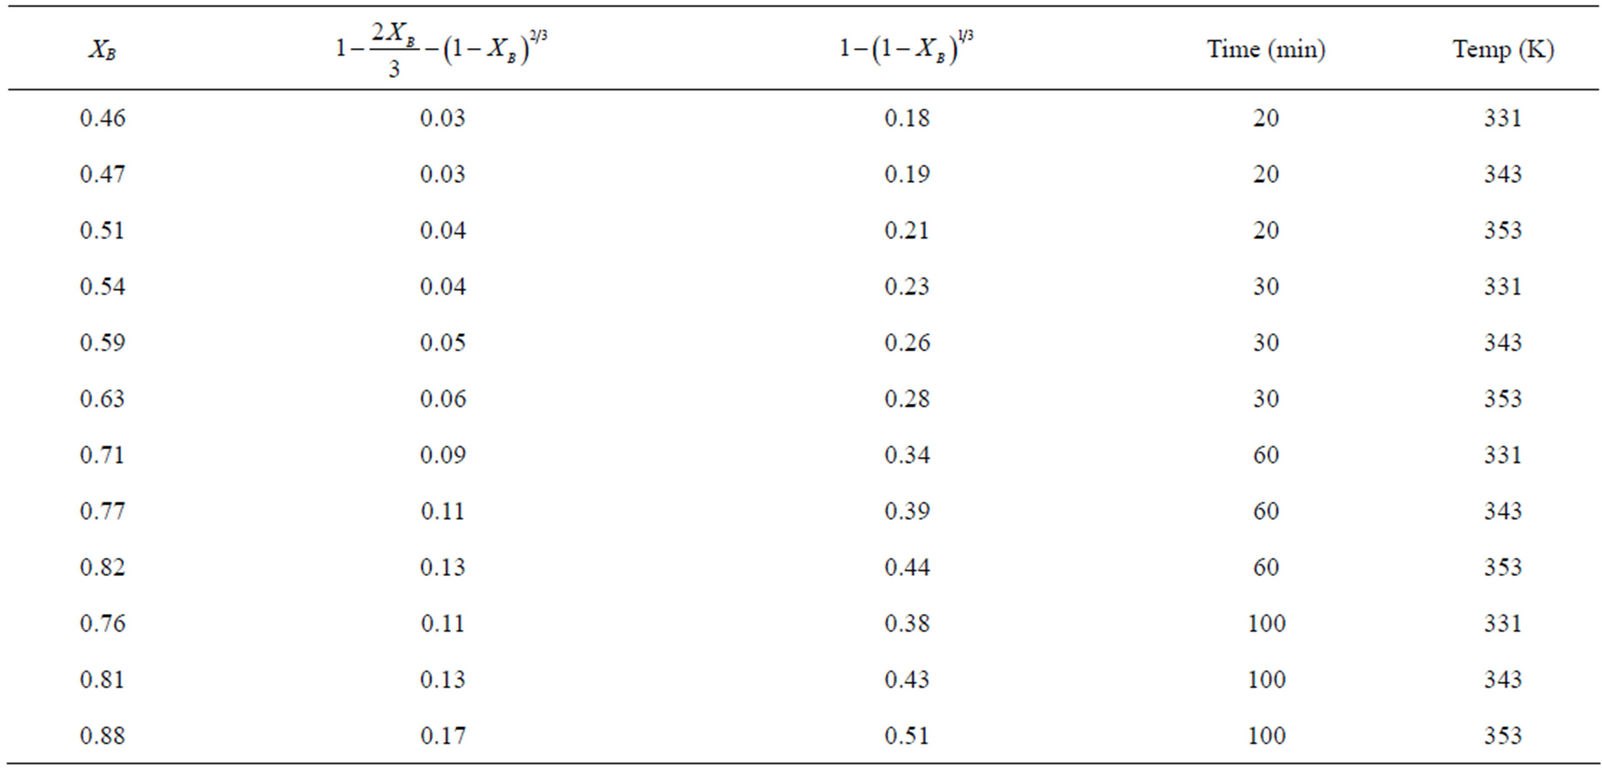
Table 3. Data of three control mechanisms at varying times with respect to temperature.
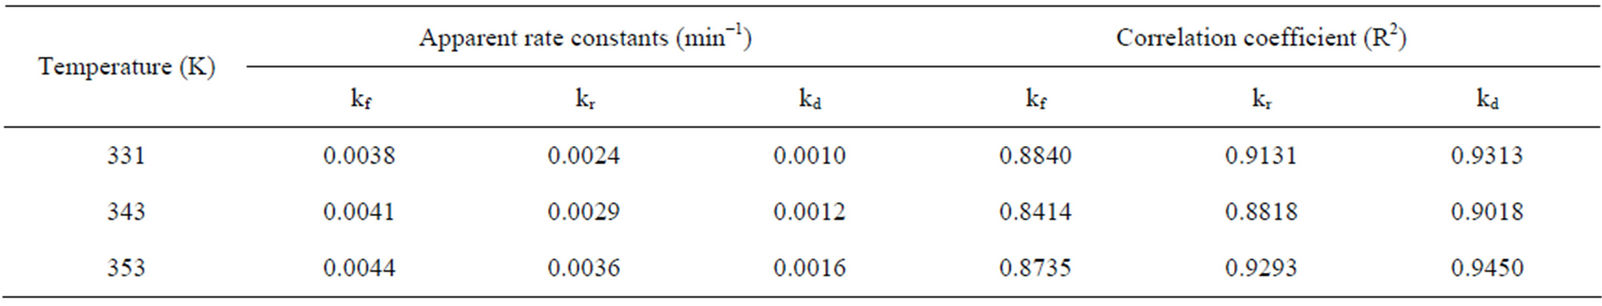
Table 4. Apparent rate constants kf, kr, and kd and their respective correlation coefficient, R2 values at various temperature.
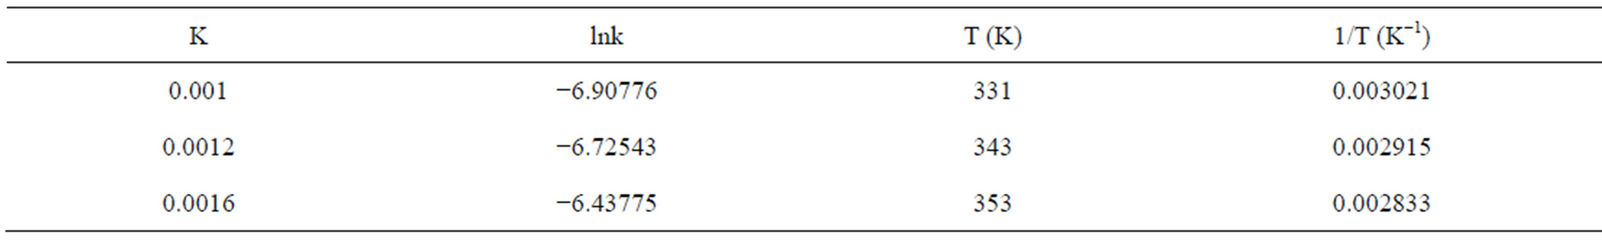
Table 5. Rates constant values kd for the dissolution of the iron ore in HCl/HNO3 at various temperature.
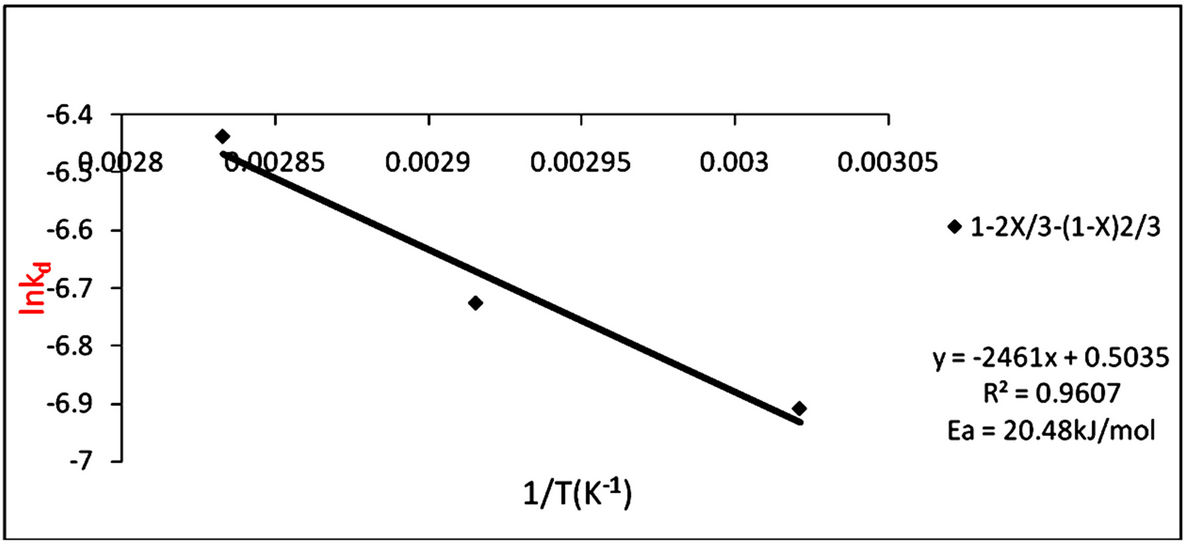
Figure 6. Arrhenius plot of lnkd vs 1/T (K−1) for product layer diffusion controlled mechanism.
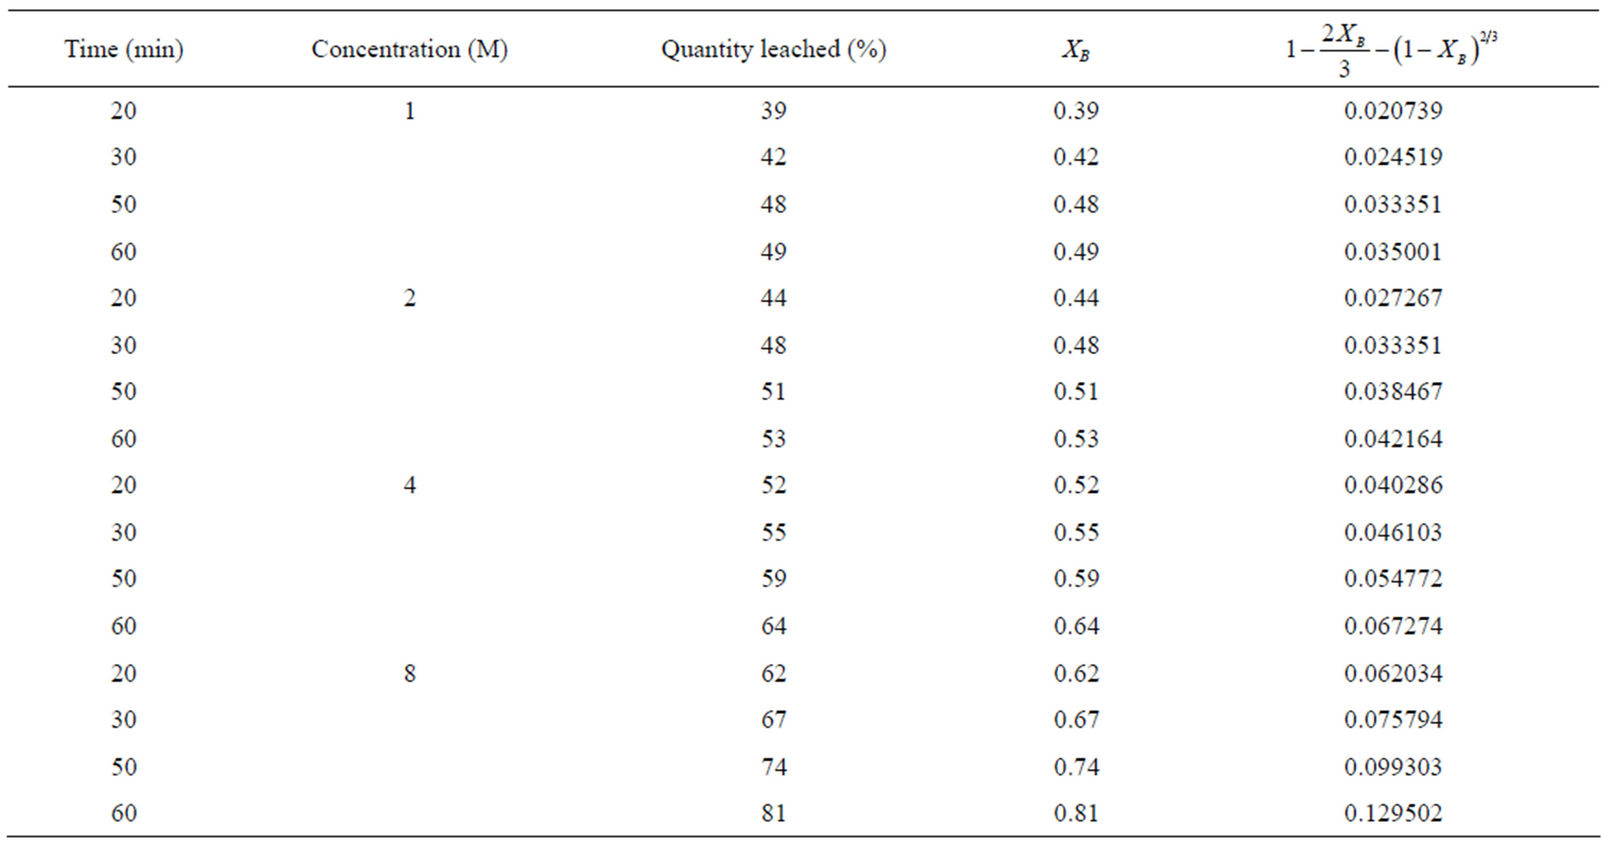
Table 6. Product layer diffusion control mechanism at various concentrations.
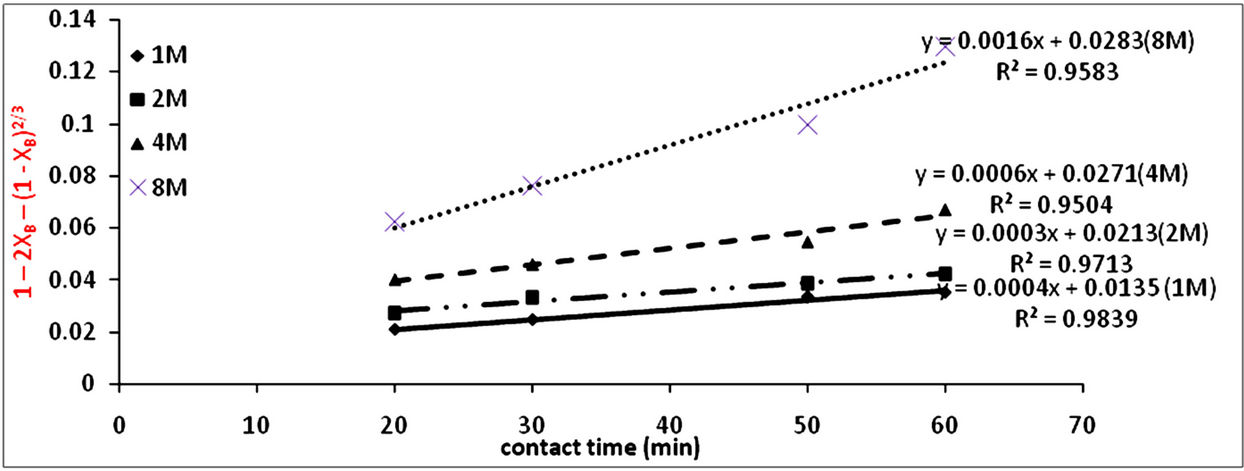
Figure 7. Plot of 1 − 2XB − (1 − XB)2/3 vs contact time (min) at various aqua-regia concentration.
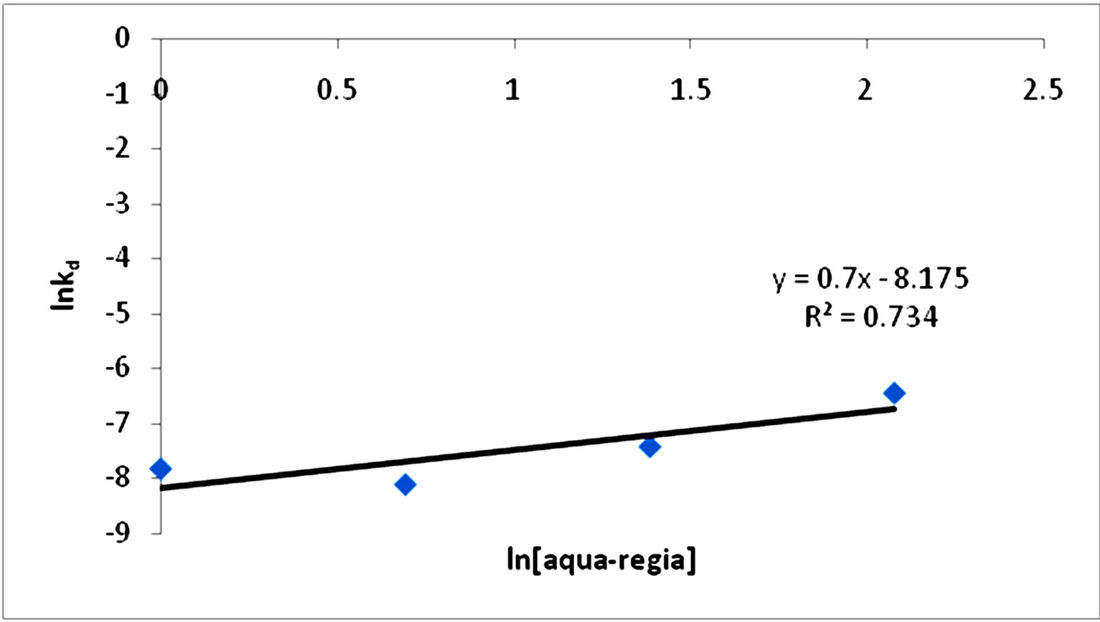
Figure 8. Plot of lnkd vs ln[HCl-HNO3].
State) in HCl-HNO3 solution, it was observed that the rate of dissolution increases with increasing system concentration, temperature, and time but with decreasing particle size. The optimum conditions for the effective dissolution of 88% of the iron ore in HCl-HNO3 solution were obtained at concentration of 8 M, temperature of 353 K, and contact time of 100 min and particle size of less than 75 µm. Also the reaction was found to be controlled by the product layer diffusion controlled process and this conformed to the shrinking core model equation:
 . The apparent Activation energy (Ea) and the order of reaction for the dissolution of 1 g of the iron ore in HCl-HNO3 system were found to be 20.48 kJ/mol and 1 respectively.
REFERENCES
- A. A. Baba, F. A. Adekola and A. J. Lawal, “Investigation of Chemical and Microbial Leaching of Iron Ore in Sulphuric Acid,” Journal of Applied Sciences and Environmental Management, Vol. 11, No. 1, 2007, pp. 39-44.
- A. A. Baba, F. A. Adekola, and A. O. Folashade, “Quatitative Leaching of a Nigerian Iron ore in Hydrochloric acid,” Journal of Applied Sciences and Environmental Management, Vol. 9, No. 3, 2005, pp. 15-20.
- A. A. Baba, A. A. Folahan, A. A. Olayide, I. Lateef, B. B. Rafiu, K. G. Malay and R. S. Abdul, “Simultaneous Recovery of Total Iron and Titanium from Ilmenite Ore by Hydrometallurgical Processing,” Metallurgical and Materials Engineering, Vol. 18, No. 1, 2012, pp. 67-78.
- G. Gülfen, M. Gülfen and A. O. Aydam, “Dissolution Kinetics of Iron from Diasporic Bauxite in Hydrochloric Acid Solution,” Indian Journal of Chemical Technology, Vol. 13, No. 4, 2006, pp. 386-390.
- A. Martinez-Luévanos, M. G. Rodriguez-Delgado, A. Uribe-Salas, F. R. Carrillo-Pedroza and J. G. OsunaAlarcon, “Leaching Kinetic of Iron from Low-Grade Kaolin by Oxalic Acid Solutions,” Applied Clay Science, Vol. 51, No. 4, 2011, pp. 473-477. doi:10.1016/j.clay.2011.01.011
- O. Levenspiel, “Chemical Reaction Engineering,” 3rd Edition, John Wiley and Sons Inc., New York, 1999, pp. 566-582.
- S. Yagi and D. Kunnii, 5th Symposium (International) on Combustion, In: O. Levenspiel, Ed., Chemical Reaction Engineering, 3rd Edition, John Wiley & Sons, New York, p. 231.
- S. Yagi, D. Kunnii, Chemical Engineering Science, Vol. 16, In: O. Levenspiel, Ed., Chemical Reaction Engineering, 3rd Edition, John Wiley & Sons, New York, pp. 364- 380.
- H. Su, H. Liu, F. Wang, X. Lu and Y. Wen, “Kinetics of Reductive Leaching of Low-Grade Pyrolusite with Molasses Alcohol Wastewater in H2SO4,” Chinese Journal of Chemical Engineering, Vol. 18, No. 5, 2010, pp. 730- 735.
NOTES
*Corresponding author.