Food and Nutrition Sciences
Vol.3 No.11(2012), Article ID:24482,5 pages DOI:10.4236/fns.2012.311196
Comparison of Sugar Content in Bottled 100% Fruit Juice versus Extracted Juice of Fresh Fruit
![]()
Southview High School, Sylvania, USA.
Email: gserpen@gmail.com
Received August 22nd, 2012; revised September 21st, 2012; accepted September 29th, 2012
Keywords: Sugar Content Analysis; Bottled Juice; Fresh Fruit Juice; 100% Juice Label; Brix Refractometer
ABSTRACT
This paper presents findings of an experiment for the comparison of sugar concentration in extracted juice of fresh fruit to that of commercially-bottled 100% fruit juice with a “no sugar added” attribute. The goal of the study was to determine if the sugar content of bottled 100% fruit juice with a “no sugar added” label is equivalent to that of extracted juices of fresh fruits. The reported study was performed to address the potential concern that commercially-bottled 100% fruit juices with “no sugar added” may contain higher sugar content than extracted juice of fresh fruit. The fruit juices that were tested included apple, grapefruit, orange, pineapple, pomegranate, red grape and white grape. All bottled juices and fresh fruits were purchased in Toledo, Ohio, USA during the winter of 2012. The fresh fruits were juiced and three samples were tested for sugar concentration using a Brix refractometer. The same testing protocol was also applied to the bottled 100% fruit juice. Application of the Mann-Whitney test on the experimental data demonstrated no statistically significant difference (p > 0.05). The results suggested that the sugar content in the commercially bottled 100% fruit juice with the “no sugar added” label is an accurate representation of sugar content in the freshly-extracted juice of the corresponding fruit.
1. Introduction
Fruits contain many beneficial qualities to one’s health; they provide an abundance of vitamins, minerals, antioxidants and fibers, which are all essential for the human diet [1]. Many people consume fruit juices on a daily basis. Fruit juices are a convenient way for people to receive the benefits of various fruits. However, they may also have high sugar content. Although the sugar is natural, it may not be healthy in high quantities. It was suggested that too much sugar could pose harmful health effects, as people could develop diabetes, obesity, heart disease, and other complications from excess consumption [2]. Recently, companies have been marketing fruit juices with the “no sugar added” feature, in part, to address the concern of exceeding the daily-recommended intake for sugar.
The comparison of the sugar content in freshly-extracted fruit juice with the sugar content in bottled 100% fruit juice claiming to have “no sugar added” is of interest for a number of reasons. It is important to know if the juices with the “no sugar added” claim truly represent the sugar content of juice extracted from the corresponding fresh fruit. If the sugar content in bottled fruit juice with the “no additional sugar” label is higher than that of freshly-extracted fruit juice, people may want to reconsider the amount of commercially-bottled fruit juice they consume.
Fructose is one of the most abundant sugars in fruit juice. Some people believe fructose is healthier than sucrose because it is found naturally in fruit, however it can be equally harmful [3]. Fructose, also known as fruit sugar, is a simple monosaccharide absorbed directly into the bloodstream during digestion. Fruits, vegetables, and honey are all natural sources of fructose. Three common forms of fructose are crystalline fructose, high-fructose corn syrup, and sucrose. Crystalline fructose is derived from corn, and has the highest concentration of fructose. High-fructose corn syrup is a combination of fructose and glucose. Sucrose is a compound of one molecule of glucose and one molecule of fructose [4], and is commonly referred to as table sugar [5]. Excessive amounts of fructose consumption has been tied to negative health effects [6]. The study reported in [6] reached a number of conclusions as follows. Fructose is likely a primary cause of symptoms in certain patients with functional bowel disturbances. The ever-increasing occurrence of obesity, diabetes mellitus, and non-alcoholic fatty liver disease could be the result of excessive fructose intake as well. Finally, fructose may promote the formation of toxic advanced glycation-end products, which may contribute to diabetes, the aging process, and the thickening of artery walls [6].
Sugar content varies depending on the type of fruit. All fruit juices contain fructose, but vary in their amount of sucrose, glucose, and sorbitol [7]. Fruits that are relatively low in sugar include lemon, lime, rhubarb, raspberry, blackberry, and cranberry. Fruits that have low to medium sugar content include strawberry, casaba melon, papaya, watermelon, peach, nectarine, blueberry, cantaloupe, honeydew melon, and apple. Fruits that are fairly high in sugar content include plum, orange, kiwi, pear, and pineapple. Fruits that are considered very high in sugar content include tangerine, cherry, grape, pomegranate, mango, fig and banana. The fruits with very high sugar content will have correspondingly high sugar content when their juice is extracted. In general, the level of sugar in the juice of a fruit is correlated to the level of sugar in the fruit itself. This indicates that grape and pomegranate juice are very high in sugar content. It is also relevant to note that not all fruits are made into juices. Some of the fruits made into commercial bottled juices include lemon, lime, cranberry, watermelon, apple, grape, pomegranate, cherry, and orange [8].
A number of studies evaluated the health-related impact of fruit juice in different forms such as bottled, pasteurized, freshly-extracted etc. [9-14]. In one such study, it was suggested that daily fruit requirements could be met by consuming 100% fruit juice [9], although other studies in the past have evaluated 100% fruit juice as a sweetened beverage with unhealthy consequences with regard to weight. The study reported in [9] also evaluated the contribution of 100% fruit juice to diet quality. Participants in the study ranged in age from two to nineteen plus years old. A survey was conducted to analyze their usual intake of 100% fruit juice. The participants were split into four age groups as follows: two to five, six to twelve, thirteen to eighteen, and nineteen plus years old. The percentages of the participants that consumed 100% fruit juice ranged from 45 to 71. The consumption of fruit juice was associated with higher energy intake in all groups except for the two-to-five-year-old group. The usual fruit juice intake exceeded guidelines for the two-to-five-year-old age group, but was associated with better overall diet quality in all groups. The conclusion was that 100% fruit juice should be a healthy part of one’s diet, but only in moderation [9].
Another study reported the concentration of fructose, glucose, sucrose, pH and acid levels in fruit juices, fruit drinks, carbonated beverages and sport drinks to facilitate an assessment of impact on dental health [10]. The fruit juices, fruit drinks and carbonated beverages contained an average combined sugar amount of 9.3% - 9.8%, and sports drinks contained 4.4%. Fruit juices had the highest amount of acid, approximately 2 to 3 times higher than the others. The study concluded that fruit juices, fruit drinks, and carbonated beverages have the same carcinogenicity, which refers to the contribution to tooth decay development [10], when testing the total amount of sugar and acidity.
Insulin is a hormone produced by the pancreas to regulate glucose. Insulin must be regulated, but not suppressed. Insulin causes sugars to enter cells, which then provides the brain with a satisfactory feeling [11]. One study reports that with oranges there was a smaller insulin response to the fruit than the juice [12]. In grapes, the insulin response to the fruit was greater than the juice. The study concluded that grapes appeared to be more insulinogenic than oranges, meaning they stimulate the production of insulin to a larger degree. This indicates that orange juice leads to greater insulin production than an actual orange fruit, while grapes appear to induce more insulin production than grape juice [12].
Contribution of 100% fruit juices to the epidemic of obesity was analyzed in a study reported in [13]. When fruits are juiced, the nutritional portion, the fiber, is discarded. Researchers claim that calories and sugar obtained from liquid extracted from fresh fruit do not provide feelings of fullness, which in turn may cause people to consume excessive amounts. The study reported in the same article suggests that while some studies show an improved diet quality with the consumption of 100% fruit juice, other studies demonstrate correlations between increased juice consumption and increased risk of obesity and diabetes [13]. Along similar lines, a different study analyzed the correlation between excess 100% fruit juice consumption in children and short stature or obesity. A cross-sectional study was used on a population-based sample of healthy children. 116 two-year-old children and 107 seven-year-old children were recruited for two years along with their primary caregivers and parents. Mean dietary intake, height and weight were calculated and analyzed for 168 of these children. Results were interpreted to suggest that consumption of greater than twelve ounces of fruit juice per day in younger children may be associated with short stature and obesity [14].
Excessive sugar consumption is an ongoing concern. It is therefore important to validate the claim of “no sugar added” appearing on 100% fruit juice bottles. Accordingly, an experiment was proposed to determine and to compare the level of sugar content in freshly-extracted fruit juices to purchased 100% fruit juices with a “no sugar added” label as available to consumers in the USA.
2. Materials and Methods
The experimental methodology entailed direct measurement of sugar concentration in units of Brix using a refractometer [15,16]. The refractometer is made of a rugged exterior of plastic and metal to protect the optical lenses, prisms and mirrors inside. Towards one end, there is a slide with a lid to place the liquid and on the opposite end is the viewing hole, which resembles a monocular eyepiece as seen in Figure 1. The theory of operation for refractometry is presented in [17]. The refractometer used for the experiments reported in this study measures the percent Brix, or relative sugar concentration, of a liquid sample. Depending on the amount of sugar in the sample, the refractometer, which works similarly to a prism, will give a reading on the index. The sugar level is determined by reading the value where two colors on the index, blue and white, meet [16].
Bottled juices and fresh fruits were purchased at various local grocery stores in Toledo, Ohio, USA at different times during the winter of 2012. The fresh fruits incuded apple, grapefruit, orange, pineapple, pomegranate, red grape, and white grape. A fruit juicer was used to extract the juice of the fresh fruits. The following 100% fruit juices designated as “no sugar added” were purchased: apple, grapefruit, orange, pineapple, pomegranate, red

Figure 1. Hand-held optical refractometer.
grape, and white grape. The juicer was cleansed in between each juicing using soap and water. The sugar content for each fruit juice was tested using the refractometer using three samples from the same bottle of purchased juice or extracted juice of fresh fruit, and was recorded. The sugar contents of the extracted juices were compared to those of the bottled juices claiming to have “no sugar added”. Experimentally measured data were analyzed using the Mann-Whitney test for statistically significant differences.
3. Discussion
Typical sugar content concentrations in Brix are shown for a number of common fruits in Table 1 to serve as a point of reference for the subsequent discussion in this section [15]. Measurement values of the experiment are presented in Figure 2. In the apple, red grape, and pineapple juices, the sugar concentration was higher for the fresh fruit juice. For the orange, grapefruit, white grape, and pomegranate juices, the sugar concentrations were higher in the commercially-bottled 100% fruit juices. The findings indicate that the values for the sugar concentration of natural and bottled fruit juices with a “no sugar added” attribute were within close proximity of each other, ranging in difference only a few degrees Brix.
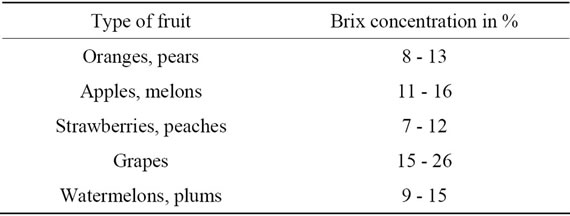
Table 1. Typical Brix concentrations for common fruits.
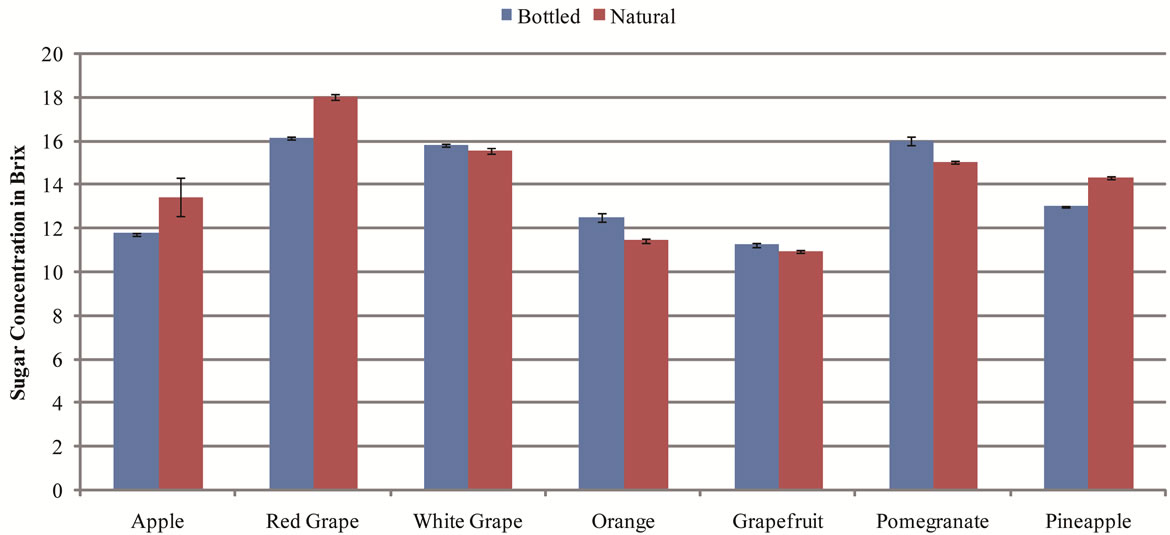
Figure 2. Average Brix concentrations for each fruit juice
A Mann-Whitney statistical test [18] based on a comparison of medians indicated there was not a significant difference in the sugar contents of freshly-extracted and purchased 100% bottled fruit juice in all tested flavors as presented in Table 2. This suggests that the sugar concentration of purchased 100% fruit juices with “no sugar added” appears to represent the true sugar content of the corresponding fresh fruit, in its liquid form.
Although the sugar content comparison failed to yield any differences between bottled and freshly-extracted fruit juices, it is relevant to note other beneficial ingredients or nutrients that are found in freshly-extracted fruit juice. The comparison between freshly-extracted and commercial fruit juices has been reported in prior studies [19,20]. One such study analyzed juices hand-extracted from pineapple, Hamlin and Valencia oranges in comparison to various brands of processed orange juice [19]. Several volatile components were evaluated including alcohols, aldehydes, esters, and hydrocarbons. Results demonstrated that fresh squeezed unpasteurized juice had the highest level of volatile components. Pasteurization of single strength juice not made from concentrate caused no significant changes in volatile flavor composition in comparison to fresh orange juices. Significant changes in volatile compounds occurred in juices reconstituted from concentrates. Canned juices and 10% orange juice were also compared to the 100% orange juice products and were found to have a significantly lower flavor quality in comparison to fresh orange juice [19]. Another study compared the nutrient content of fresh and commercial fruit juices, specifically looking at types and amounts of carbohydrates and electrolytes along with pH and osmolarity [20]. Forty types of fresh fruits were analyzed and compared to data obtained earlier regarding commercial fruit juices. Results demonstrated differences in nutrient content among fresh and commercial fruit juices obtained from the same fruit. Sucrose was more frequent in commercial fruit juices, and rare in fresh juices. Fresh fruit juices had a more neutral pH level than commercial fruit juices, demonstrating a higher acidic

Table 2. Results of the Mann-Whitney Test.
content in commercial fruit juices. Commercial juices derived from apple, guava, orange, pear, and pineapple had a higher solute concentration than corresponding fresh juices. All tested fresh juices demonstrated lower sodium levels than commercial versions. A majority of the fresh fruit juices contained higher levels of nutrients such as: potassium, phosphorus and magnesium than the commercial juices [20]. Therefore, when there is choice available, it is reasonable to suggest that a consumer is likely better off with respect to a balanced diet if (s)he consumes fresh squeezed fruit juice.
4. Conclusions
This paper presents an experimental study on the comparison of sugar content between 100% fruit juices that are sold in bottles in the marketplace in the USA and those that are freshly extracted from fruit. Statistical analysis of the experiment results indicated that there was no significant difference in the sugar concentrations between the two in all tested varieties.
This is a finding that favors consumers who are particularly concerned with sugar consumption. However, it is important to recognize the limitations of this study. The validity of the results could have been affected by the country of origin, surrounding climate, or brand of fresh fruits, among other possible factors.
5. Acknowledgements
The author acknowledges the scientific and technical guidance provided by Dr. Gursel Serpen, PhD, and Mrs. Blythe Tipping.
REFERENCES
- H. J. Klee, “Improving the Flavor of Fresh Fruits: Genomics, Biochemistry, and Biotechnology,” New Phytologist, Vol. 187, No. 1, 2010, pp. 44-56. doi:10.1111/j.1469-8137.2010.03281.x
- K. I. France, “Public Attitudes towards the Healthiness of Fruit Juices,” Journal of Human Nutrition & Dietetics, Vol. 13, No. 5, 2000, p. 369. doi:10.1046/j.1365-277x.2000.00001-16.x
- J. Briffa, “Juicy Details-Why Fruit Juices Pose a Hazard to Our Health,” 2006. http://www.drbriffa.com/2006/11/10/juicy-details-why-fruit-juices-pose-a-hazard-to-our-health/
- Wikipedia, “Fructose,” 2012. http://en.wikipedia.org/wiki/Fructose
- Wikipedia, “Sucrose,” 2012. http://en.wikipedia.org/wiki/Sucrose
- A. Gaby, “Adverse Effects of Dietary Fructose,” Alternative Medicine Review, Vol. 10, No. 4, 2005, pp. 294-306.
- M. M. Smith and M. Davis, “Carbohydrate Absorption from Fruit Juices in Young Children,” Pediatrics, Vol. 95, No. 3, 1995, p. 340.
- L. Dolson, “Low-Carb Fruits: Lists of the Best and Worst,” 2011. http://lowcarbdiets.about.com/od/what
- C. E. O’Neil, T. A. Nicklas, M. Zanovec and I. L. Fulgoni, “Diet Quality Is Positively Associated with 100% Fruit Juice Consumption in Children and Adults in the United States,” Nutrition Journal, Vol. 10, No. 1, 2011, pp. 17- 26. doi:10.1186/1475-2891-10-17
- D. Birkhed, “Sugar Content, Acidity and Effect on Plaque pH of Fruit Juices, Fruit Drinks, Carbonated Beverages and Sport Drinks,” Caries Research, Vol. 18, No. 2, 1984, pp. 120-127.
- G. Neilson, “Insulin: The Good and the Bad,” 2012. http://basskilleronline.com/insulin-good-bad.html
- R. Bolton, K. Heaton and L. Burroughs, “The Role of Dietary Fiber in Satiety, Glucose, and Insulin: Studies with Fruit and Fruit Juices,” The American Journal of Clinical Nutrition, Vol. 34, No. 2, 1981, pp. 211-217.
- M. Eng, “100% Fruit Juice Comes Under Fire in War on Obesity,” 2012. http://www.bendbulletin.com/article/20120531/NEWS0107/205310318/
- B. Dennison, H. Rockwell and S. Baker, “Excess Fruit Juice Consumption by Preschool-aged Children Is Associated with Short Stature and Obesity,” Official Journal of the American Academy of Pediatrics, Vol. 99, No. 1, 1997, pp. 15-22.
- Atago, “Hand-held Refractometers,” www.atago.net/english/images/catalog/hand-held.pdf
- Grapestompers, “How to Use a Refractometer,” 2012. http://www.grapestompers.com/refractometer_use.aspx
- John Hanson, “Theory of Operation for Refractometry,” 2006. http://www2.ups.edu/faculty/hanson/labtechniques/refractometry/theory.htm
- Wikipedia, “Mann-Whitney U,” 2012. http://en.wikipedia.org/wiki/Mann%E2%
- M. Nisperos-Carriedo and P. Shaw, “Comparison of Volatile Flavor Components in Fresh and Processed Orange Juices,” Journal of Agricultural and Food Chemistry, Vol. 38, No. 4, 1990, pp. 1048-1052. doi:10.1021/jf00094a029
- N. Densupsoontorn, P. Jirapinyo, N. Thamonsiri, R. Wongarn, P. Phosuya, A. Tritiprat, S. Patraarat, P. Pidatcha and L. Suwannthol, “Comparison of the Nutrient Content of Fresh Fruit Juices versus Commercial Fruit Juices,” Journal of the Medical Association of Thailand, Vol. 85 No. 2, 2002, pp. S732-S738.