Food and Nutrition Sciences
Vol. 3 No. 9 (2012) , Article ID: 22290 , 5 pages DOI:10.4236/fns.2012.39161
Study of Calcium and Sodium Behavior to Identify Milk Adulteration Using Flame Atomic Absorption Spectrometry
![]()
Department of Chemistry, Federal University of São Carlos—UFSCar, São Carlos, Brazil.
Email: *erpf@ufscar.br
Received February 17th, 2012; revised August 10th, 2012; accepted August 17th, 2012
Keywords: Milk; Adulteration; FAAS; Calcium; Sodium
ABSTRACT
A fast and direct method for determination of milk adulteration by monitoring of calcium and sodium concentrations variations was described. Milk samples were furnished by a dairy company located at São Carlos (São Paulo State, Brazil) and spiked with tap-water, whey, hydrogen peroxide, synthetic urine, urea and synthetic milk in the ranged from 5% to 50% (v/v), expect for caustic soda. Caustic soda was added in the milk until establish the original pH. The milk samples were analyzed by using flame atomic absorption spectrometry (FAAS) and no acid digestion process was required. Results showed a significant decrease in the Na and Ca concentrations with addition of synthetic milk and tap-water, a nonlinear variation with addition of synthetic urine, whey and hydrogen peroxide and a largest increase in the Na concentration with addition of NaOH. Correlation between Na and Ca concentrations in pure and adulterated milk were evaluated by paired t-test at a 95% confidence level. Results showed that the method proposed is efficient to identify samples adulterated with tap-water, caustic soda, synthetics milk and urine.
1. Introduction
Food adulteration is a common and serious problem in many countries [1-4]. Liquid milk is one of the most serious problems for the dairy industry [5,6] and it is commonly adulterated by addition of water to increase the volume, neutralizers to mask acidity, salt or sugar to mask extra water, among others [7,8]. In Brazil, an experimental study to evaluate the milk authenticity showed the presence of at least one of adulterant studied (chlorine, formol, hydrogen peroxide and urine) in all samples analyzed [9]. In China, the addition of melamine in liquid and powder milk has resulted in numerous cases of renal complications in children and six deaths [10].
Several analytical techniques have been suggested for identification and quantification of adulterants in milk [11- 13]. Mabrook et al. and Sadat et al. have investigated the use of single frequency electrical conductance measurements to detect the adulteration by addition of water and synthetic milk [14,15] and results obtained showed a significant difference in the conductance values from the pure to adulterated milk. A new type of impedance sensor was developed to identify milk adulteration with tapwater, urea and liquid-whey [8]. Results indicated that the sensor can detected the adulteration when the concentration of liquid-whey, tap-water and urea were ≥5%, 10% and 0.6 mg·mL–1, respectively. This sensor was also tested to distinguish pure from synthetic milk (milk with liquid-whey) and good results were obtained when the synthetic milk is reconstructed by adding of minimum 15% of liquid-whey. Results obtained with NIR (Near Infrared) revealed that the method can be applied to quantify water and whey with root mean square error of prediction (RMSEP) ~2.159% (v/v) and 2.44 g·L–1, respectively [16]. Santos et al. has studied the possibility to use digital images for determination and quantification of water and NaOH in adulterated liquid cow’s milk [17]. Digital images were obtained in the flatbed scanner, and the means of ten color descriptors were used to evaluate the information from the images. Results showed that the method is able to distinguish and quantify the adulterants with high discriminating power and low statics errors (RMSEP).
The aim of this study was to show the possibility to apply Flame Atomic Absorption Spectrometry (FAAS) and Flame Atomic Emission Spectrometry (FAES) to determine the adulteration in liquid cow milk by variation of Ca and Na concentrations. FAAS is the most widely used technique for elemental determination and the determination of Ca and Na are important because these metals are involved in a several metabolic functions in the humans. FAAS has been widely used in numerous applications to detect and quantify metals in cow milk [18-20], but it was never applied to evaluate the milk adulteration.
2. Materials and Methods
2.1. Instrumentation
FAAS experiments were performed in a flame atomic absorption spectrometer (AA240FS; Varian, Mulgrave, Australia) fitted with a deuterium lamp for background correction. Ca and Na were determined in absorption and emission mode, respectively. The experimental conditions used (wavelength, lamp current for Ca and acetylene and air flow rates) were those recommended by the manufacturer.
2.2. Reagents, Analytical Solutions and Samples
All solutions were made with deionized water (Milli-Q Plus, Millipore, Barueri, São Paulo, Brazil). Calcium (0.25 - 4 mg·L–1) and sodium (0.1 - 0.6 mg·L–1) aqueous standard solutions were prepared after successive dilutions of the metals standard stock solutions of 1000 mg·L–1 (Merck, Darmstadt, Germany).
Milk samples were furnished by a dairy company located at São Carlos (São Paulo State, Brazil). The samples were previously analyzed by several parameters and the results were in agreement with Brazilian’s rules [21] which are compatible with international’s rules. The samples were adulterated with whey, tap-water, synthetic milk, synthetic urine, hydrogen peroxide, urine and commercial NaOH (caustic soda) in different percentage of adulteration (5%, 15%, 25%, 35% and 50% (v/v)), except for the caustic soda. In this case, the fresh milk was turned sour (at ambient temperature) and NaOH (10 mol·L–1) was added to establish the original pH. Synthetic milk and synthetic urine were prepared according to literature [15,22]. Whey solutions were made according to the manufacturer’s recommendations. Commercial NaOH (10 mol·L–1) and tap-water were used to simulate the adulteration procedure. For adulteration with hydrogen peroxide, the p.a. reagent was applied.
2.3. Procedure
In order to develop a fast and direct method to detect milk adulteration, determination of Ca and Na were performed without acid digestion process. The samples were just diluted in deionized water until the Ca and Na concentrations were agreeing with the linear equipment range. The method was validated by the comparison to the standard additions data.
3. Results and Discussion
3.1. Matrix Interferences
Milk is a complex matrix that contains compounds may be interfering in the analytical results. Several procedures of sample preparation have already used to reduce these interfering, and most of them involve a step of digestion to eliminate the organic matrix [23,24]. In this study, a simple dilution of the milk in water was tested and results obtained were compared with the standard additions. Standard addition can be applied to the most analytical techniques in instead of a calibration curve to solve the matrix effect problems.
Figure 1 shows the results obtained with the aqueous standards calibration and the standard addition methods for Ca. The aqueous standards calibration curves (black circles) were prepared by appropriate dilution of Ca standard stock solution in water (0.25, 0.5, 1, 2 and 4 mg·L–1) and the standard addition (black squares) by addition 0.0, 0.2, 0.8 and 1.6 mg·L–1 of Ca in milk samples. The parallel behavior of the regression lines and the similar angular coefficient (0.123 and 0.118), indicating that the method developed can be applied to quantify Ca and Na in milk.
3.2. Application of the Proposed Method for Detection of Milk Adulteration
Table 1 shows Ca and Na concentrations in pure and milk adulterated with water, whey, synthetic urine, synthetic milk, hydrogen peroxide and caustic soda. The concentrations of Ca and Na in pure milk were 1131 ± 29 mg·L–1 and 794 ± 23 mg·L–1, respectively. Ca concentrations varied from 1342 ± 97 (for milk adulterated with whey at 5%) to 531 ± 32 mg·L–1 (for milk adulterated with water at 50%) and Na from 1659 ± 86 (for milk adulterated
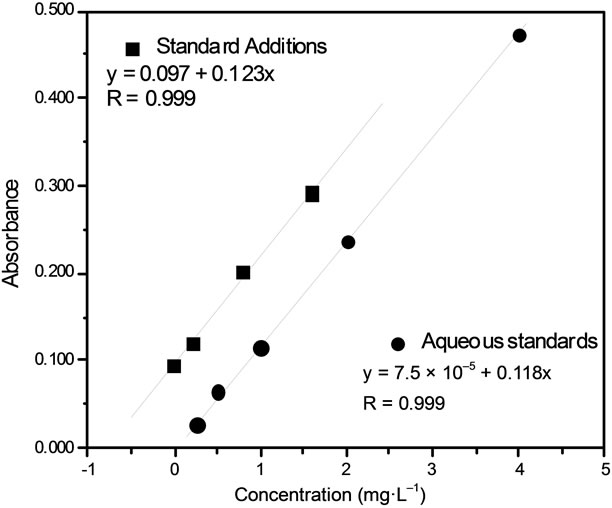
Figure 1. Calcium calibration curves obtained with (■) standard additions and (●) aqueous standards.
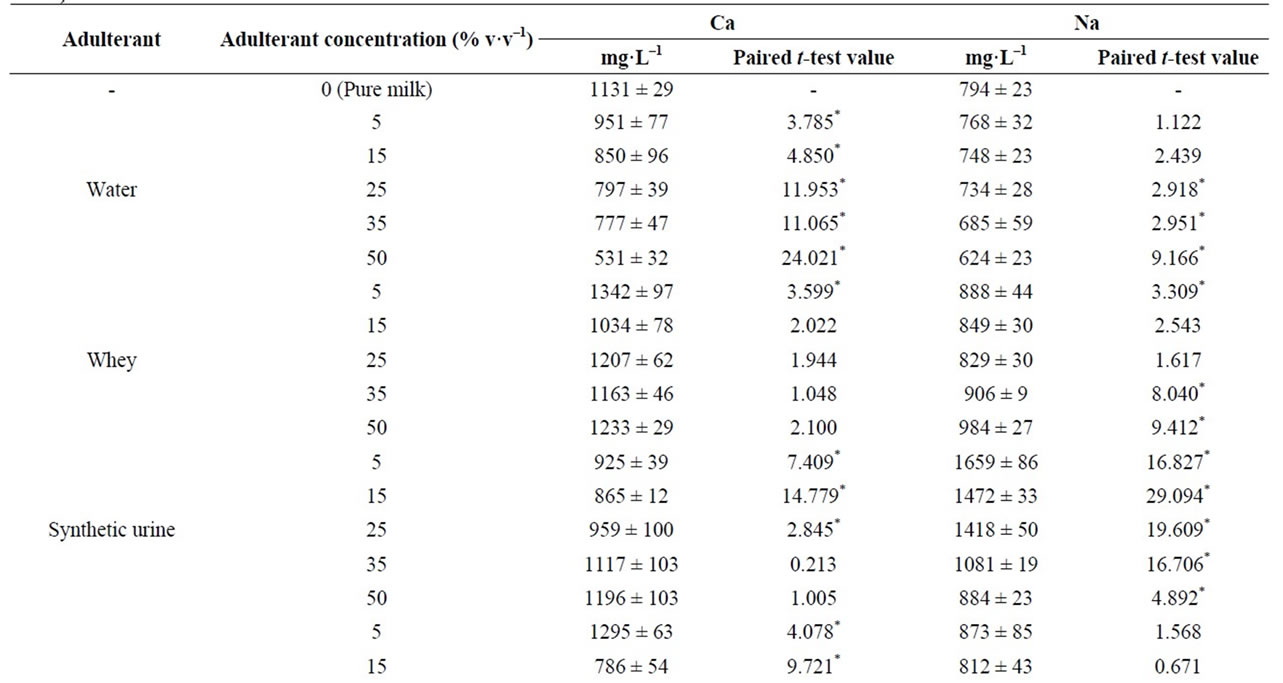
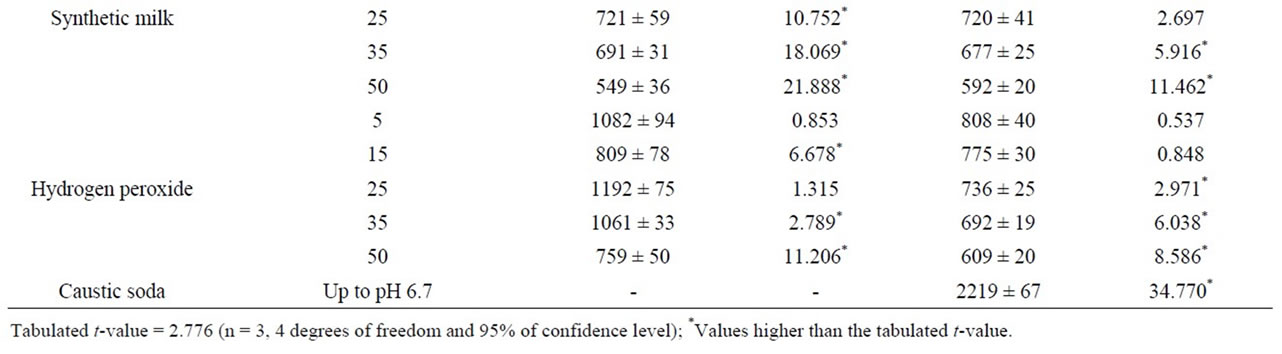
Table 1. Ca and Na concentration in pure and adulterated milk samples by using FAAS (mean ± standard deviation, mg·L–1, n = 3).
with urine at 5%) to 592 ± 20 mg·L–1 (for milk adulterated with synthetic milk at 50%). The largest decrease in the Na and Ca concentrations were observed in samples adulterated with synthetic milk and tap-water. These effects can be associated to increase in the milk volume due the addition of these liquids adulterants. On the other hand, the largest increase in the Na and Ca concentrations was observed for Na in the milk adulterated with caustic soda. Na concentrations varied from 794 ± 23 (for pure milk) to 2219 ± 67 mg·L–1.
Significant differences in the Ca and Na concentrations were also observed in the samples adulterated with whey. In this case, the addition of whey results in a nonlinear variation of Ca and Na concentration. According to the manufacturer, whey is composed by 1086 and 796 mg·g–1 of Na and Ca, respectively. Therefore, the adding of whey provides not only the dilution of samples but also an increase in the Ca and Na concentrations. Same behavior (nonlinear variation) was observed in the samples adulterated with hydrogen peroxide and synthetic urine. Figure 2 shows the variation of Ca and Na concentrations in milk adulterated with synthetic urine. Results obtained showed that the Na concentration increased significantly after the first addition of synthetic urine (from 794 ± 23 to 1659 ± 89 mg·L–1) and, after that, the concentration decreased until 884 ± 23 mg·L–1 with an adulteration of 50%. For Ca, the behavior was the opposite. Ca concentration decreased to 925 ± 39 mg·L–1 after adulteration of 5% synthetic urine and increased to 959 ± 100 mg·L–1 with adulteration of 25%.
A paired t-test was used for comparing the concentrations of Ca and Na obtained in pure and adulterated milk. Results showed that the Ca concentrations in pure milk was statistical different to the samples adulterated with water and synthetic milk (calculated t values higher than 2.776) (Table 1). Na concentrations in pure and adulterated milk were statistical different just in the samples adulterated with NaOH and synthetic urine. Adulteration
Figure 2. Calcium (■) and sodium (●) behavior in milk adulterated with synthetic urine.
by addition of whey and hydrogen peroxide were the most difficult to identify by variation of Na and Ca concentrations. According to the results, significant difference in the Na and Ca were obtained just for some selected levels analyzed.
4. Conclusion
The proposed method demonstrated the possibility to accomplish FAAS for identification of milk adulteration by analyzing Ca and Na behavior. The method is simple, fast and do not require the use of acid digestion process. A paired t-test was used to compare Na and Ca concentration in pure and adulterated milk and results showed that the method was efficient to identify samples adulterated with tap-water, caustic soda, synthetics milk and urine. Giving these results, we concluded that the method can be an alternative to detect milk adulteration in the dairy industries.
5. Acknowledgements
The authors are grateful to the Conselho Nacional de Desenvolvimento Científico e Tecnológico (CNPq), Ministério da Agricultura, Pecuária e Abastecimento (MAPA) and Fundação de Amparo à Pesquisa do Estado de São Paulo—FAPESP (processes number 2009/01345-6 and 2009/10541-3) for the financial support.
REFERENCES
- T. Gallardo-Velázquez, G. Osorio-Revilla, M. Zuñiga-de Loa and Y. Rivera-Espinoza, “Application of FTIRHATR Spectroscopy and Multivariate Analysis to the Quantification of Adulterants in Mexican Honeys,” Food Research International, Vol. 42, No. 9, 2009, pp. 313- 318.
- G. Gurdeniz and B. Ozen, “Detection of Adulteration of Extra-Virgin Olive Oil by Chemometric Analysis of MidInfrared Spectral Data,” Food Chemistry, Vol. 116, No. 2, 2009, pp. 519-525. doi:10.1016/j.foodchem.2009.02.068
- A. I. Ruiz-Matute, S. Rodrıguez-Sanchez, M. L. Sanz and I. Martınez-Castro, “Detection of Adulterations of Honey with High Fructose Syrups from Inulin by GC Analysis,” Journal of Food Composition and Analysis, Vol. 23, No. 3, 2010, pp. 273-276. doi:10.1016/j.jfca.2009.10.004
- J. Zhang, X. Zhang, L. Dediu and C. Victor, “Review of the Current Application of Fingerprinting Allowing Detection of Food Adulteration and Fraud in China,” Food Control, Vol. 22, No. 8, 2011, pp. 1126-1135. doi:10.1016/j.foodcont.2011.01.019
- M. Kartheek, A. A. Smith, A. K. Muthu and R. Manavalan, “Determination of Adulterants in Food: A Review,” Journal of Chemical and Pharmaceutical Research, Vol. 3, No. 2, 2011, pp. 629-636.
- H. Bytyqi, S. Bigler, S. Muji, A. Jahja and U. Zaugg, “Survey on Raw Milk Quality in Kosovo,” Food and Nutrition Sciences, Vol. 2, No. 5, 2011, pp. 414-421. doi:10.4236/fns.2011.25058
- A. Borin, M. F. Ferrão, C. Mello, D. A. Maretto and R. J. Poppi, “Least-Squares Support Vector Machines and Near Infrared Spectroscopy for Quantification of Common Adulterants in Powdered Milk,” Analytica Chimica Acta, Vol. 579, No. 1, 2006, pp. 25-32. doi:10.1016/j.aca.2006.07.008
- S. Das, M. Sivaramakrishna, K. Biswas and B. Goswami, “Performance Study of a ‘Constant Phase Angle Based’ Impedance Sensor to Detect Milk Adulteration,” Sensors and Actuators A, Vol. 167, No. 2, 2011, pp. 273-278. doi:10.1016/j.sna.2011.02.041
- S. S. Souza, A. G. Cruz, E. H. M. Walter, J. A. F. Faria, R. M. S. Celeghini, M. M. C. Ferreira, D. Granato and A. S. Sant’Ana, “Monitoring the Authenticity of Brazilian UHT milk: A Chemometric Approach,” Food Chemistry, Vol. 124, No. 2, 2011, pp. 692-695. doi:10.1016/j.foodchem.2010.06.074
- H. Xin and R. Stone, “Chinese Probe Unmasks HighTech Adulteration with Melamine,” Science, Vol. 322, 2008, pp. 1310-1311. doi:10.1126/science.322.5906.1310
- S. N. Jha and T. Matsuoka, “Detection of Adulterants in Milk Using Near Infrared Spectroscopy,” Journal of Food Science and Technology, Vol. 41, No. 3, 2004, pp. 313- 316.
- Y. Cheng, Y. Dong, J. Wub, X. Yang, H. Bai, H. Zheng, D. Ren, Y. Zou and M. Li, “Screening Melamine Adulterant in Milk Powder with Laser Raman Spectrometry,” Journal of Food Composition and Analysis, Vol. 23, No. 2, 2010, pp. 199-202. doi:10.1016/j.jfca.2009.08.006
- M. M. Paradkar, R. S. Singhal and P. R. Kulkarni, “An Approach to the Detection of Synthetic Milk in Dairy Milk: 1. Detection of Urea,” International Journal of Dairy Technology, Vol. 53, No. 3, 2001, pp. 87-91. doi:10.1111/j.1471-0307.2000.tb02666.x
- M. F. Mabrook and M. C. Petty, “A Novel Technique for the Detection of Added Water to Full Fat Milk Using Single Frequency Admittance Measurements,” Sensors and Actuators B, Vol. 96, No. 1-2, 2003, pp. 215-218. doi:10.1016/S0925-4005(03)00527-6
- A. Sadat, P. Mustajab and I. A. Khan, “Determining the Adulteration of Natural Milk with Synthetic Milk Using ac Conductance Measurement,” Journal of Food Engineering, Vol. 77, No. 3, 2006, pp. 472-477. doi:10.1016/j.jfoodeng.2005.06.062
- S. Kasemsumran, W. Thanapase and A. Kiatsoonthon, “Feasibility of Near-Infrared Spectroscopy to Detect and to Quantify Adulterants in Cow Milk,” Analytical Sciences, Vol. 23, No. 7, 2007, pp. 907-910. doi:10.2116/analsci.23.907
- P. M. Santos, P. D. Wentzell and E. R. Pereira-Filho, “Scanner Digital Images Combined with Color Parameters: A Case Study to Detect Adulterations in Liquid Cow’s Milk,” Food Analytical Methods, Vol. 5, No. 1, 2011, pp. 89-95. doi:10.1007/s12161-011-9216-2
- C. C. Nascentes, M. A. Z. Arruda, A. R. A. Nogueira and J. A. Nóbrega, “Direct Determination of Cu and Zn in Fruit Juices and Bovine Milk by Thermospray Flame Furnace Atomic Absorption Spectrometry,” Talanta, Vol. 64, No. 2, 2004, pp. 912-917. doi:10.1016/j.talanta.2004.04.004
- L. Noel, M. Carl, C. Vastel and T. Guerin, “Determination of sodium, Potassium, Calcium and Magnesium Content in Milk Products by Flame Atomic Absorption Spectrometry (FAAS): A Joint ISO/IDF Collaborative Study,” International Dairy Journal, Vol. 18, No. 9, 2008, pp. 899-904. doi:10.1016/j.idairyj.2008.01.003
- V.A. Soares, M. M. M. Kus, A. L. C. Peixoto, J. S. Carrocci, R. F. S. Salazar and H. J. Izário Filho, “Determination of Nutritional and Toxic Elements in Pasteurized Bovine Milk from Vale Do Paraiba Region (Brazil),” Food Control, Vol. 21, No. 1, 2010, pp. 45-49. doi:10.1016/j.foodcont.2009.03.010
- Ministry of Agriculture, Livestock and Food Supply (MAPA), “Normative Resolution nr. 51,” 2002. http://www.agricultura.gov.br/
- N. Laube, B. Mohr and A. Hesse, “Laser-Probe-Based Investigation of the Evolution of Particle Size Distributions of Calcium Oxalate Particles Formed in Artificial Urines,” Journal of Crystal Growth, Vol. 233, No. 1-2, 2001, pp. 367-374. doi:10.1016/S0022-0248(01)01547-0
- Y. Luo, B. Zhang, M. Chen, J. Wang, X. Zhang, W. Gao, J. Huang and W. Fu, “Rapid and Simultaneous Determination of Essential Minerals and Trace Elements in Human Milk by Improved Flame Atomic Absorption Spectroscopy (FAAS) with Microwave Digestion,” Journal of Agricultural and Food Chemistry, Vol. 58, No. 17, 2010, pp. 9396-9400. doi:10.1021/jf100940e
- M. D. Silvestre, M. J. Lagarda, R. Farré, C. MartínezCosta and J. Brines, “Copper, Iron and Zinc Determinations in Human Milk Using FAAS with Microwave Digestion,” Food Chemistry, Vol. 68, No. 1, 2000, pp. 95- 99. doi:10.1016/S0308-8146(99)00160-0
NOTES
*Corresponding author.