Food and Nutrition Sciences
Vol. 2 No. 5 (2011) , Article ID: 5755 , 6 pages DOI:10.4236/fns.2011.25059
Antioxidant and Phenolic Content of Nuts, Oil Seeds, Milk and Milk Products Commonly Consumed in India
![]()
Endocrinology and Metabolism Division, National Institute of Nutrition, Jamai-Osmania, India.
Email: *dandesr@yahoo.com
Received March 1st, 2011; revised April 25th, 2011; accepted May 3rd, 2011.
Keywords: Antioxidant Content (AOC), 2,2’-Diphenyl-1-picryl hydrazyl (DPPH), Ferric Reducing Antioxidant Power (FRAP), Polyphenols, Phenolic Content (PC), 2,4,6-Tripyridyl-s-triazine (TPTZ)
ABSTRACT
Food provides not only essential nutrients required for life, but also bioactive compounds usefull to maintan good health and disease prevention. Abundant epidemiological evidences suggest that consumption of food rich in antioxidants (non-nutritional compo-nents) can prevent degenerative diseases. A total of 26 commonly consumed nuts, oil seeds, edible oils, milk and milk products were chosen for the study. Considering the fact that antioxidant content (AOC) and phenolic contents (PC) of these foods was not established systematically in Indian context. Therefore, we have assessed and correlated the AOC and PC, an important antioxidant constituents of plant foods. AOC was assessed by DPPH (2, 2-Diphenyl-1-picryl hydrazyl) scavenging activity and FRAP (Ferric reducing antioxidant power) methods and phenolic content (PC), using Folin-Ciocalteu reagent. Among the nuts and oil seeds arecanut had the highest phenolic and antioxidant content 10841, 4220341 mg/100g respectively. In milk, edible oils and sugars the values ranged from 336 - 11674 mg/100g. Jaggery had the highest PC and AOC among the foods studied . Although AOC and PC showed wide variation among the foods, AOC was correlated significantly with PC. Indeed the “r” value between PC and AOC (DPPH and FRAP) was 0.99 (p < 0.01) among the nuts and oil seeds, while in milk, milk products and sugars, the “r” values ranged from 0.93 and 0.99 (p < 0.01) respectively. The overall results indicate that the phenolic compounds may be significant contributors to the AOC of the foods studied.
1. Introduction
Antioxidants are essential for human health.Dietary antioxidants play an important role in controlling oxidative stress [1]. During normal metabolism, the oxidants and antioxidants are maintained in equilibrium [2]. Excess free radical production underlies the pathogenesis of diseases like atherosclerosis, carcinogenesis, diabetes, cataract and accelerated ageing [3]. Robust epidemiological evidence suggests the crucial role of diets in prevention of chronic degenerative diseases [4]. Supplementation of natural antioxidants through a balanced diet containing enough antioxidants could be most effective in protecting against various oxidative stressors [5]. In recent times, natural antioxidants have raised considerable interest among nutritionists, food manufacturers and consumers because of their presumed safety and potential therapeutic value. Indeed, recent research trends indicate a shift towards identifying non-nutritional antioxidants in functional foods [6].
More than 5000 phytochemicals have been identified in plant foods and many more remain to be discovered [7]. Phenolic compounds have been proposed to be the potent and important contributors in reducing oxidative strees due to their antioxidant activity, which are of great importance predominantly in Indian diets [8]. Therefore, food industry is concentrating on foods containing various bioactive compounds for health promotion and disease prevention [9].
There are few studies from India (including our studies) on antioxidant activity and phenolic content of plant foods commonly consumed in India [10,11]. The foods chosen in this study were not attempted systematically for their AOC and their correlation with phenolic content .Therefore, to the best of our knowledge, we have determined for the first time the AOC and its correlation with PC in 26 commonly consumed foods in India.
2. Materials and Methods
Chemicals and reagents: 2,2’-Diphenyl-1-picryl hydrazyl (DPPH), Gallic acid, 2,4,6-tripyridyl-s-triazine (TPTZ) and Ferric Chloride were obtained from Sigma Chemical Inc, USA. All other reagents and chemicals used were of analytical grade procured from local sources. Milli Q water was used in the study.
2.1. Sample Collection and Extraction
Three samples of each food were purchased from each of the three local markets of Hyderabad and Secunderabad cities (India). Food samples were pooled from each area and represented as a single sample from that particular market. The samples were analyzed separately and data presented as mean value. Each sample was extracted in duplicate according to Sing et al. and Zielinski et al., [12,13] with slight modifications. Methanol extraction was adopted as per the procedure described by Matthaus [14].
Approximately 50 g of the edible portion of the food was subjected to grinding in a domestic blender. In case of nuts and oil seeds, 5 grams of the ground sample was taken. Sample extracts were prepared in 20 ml of 70% Methanol containing 0.1% HCl by shaking vigorously for four hours at room temperature. In case of liquid samples like milk and edible oils, 5 ml of the sample was taken directly and extracted as above. The sample suspension was centrifuged at 10,000 g for 15min at 10˚C, the supernatant was collected and filtered through Whatman #1 filter paper and the resultant filtrate was stored at –20˚C. Analysis was completed within a month of extraction [15].
2.2. DPPH Radical Scavenging Activity
DPPH radical scavenging activity was determined according to Yu et al. [16]. This method is based on the ability of the antioxidant to scavenge the DPPH cation radical. Briefly, 100 µl of sample extract or standard was added to 2.9 ml of DPPH reagent (0.1 mM in methanol) and vortexed vigorously. The reaction tubes were incubated in dark for 30 min, at room temperature and the discolouration of DPPH was measured against a reagent blank at 517 nm. Percentage inhibition of the discolouration of DPPH by the sample extract was expressed as Trolox equivalents [17].
2.3. FRAP Assay
Ferric reducing antioxidant power (FRAP) was determined according to Benzie and Strain [18]. This method is based on the ability of the sample to reduce Fe+3 to Fe+2 ions. In the presence of TPTZ, the Fe+2 -TPTZ complex exhibits blue colour which has absorption maxima at 593 nm. Briefly, 3.0 ml of working FRAP reagent was added to a suitable volume of the sample extract was taken to suit in to standard range. After incubation for 6 min at room temperature the absorbance was measured at 593nm against FeSO4 as standard.
2.4. Folin-Ciocalteu Assay
Soluble phenolic compounds (PC) were determined in sample extracts using the Folin-Ciocalteu reagent as per the method described by Singleton and Rossi [19] with slight modifications. Briefly, suitable volumes of sample extract to fit into standard concentrations were taken, 1.0ml of 10% Folin-Ciocalteu reagent and 0.8 ml of 7.5% Na2CO3 were added, vortexed thoroughly and incubated at room temperature for 90 minutes and the absorbance was read at 725 nm. The values were expressed as equivalents of Gallic acid, which is one of the most commonly, used standards in phenolic estimations. Gallic acid has indeed been shown to be more stable and a pharmacologically active antioxidant, quantitatively equivalent to many other phenolics and gives consistent and reproducible results [20].
2.5. Statistical Analysis
Results are expressed on fresh weight basis and presented as mean ± SD. Statistical analysis was performed to know the correlation between AOC and phenolic content using SPSS 14.0 statistical package.
3. Results and Discussion
Phenols and polyphenols are stronger antioxidants than the vitamins [21]. Several epidemiological studies showed a lower risk with increasing intakes of plant foods [22] and protection against DNA damage [23]. Yet in India, plant foods have received less attention in terms of quantifying their AOC [10]. As such, little data exists on the AOC of plant foods commonly consumed in India, let alone their relationship with the phenolic content [24, 25]. On the other hand, no single method gives a comprehensive estimation of the antioxidant efficacy of the food sample tested. About twenty different AOC indices are currently in use, single index by itself is not considered sufficient to quantify the AOC of foods. Therefore, use of more than one method is recommended for quantifying the AOC of the foods [26]. FRAP and DPPH are widely used and well accepted AOC indices [27,28]. Therefore, these two indices are chosen to determine the AOC of nuts, oil seeds, milk, edible oils and sugars. Considering that phenolic compounds are important antioxidants of commonly consumed foods, soluble phenolic content (PC) was determined by Folin/Ciocalteu assay. The results among the 26 commonly consumed foods in India are summarized in Tables 1-4. In general, the coefficient of variation in the AOC and PC among the three samples collected from three different local markets for a given food sample was less than 10% indicating no significant differences among the market samples collected for the study. However, there was a wide variation in the AOC and PC content of the foods studied.
DPPH radical scavenging activity (trolox equivalents) and FRAP (ferrous sulphate equivalent), showed marked variation among the 12 commonly consumed nuts and oil seeds studied (Table 1). DPPH radical scavenging activity presented in Table 1, ranges from 20.0 - 28622.0 mg TE/100g with the highest activity being found in the arecanut followed by the mustard seeds (1155) and the least in the coconut water (20 mg/100g) (Table 1). Similarly, their FRAP activity ranged from 220.0 - 4220341.0 mg /100g. Inline with the DPPH results, FRAP content was highest in the arecanut, followed by the mustard seeds and the least in the coconut water. The PC of nuts and oil seeds ranged from 10.0 to 10841.0 mg/100g, and in line with their AOC (DPPH and FRAP), arecanut has the highest phenolic content (10841.4) and coconut water the least (10.0).
AOC and PC of milk, milk products, edible oils, sugar, and sugarcane juice findings have been highlighted in Table 3.The DPPH activity ranges from 3.4 - 208.0 mg /100g with Jaggery having the highest DPPH content (208) followed by ground nut oil (22.1) and lowest activity found in whole milk (3.4). On the other hand, the FRAP activity ranges from 36 - 11674 mg/100g, with the highest activity in jaggery (11674.0) followed by sugarcane juice (872.0) and lowest was in sunflower oil (36.0 mg/100g). The PC content of milk, milk products, edible oils and sugars (Table 3) showed a wide range of values 0.72 - 336 mg/100g. Here again, jaggery had the highest PC (336.4) followed by honey (140.4) and the least phenolic content was observed in vanaspathi (0.70).
Indeed, the AOC values reported here for the foods studied (Tables 1 and 3) are the first of their kind from India. However very scanty data is available from India on the phenolic content of some of the foods studied but not AOC [29]. Available information from other parts of the world on the PC content of sugar (cane) reported ranged from 11 - 41 mg/100g [30] and our findings (12.28 mg/100g) are comparable for sugar. Where as sugarcane juice is reported to have a phenolic content of 16 mg/100g [31], we observed 27.1 ± 6.00 mg/100g. The reported data on the phenolic contents of different brands of honey ranges from 234 - 394 mg/100g [32], whereas our values (140.4 mg/100g) are found to be lower (Table 3). This discordance could be due to factors like agronomic, genomic and post—harvesting conditions, which may affect the chemical composition of foods studied [33,34]. However, there is no published data on the AOC of the foods studied from India to compare our findings. Among the 26 foods studied, a few of them were not rich sources of AOC/PC, inspite of that they were included to have reference values from India.
Even though the foods studied belong to different food groups, significant correlation was observed between AOC (as estimated by both DPPH and FRAP methods) and PC (Tables 2 and 4). The correlation coefficient “r” values between PC and AOC was 0.99 in nuts and oil seeds (Table 2), whereas the “r” value was 0.93 in other foods given in Table 4. The positive correlation between PC and AOC (as assessed by DPPH and FRAP) among all the foods studied, indicate the importance of PC to antioxidant content.
4. Conclusions
The data reported here is the first of its kind from India
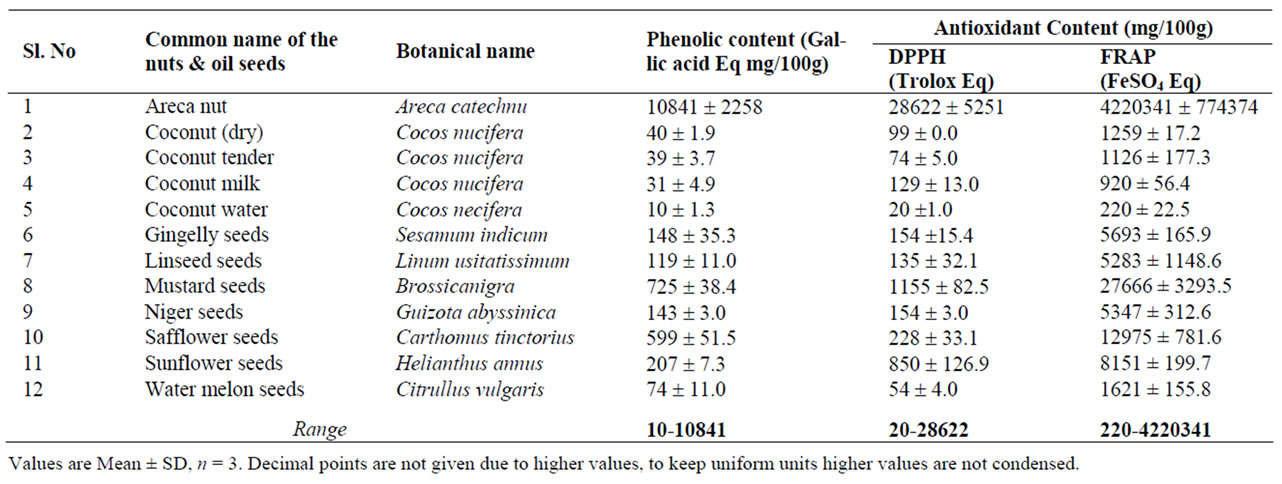
Table 1. Antioxidant and Phenolic contents of nuts and oil seeds.
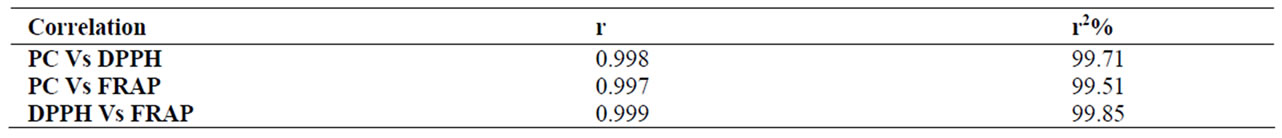
Table 2. AOC Vs TPC correlation of nuts and oil seeds.
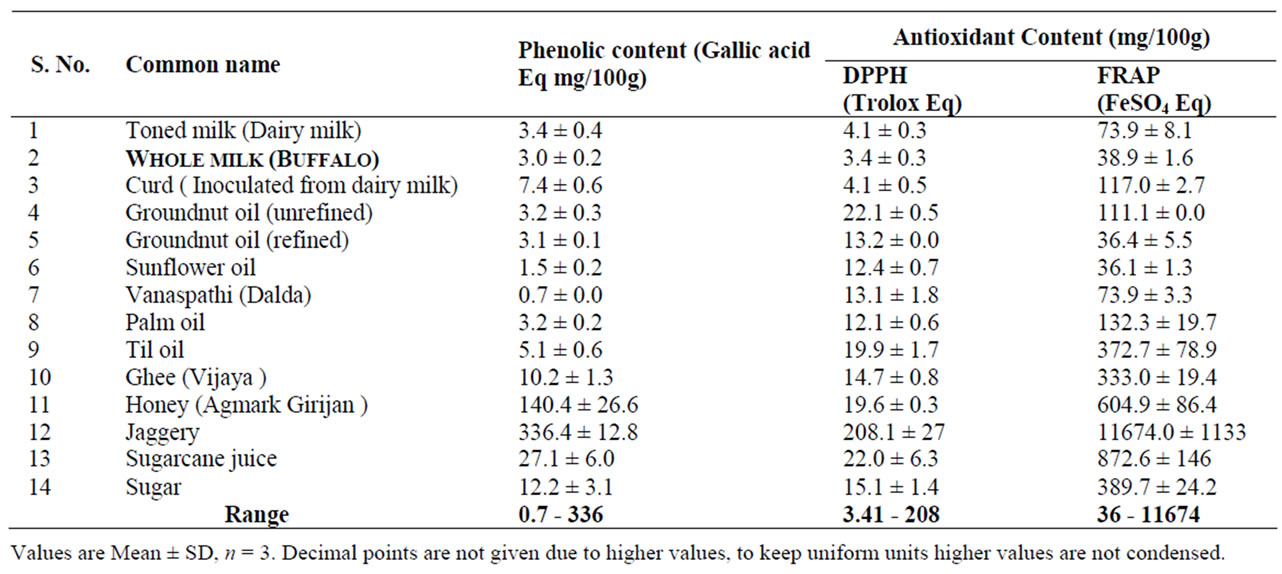
Table 3. Antioxidant and phenolic contents of milk, milk products, edible oils and sugars.
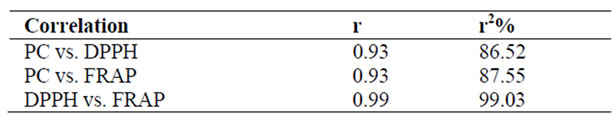
Table 4. AOC Vs TPC correlation of milk, milk products, edible oils and sugars.
and these findings would be useful to nutritionists and consumers to know and formulate the antioxidant—rich therapeutic diets. In addition, the present study would be a valuable information to the existing knowledge on non—nutrient antioxidant contents of commonly— consumed Indian foods.
5. Acknowledgement
We thank Dr. B. Sesikeran Director, National Institute of Nutrition for his encouragement in carrying out this study. We thank Mr. B. Giribabu for the secretarial help in preparing the manuscript.
REFERENCES
- K. E. Nikki, “Free Radical in the 1990s from in Vitro to in Vivo,” Free Radical Research, Vol. 33, 2001, pp. 693- 704.
- P. P. Singh and P. Sharma, “Antioxidant Basket: Do Not Mix Apple and ORANGES,” Editorial Indian Journal of Clinical Biochemistry, Vol. 24, No. 3, 2009, pp. 211-214. doi:10.1007/s12291-009-0040-z
- B. Halliwell, J. M. C. Gutteridgeand and C. E. Cross, “Free Radicals, Antioxidants, and Human Disease: Where Are We Now?” Journal of Laboratory and Clinical Medicine, Vol. 119, No. 6, 1992, pp. 598-620.
- P. Van’t Veer, M. C. Jansen, M. Kleark and F. J. Kok, “Fruits and Vegetables in the Prevention of Cancer and Cardiovascular Disease,” Public Health Nutrition, Vol. 3, 2000, pp. 103-107.
- G. H. Cao, E. Sofic and L. R. Prior, “Antioxidant Capacity of Tea and Common Vegetables,” Journal of Agricultural and Food Chemistry, Vol. 44, No. 11, 1996, pp. 3426-431. doi:10.1021/jf9602535
- R. G. Takeoka and T. L. Dao, “Antioxidant Constituents of Almond Hulls,” Journal of Agricultural and Food Chemistry, Vol. 51, No. 20, 2003, pp. 496-501.
- F. Shahidi and M. Naczk, “Phenolic Compounds in Grains. in Food Phenolics,” Source, Chemistry Effects Applications, Technomic Publishing Company Inc. Lancaster PA, 1995, pp. 3-39.
- S. Richfort and J. Panozzo, “Phytochemicals for Health, the Role of Pulses,” Journal of Agricultural and Food Chemistry, Vol. 55, No. 20, 2007, pp. 7981-7994. doi:10.1021/jf071704w
- M. Dong, X. J. He and R. H. Lieu, “Phytochemicals of Black Bean Seed Coats; Isolation, Structure Elucidation and Their Antiproliferative and Antioxidative Activities,” Journal of Agricultural and Food Chemistry, Vol. 55, No. 15, 2007, pp. 6044-6051. doi:10.1021/jf070706d
- P. Stratil, B. Klejdus and V. Kuban, “Determination of Total Content of Phenolic Compounds and Their Antioxidant Activity in Vegetables Evaluation of Spectrophotometric Methods,” Journal of Agricultural and Food Chemistry, Vol. 54, No. 3, 2006, pp. 607-616. doi:10.1021/jf052334j
- C. Vijya, K. Reddy, D. Sreeramulu and M. Raghunath, “Antioxidant Activity of Fresh and Dry Fruits Commonly Consumed in India,” Food Research International, Vol. 43, No. 1, January 2010, pp. 285-288. doi:10.1016/j.foodres.2009.10.006
- R. P. Sing, K. N. Chidambara Murthy and G. K. Jayaprakash, “Studies on the Antioxidant Activity of Pomegranate Peel and Seed Extracts Using in Vitro Models,” Journal of Agricultural and Food Chemistry, Vol. 50, No. 1, 2002, pp. 81-86. doi:10.1021/jf010865b
- H. Zielinski and H. Kozlowska, “Antioxidant Activity and Total Phenolics in Selected Cereal Grains and Their Different Morphological Fractions,” Journal of Agricultural and Food Chemistry, Vol. 48, No. 6, 2000, pp. 2008-2016. doi:10.1021/jf990619o
- B. Matthaus, “Antioxidant Activity of Extracts Obtained from Residues of Different Oil Seeds,” Journal of Agricultural and Food Chemistry, Vol. 50, No. 12, 2002, pp. 3444-3452. doi:10.1021/jf011440s
- I. Arcan and A. Yemenicioglu, “Antioxidant Activity and Phenolic Content of Fresh and Dry Nuts with and without the Seed Coat,” Journal of Food Composition and Analysis, Vol. 22, No. 3, May 2009, pp. 184-188.
- L. L. Yu, S. Haley, J. Perret, M. Harris, J. Wilson and M. Qian, “Free Radical Scavenging Properties of Wheat Extracts,” Journal of Agricultural and Food Chemistry, Vol. 50, No. 6, 2002, pp. 1619-1624. doi:10.1021/jf010964p
- H. Aoshima, H. Tsunoue, H. Koda and Y. Kiso, “Aging of Whiskey Increases 1,1-Diphenyl-2-picrylhydrazyl Radical Scavenging Activity,” Journal of Agricultural and Food Chemistry, Vol. 52, No. 16, 2004, pp. 5240-5244. doi:10.1021/jf049817s
- F. F. Iris Benzie and J. J. Strain, “Ferric Reducing/AntiOxidant Power Assay: Direct Measure of Total Antioxidant Activity of Biological Fluids and Modified Version for Simultaneous Measurement of Total Antioxidant Power and Ascorbic Acid Concentration,” Methods in Enzymology, Vol. 299, 1999, pp. 15-27. doi:10.1016/S0076-6879(99)99005-5
- V. L. Singleton and J. A. Rossi, “Colorimetry of Total Phenols with Phosphomolybdic Phosphotungstic acid Reagents,” American Journal of Enology and Viticulture, Vol. 16, No. 3, 1965, pp. 144-158.
- M. Claudine, W. Gary, M. Christine and S. Augustin, “Bioavailability and Bioefficacy of Polyphenols in Humans: Review of 97 Bioavailability Studies,” American Journal of Clinical Nutrition, Vol. 81, No. 1, 2005, pp. 230-242.
- A. J. Vinson, X. H. Su, L. Zubik and P. Bose, “Phenol Antioxidant Quantity and Quality in Foods: Fruits,” Journal of Agricultural and Food Chemistry, Vol. 49, No. 11, 2001, pp. 5315-5321. doi:10.1021/jf0009293
- J. A. Vinson, Y. Hao, X. Su and L. Zubik, “Phenol Antioxidant Quantity and Quality in Foods: Vegetables,” Journal of Agricultural and Food Chemistry, Vol. 46, No. 9, 1998, pp. 3630-3634.
- U. S. Kadam, S. B. Ghosh, D. Strayo, P. Suprasanna, T. P. A. Devasagayam and V. A. Bapat, “Antioxidant Activity in Sugarcane Juice and Its Protective Role against Radiation Induced DNA Damage,” Food Chemistry, Vol. 106, No. 3, February 2008, pp. 1154-1160. doi:10.1016/j.foodchem.2007.07.066
- S. Nair, R. Nagar and R. Gupta, “Antioxidant Phenolics and Flavonoids in Common Indian Foods,” Journal of Association of Physicians of India (JAPI), Vol. 46, No. 8, 1998, pp. 708-710.
- D. Sreeramulu, C. V. Reddy and M. Raghunath, “Antioxidant Activity of Commonly Consumed Cereals, Millets, Pulses and Legumes in India,” Indian Journal of Biochemistry & Biophysics, Vol. 46, 2009, pp. 112-115.
- A. Luximon-Ramma, T. Bahorun, M. A. Soobrattee and I. Okezie, “Antioxidant Activities of Phenolic Proanthocyanidin and Flavonoid Components in Extracts of Cassia Fistula,” Journal of Agricultural and Food Chemistry, Vol. 50, No. 18, 2002, pp. 5042-5047. doi:10.1021/jf0201172
- D. Huang, B. Ou and R. L. Prior, “Review on AOA Methods: The Chemistry behind Antioxidant Capacity Assays,” Journal of Agricultural and Food Chemistry, Vol. 53 No. 6, 2005, pp. 1841-1856. doi:10.1021/jf030723c
- M. Ozgen, R. N. Reese, A. Z. Tulio Jr., J. C. Scheernens and A. R. Miller, “Modified 2,2-Azino-bis-3-ethyl-benzothiazoline-6-sulfonic Acid (ABTS) Method to Measure Antioxidant Capacity of Selected Small Fruits and Comparison to Ferric Reducing Antioxidant Power(FRAP) and 2,2-Diphenyl-1-picrylhydrazyl (DPPH) Methods,” Journal of Agricultural and Food Chemistry, Vol. 54, No. 4, 2006, pp. 1151-1157. doi:10.1021/jf051960d
- L. Bravo, “Polyphenols: Chemistry, Dietary Sources, Metabolism & Nutritional Significance,” Nutrition Review, Vol. 56, No. 11, November 1998, pp. 317-333.
- B. Payet, A. S. C. Sing and J. Smadja, “Assessment of Antioxidant Activity of Cane Brown Sugers by ABTS and DPPH Radical Scavenging Assays: Determination of Their Polyphenolic and Volatile Constituents,” Journal of Agricultural and Food Chemistry, Vol. 53, No. 26, 2005, pp. 10074-10079. doi:10.1021/jf0517703
- J. M. Duarte-Almeida, A. V. Novoa, A. F. Linares, F. M. Lrjolo and M. I. Genovese, “Antioxidant Activity of Phenolic Compounds from Sugar Cane Juice (Saccharum Officinarum L),” Plant Foods for Human Nutrition, Vol. 61, No. 4, 2006, pp. 187-192. doi:10.1007/s11130-006-0032-6
- M. Akbulut, M. M. Ozcan and H. Coklar, “Evalution of Antioxidant Activity, Phenolic, Mineral Contents and Some Physicochemical Properties of Several Pine Honeys Collected from Western Anatolia,” International Journal of Food Science and Nutrition, Vol. 60, No. 7, 2009, pp. 577-589. doi:10.1080/09637480801892486
- M. P. Kahkonen, A. I. Hopia, H. J. Vuorela, J.-P. Rauha, K. Pihlaja, T. S. Kujala and M. Heinonen, “Antioxidant Activity of Plant Extracts Containing Phenolic Compounds,” Journal of Agricultural and Food Chemistry, Vol. 47, No. 10, 1999, pp. 3954-3962. doi:10.1021/jf990146l
- U. Imeh and S. Khokhar, “Distribution of Conjugated and Free Phenols in Fruits: Antioxidant Activity and Cultivar Variations,” Journal of Agricultural and Food Chemistry, Vol. 50, No. 22, 2002, pp. 6301-6306. doi:10.1021/jf020342j