Social Networking
Vol.3 No.1(2014), Article ID:42395,8 pages DOI:10.4236/sn.2014.31006
Determining Leaders and Communities on Networks Using Neighborhood Similarity
Computer Science Department, Houghton College, Houghton, USA
Email: wei.hu@houghton.edu
Copyright © 2014 Benjamin Valyou et al. This is an open access article distributed under the Creative Commons Attribution License, which permits unrestricted use, distribution, and reproduction in any medium, provided the original work is properly cited. In accordance of the Creative Commons Attribution License all Copyrights © 2014 are reserved for SCIRP and the owner of the intellectual property Benjamin Valyou et al. All Copyright © 2014 are guarded by law and by SCIRP as a guardian.
Received November 23, 2013; revised December 26, 2013; accepted January 12, 2014
KEYWORDS
Community Detection; Community Leaders; Node Importance; Centrality; Neighborhood Similarity; Modularity
ABSTRACT
Networks are used to represent interactions in a wide variety of fields, like biology, sociology, chemistry, and more. They have a great deal of salient information contained in their structures, which have a variety of applications. One of the important topics of network analysis is finding influential nodes. These nodes are of two kinds —leader nodes and bridge nodes. In this study, we propose an algorithm to find strong leaders in a network based on a revision of neighborhood similarity. This leadership detection is combined with a neighborhood intersection clustering algorithm to produce high quality communities for various networks. We also delve into the structure of a new network, the Houghton College Twitter network, and examine the discovered leaders and their respective followers in more depth than which is frequently attempted for a network of its size. The results of the observations on this and other networks demonstrate that the community partitions found by this algorithm are very similar to those of ground truth communities.
1. Introduction
Many complex interactions can be represented by networks, which are collections of nodes connected by edges. The connections denoted by edges can vary depending on the network; in a food web an edge would signify consumption, while in the world of social media services such as Facebook and Twitter, an edge signifies something akin to a friendship. Many other types of networks exist as well, such as virus transmission, infrastructure topology, and collaboration networks.
Much attention has been given to community detection on networks, partitioning a network into disjoint sets of nodes characterized by greater interior edge-density than exterior, called communities. Many community detection algorithms have been proposed and utilized with varying degrees of effectiveness. The Label Propagation Algorithm (LPA) is such a method which is impressively effective, boasting elegant simplicity and near-linear runtime. LPA works by having each node select a label from its neighborhood to adopt as its own. Each node initially has a unique label. After a set number of iterations, LPA terminates and the labels of the nodes of the network are returned [1]. Many other methods have been developed as well, such as Speaker-listener LPA (SLPA) [2], LabelRank [3], and Local Tightness Expansion (LTE) [4].
One particularly interesting method of determining communities in a network is an extension of the k-means algorithm for clustering Euclidean data points. The kmeans algorithm begins with specifying a number of clusters to find (k). It then chooses a set of initial centroids points which act as cores for the clusters. Each data point is assigned to its nearest centroid, after which each centroid is recalculated as the average position of the points assigned to it. This process continues iteratively until the centroids stabilize. The Top Leaders algorithm proposed in [5] uses a similar method. From the network and a predefined number of communities, it determines starting leaders. Several methods of determining initial leadership are suggested, such as random initialization, maximal degree-based initialization, and others. A fitness function is applied to each leader-node pair, and each node is assigned to its highest scoring leader. In [5] the fitness function is a simple comparison of neighborhoods between a leader and a node, but other functions could be used. This neighborhood comparison involves determining the set of nodes neighboring the node and the leader at a given depth and finding the size of the intersection. The depth parameter is incremented, expanding the search for common neighbors, until either one candidate leader is determined to have higher overlap or a depth threshold is reached. Once all nodes have been grouped with leaders, the leaders are recalculated to the most degree-central node in their respective communities. Nodes are then reassigned and the process continues until the leaders reach equilibrium.
This approach has distinct value. It finds cohesive communities centered on prominent nodes in the network, but it also has the drawback of requiring the user to know the number of communities in the network. There are methods of estimating this number, but these algorithms are generally other community detection algorithms. Even knowing the number of communities, the top leaders’ algorithm is sensitive to its initial set of leaders.
We propose an algorithm for determining high quality leaders in a network based on neighborhood similarity. This function is combined with the Top Leaders clustering function to generate high quality community partitions without the need for iterative refinements. This algorithm does not require a predetermined number of communities, as it will discover a natural number of leaders for a network.
2. Networks
The representation of networks is quite simple. A network G = (V, E) has n nodes and m edges. Any operation that is done based on the structure of a network can be performed using an adjacency matrix —an
—an  by
by  matrix where an edge from node
  to node
  is represented by a 1 in position
 , and a lack of an edge is represented by a 0. Networks can also be weighted or directed. In weighted networks, values in the adjacency matrix are not simply 1 s and 0 s, but are replaced with the relevant edge-weights. In directed networks, edges are not bi-directional, which means that the value
  is not necessarily equal to
 . In undirected networks, these values are always the same.
For this study, we use a combination of small and large undirected networks to compare the performance of our algorithm to that of other algorithms. Zachary’s Karate Club is a frequently used benchmark in terms of quality of community detection, with a well-known ground truth partition into two communities of roughly half the network each [6]. A new network with a known ground truth membership is the Pilgrim network introduced by Brian Dickinson [7]. It is a social network produced from the friendships of senior students in Dickinson’s high school, with 34 nodes, 128 edges, and an impressive variety of different communities. It is composed of a tight, small clique, a pair of dense and interconnected larger communities, and a fourth relatively sparse community. These communities can be seen in Figure 1. A third small network suitable for comparisons against a ground truth community partition is the dolphin network, which was constructed from observations of 68 dolphins in New Zealand divided between two communities [8].
Other small networks used are the jazz network, which is a network of jazz musician collaboration, and the college football network [9,10].
The large networks included for study are called ca-HepTh, ca-HepPh, ca-CondMat, and ca-AstroPh [11]. These four are co-authorship networks from the arXiv e-print archive.1 The first, ca-HepTh is a co-authorship network of high energy theoretical physics publications. Ca-HepPh is from the high energy physics phenomenology section. Ca-CondMat was produced using the coauthorship from arXiv’s condensed matter publications. Lastly ca-AstroPh is from the publications in the astrophysics category.
The last network used in this study is the Houghton College Twitter network developed by William Deitrick at Houghton College. It represents Twitter associations centered on the Twitter account @HoughtonCollege. It was assembled by crawling the followers and friends of @HoughtonCollege, representing follows between the users as undirected edges. Accounts following more than 600 users were excluded. The @HoughtonCollege node and all nodes connected only to it were removed, producing a network of 797 nodes and 5238 edges. This network is a valuable tool for studying the results of community detection algorithms on larger networks.
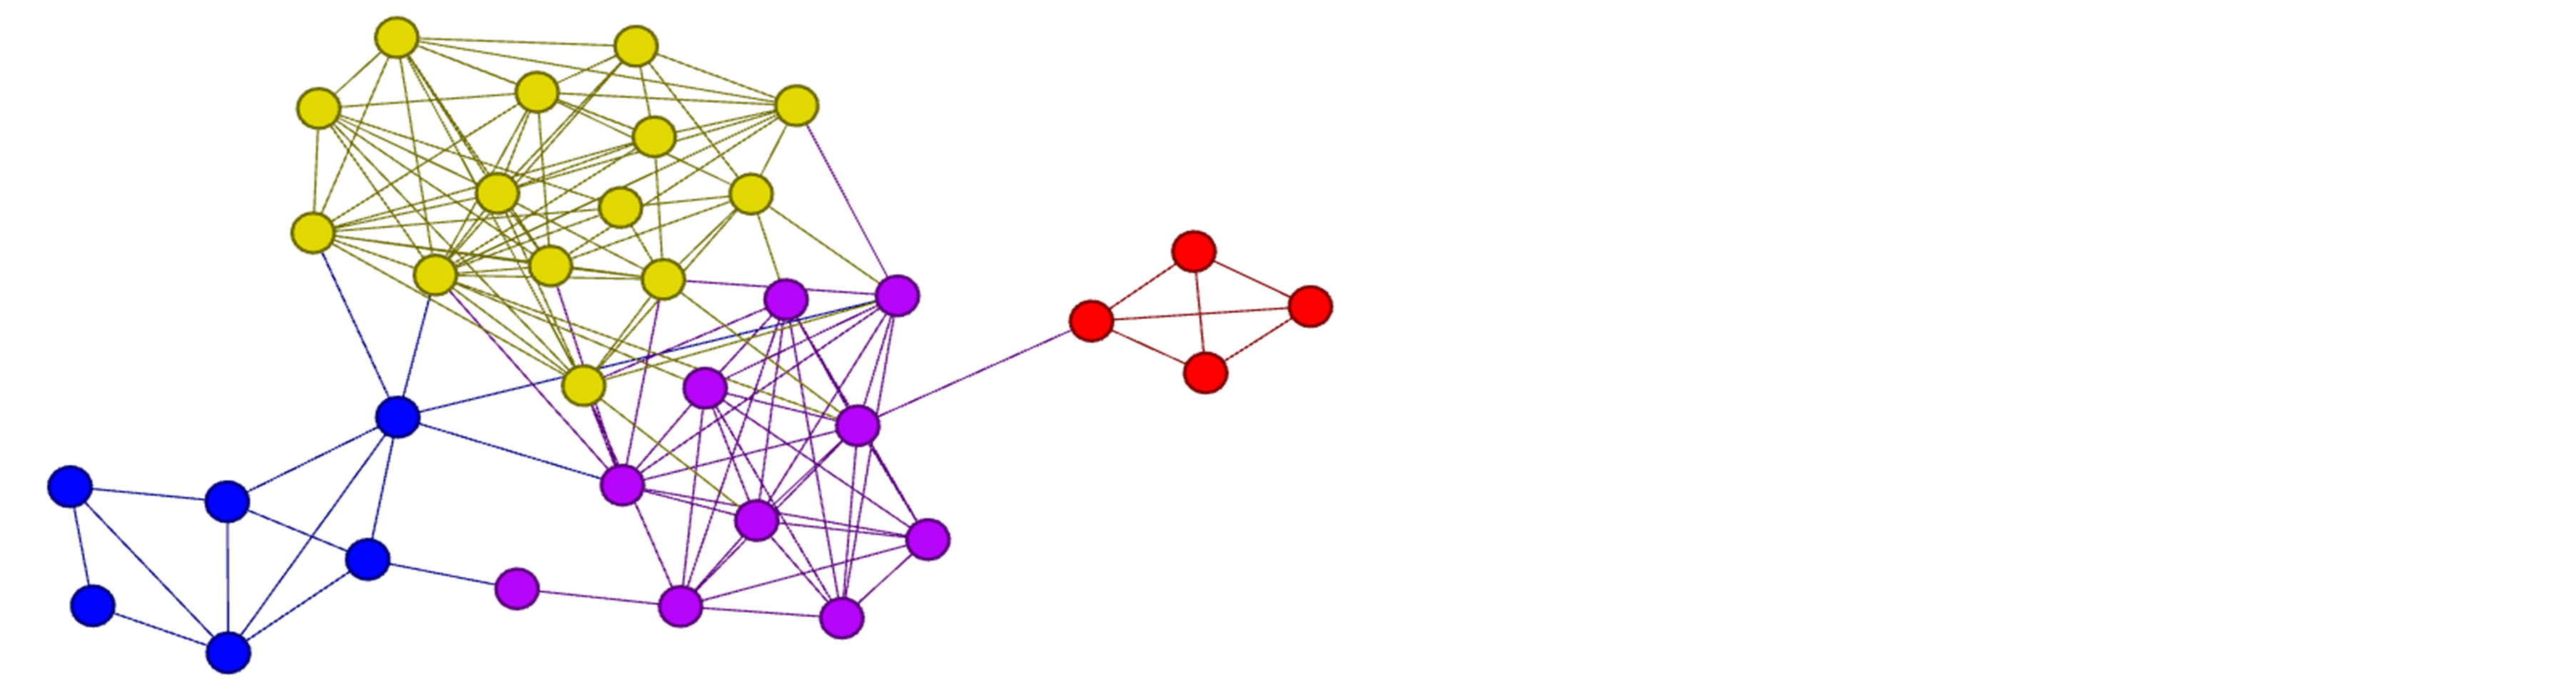
Figure 1. Ground truth community membership of the Pilgrim high school network. Each color represents a distinct community.
Despite lacking a known ground truth community membership, there is a richness of information available about the different kinds of users in the network that is often lacking in large networks, which allows for a more thorough evaluation of the quality of a partition than simply assigning it a fitness score such as modularity.
3. Node Importance
An algorithm to determine high quality leaders in a network has more uses than merely community detection. The identities of influential nodes in the network are useful data in many other practical applications of the study of networks. Fields in which these data are useful include marketing, sociology, and virology. Influential nodes are generally divided into two categories, core nodes and bridge nodes. Core nodes, or leaders, are nodes at the heart of a community, around which communities are formed. Bridge nodes act as connections between two or more communities. Many measures of the importance of a node in a network, called centrality, have been developed. The three most frequently used centrality functions are degree centrality, betweenness centrality, and distance centrality.
Neighborhood similarity, proposed in [12], can also be adapted for use as a centrality function. In its original formulation, this measure compared the neighborhoods of two nodes at a given depth. It can be modified slightly for the purpose of determining fitness of individual nodes for leadership by summing a node’s similarity to its neighbors. The original function for neighborhood similarity is
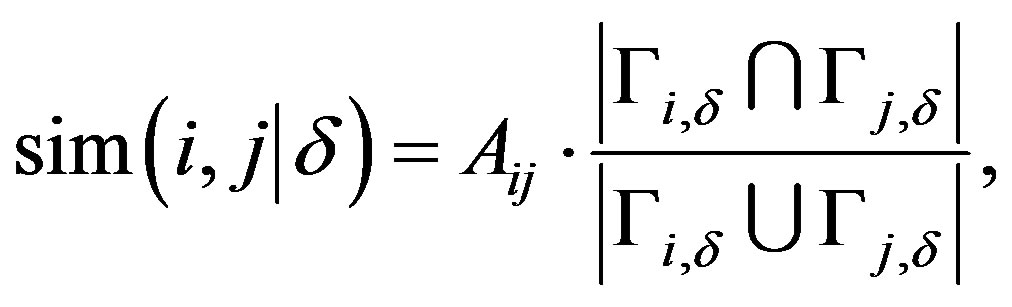 (1)
(1)
where  is the neighborhood of node
  at depth
 . The modified formulation of neighborhood similarity is straightforward to calculate for a given single node, as it is the average of the ratios of shared neighborhoods between it and neighbors. The
  variable is set to 1 in this revised formulation, because as neighborhood depth increases, the number of nodes in common drastically increases, which will raise similarity scores disproportionately. The equation for the neighborhood similarity centrality function is
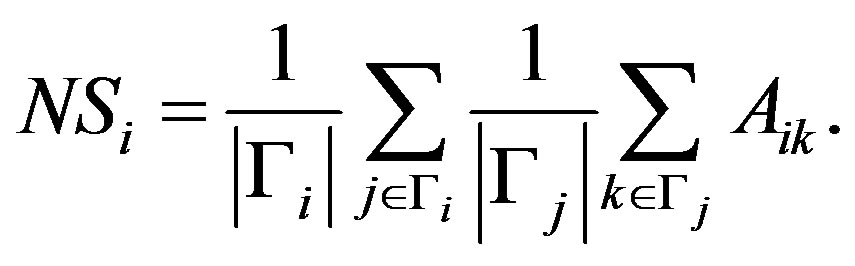 (2)
(2)
Neighborhood similarity is a measurement of the cohesiveness in the neighborhood of a node. This cohesiveness is integral to the definition of a community, as a good community has higher internal degree than its external degree. Nodes with highly interconnected neighborhoods will be leaders, while nodes with disjoint neighborhoods often act as bridge nodes. Because of the way it focuses on the neighborhood, it is logical to perform a local maximization to determine leaders. Each node with a higher similarity score than any of its neighbors is selected as a leader. The effect of this can be clearly seen in Figure 2, where the brightest nodes are nodes with neighborhood similarity values close to 1. Locally maximizing the function yields four nodes as leaders, one at the core of each of the ground truth communities for the network, which are shown in Figure 1. It can also be seen why a global maximization of neighborhood similarity would be ineffective; the three brightest nodes in Figure 2 are together in a clique. There are methods to handle such instances, some of which are discussed in [5], but this function is naturally suited to local maximization.
In some instances, low-degree nodes can be designated leaders according to neighborhood similarity, and in some of those cases the chosen node is not an optimal leader. In order to balance the degree of a node with its neighborhood similarity, a tuning parameter is applied following the equation
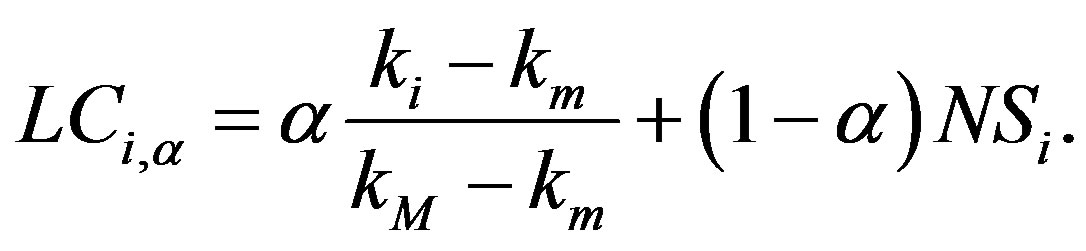 (3)
(3)
In this equation,  is the degree of node
 ,
,  and
and  are the maximum and minimum degree found on the network, respectively, and the tuning parameter is
 .
.
4. The Algorithm
The first step of the Neighborhood Similarity-Based Leadership (NSL) community detection algorithm is the leadership determination phase, which is shown in Algorithm 1. In this phase of the algorithm, each node has its leadership fitness assessed according to Equation (3). The fitness of each node is then compared against each of its neighbors. If it has the highest fitness, it is selected as a
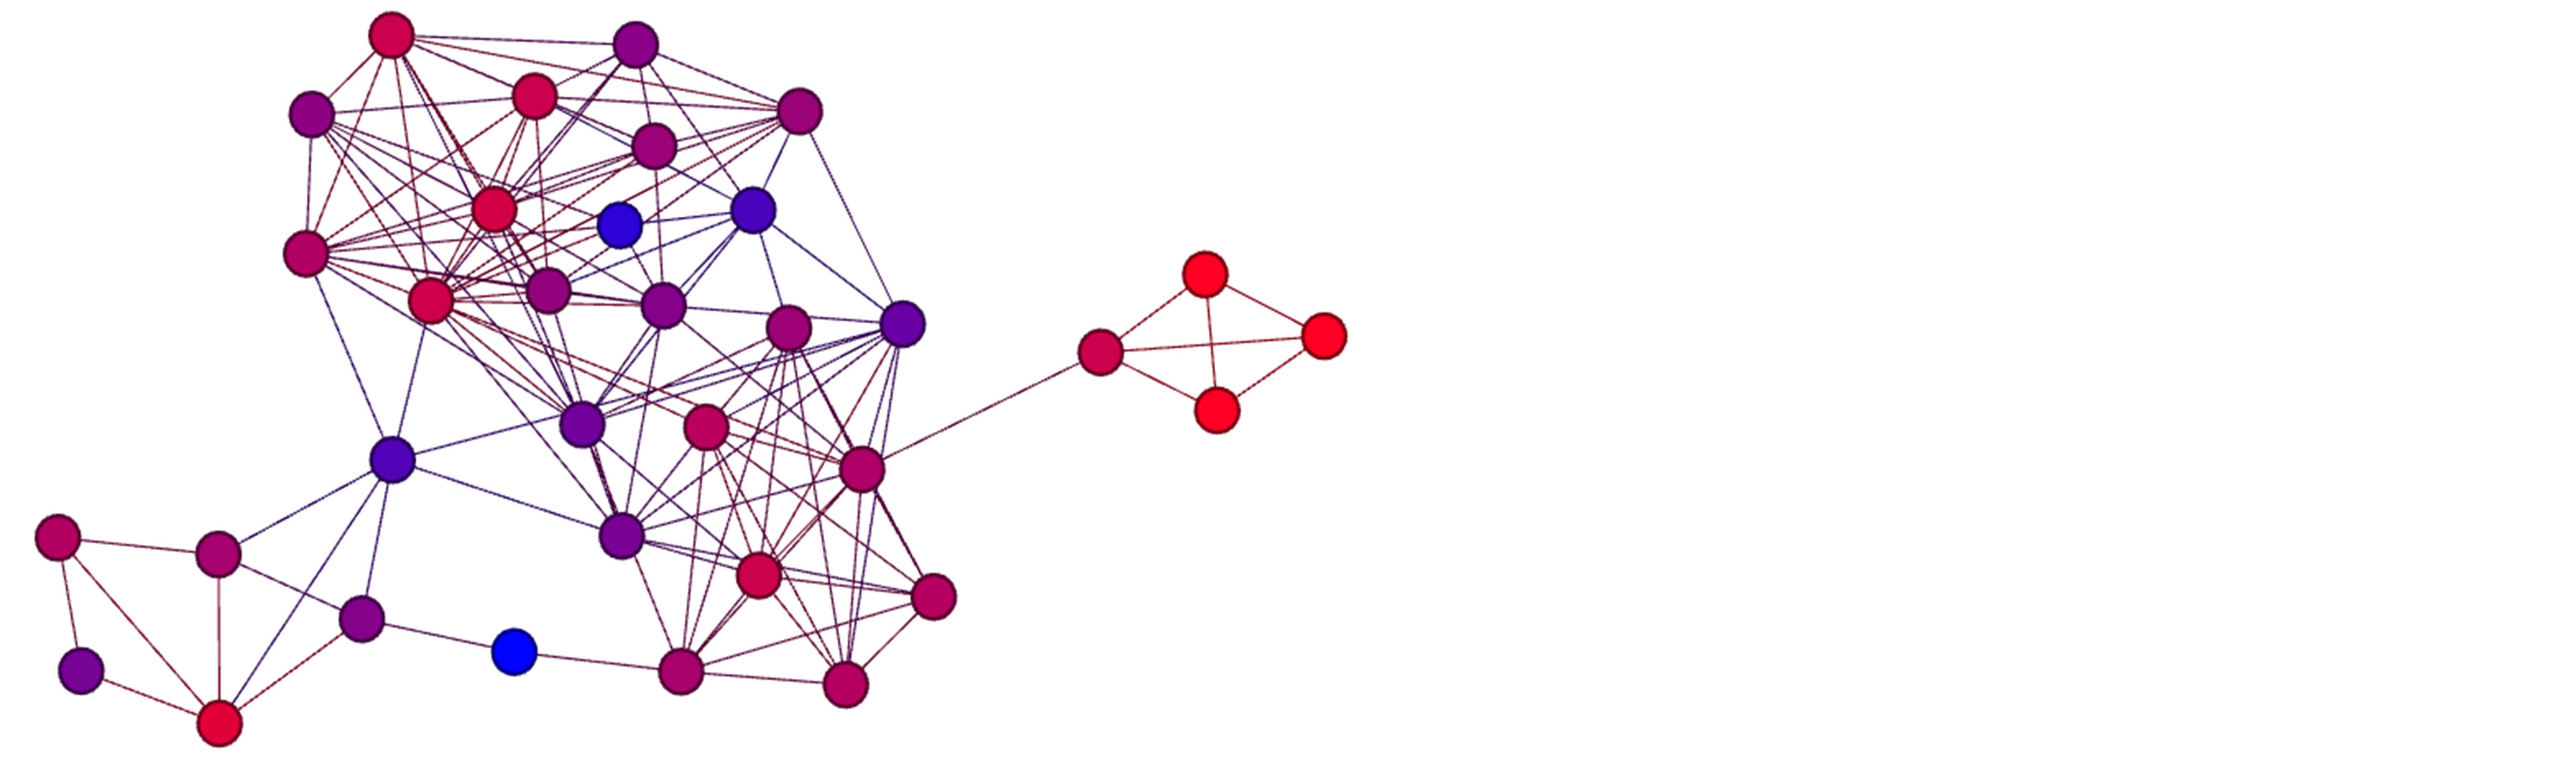
Figure 2. Heat map of neighborhood similarity scores on the Pilgrim high school network. Nodes in red have high similarity scores, while nodes in blue have low similarity scores.
leader. In the case of ties, the first node reached is chosen, as each is equally fit to lead. This subroutine then returns the set of leaders to the algorithm, which progresses to the clustering phase. Algorithm 2 is an overview of the clustering step. This subroutine is a modification of the clustering algorithm presented in [5], which places each node with its optimal leader. It does this by calculating the overlap between the neighborhood of the node in question and each leader. However, not all nodes are within two hops of their respective leaders, necessitating a depth parameter. This parameter defines the depth of the neighborhood for the node and the leaders it is comparing against, and the depth is incremented until only one leader is found or the maximum depth parameter,  , is reached. The original algorithm includes a step to update leaders until the optimal leaders are found. In this version, an iterative refinement of community leaders is unnecessary as the optimal leaders have already been selected.
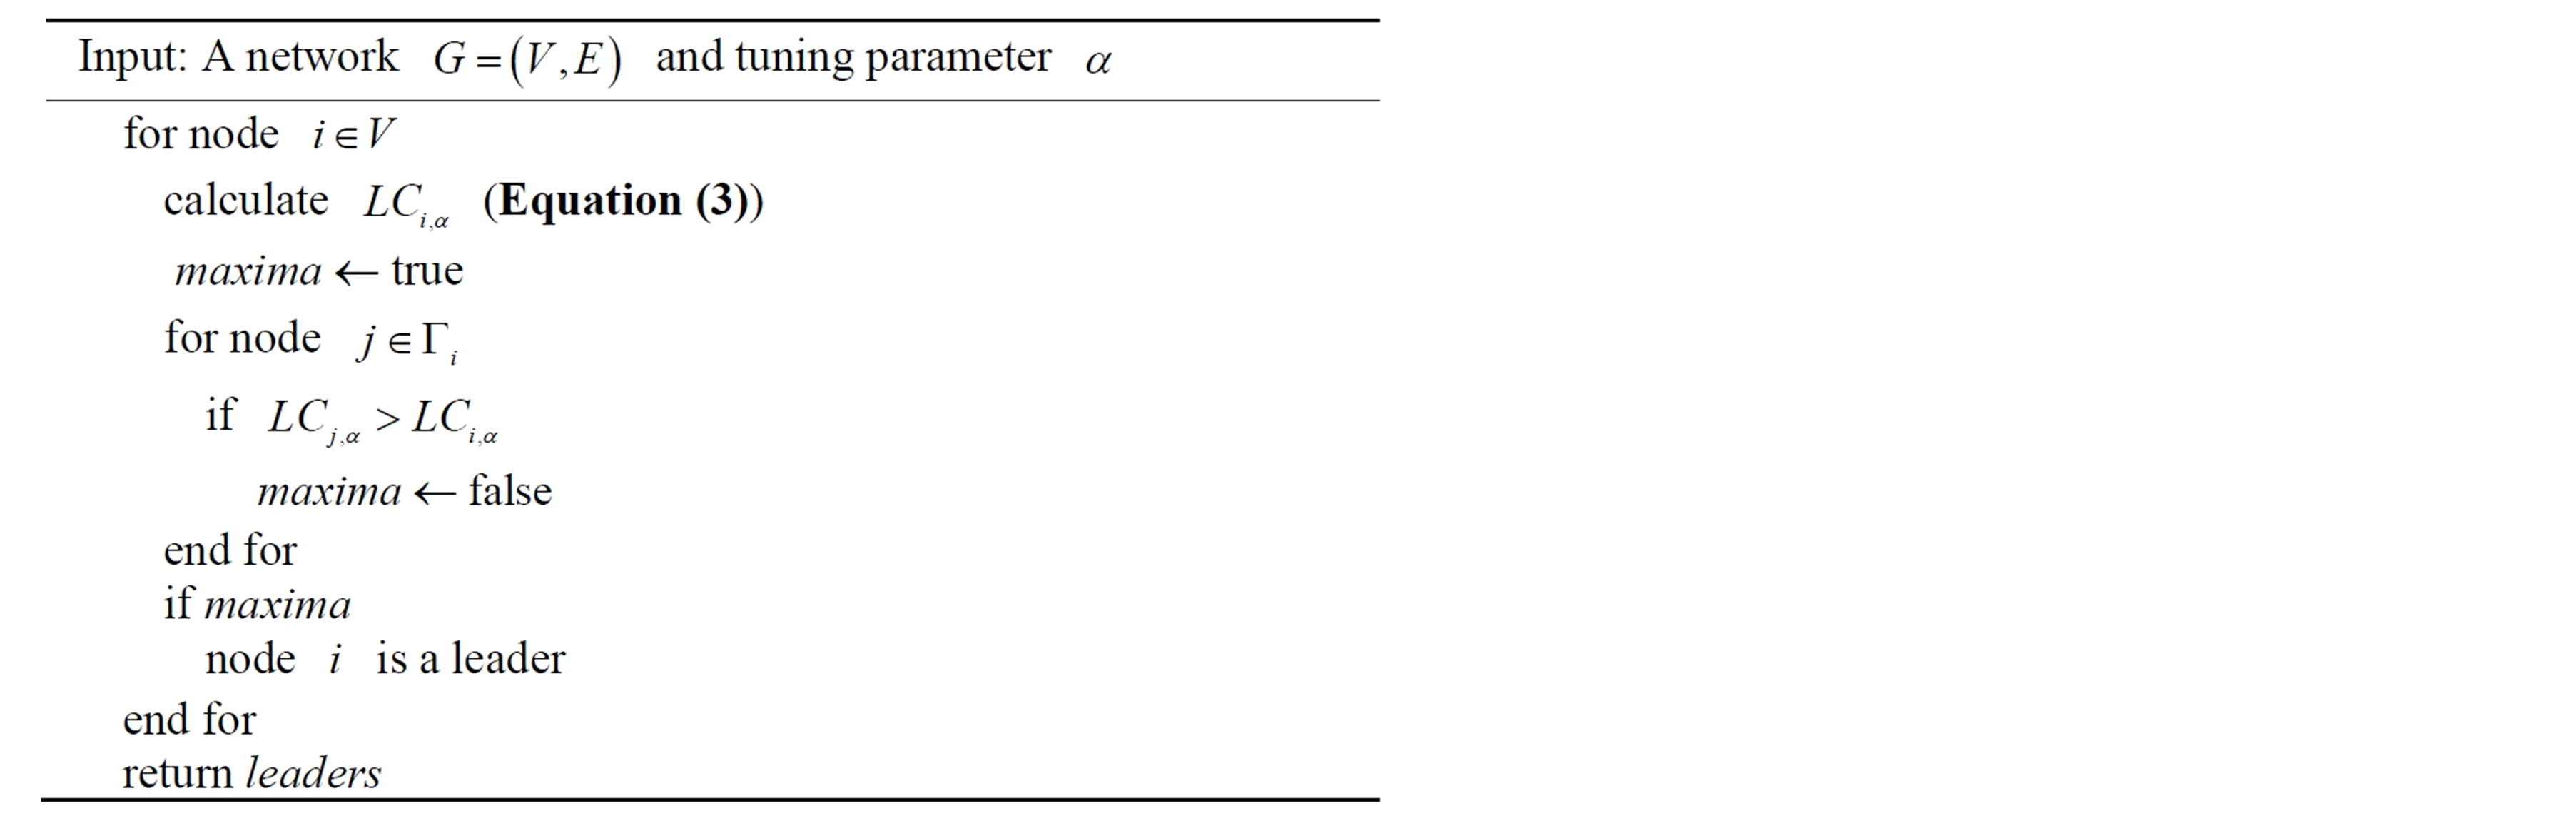
Algorithm 1. Determine leaders for a network.
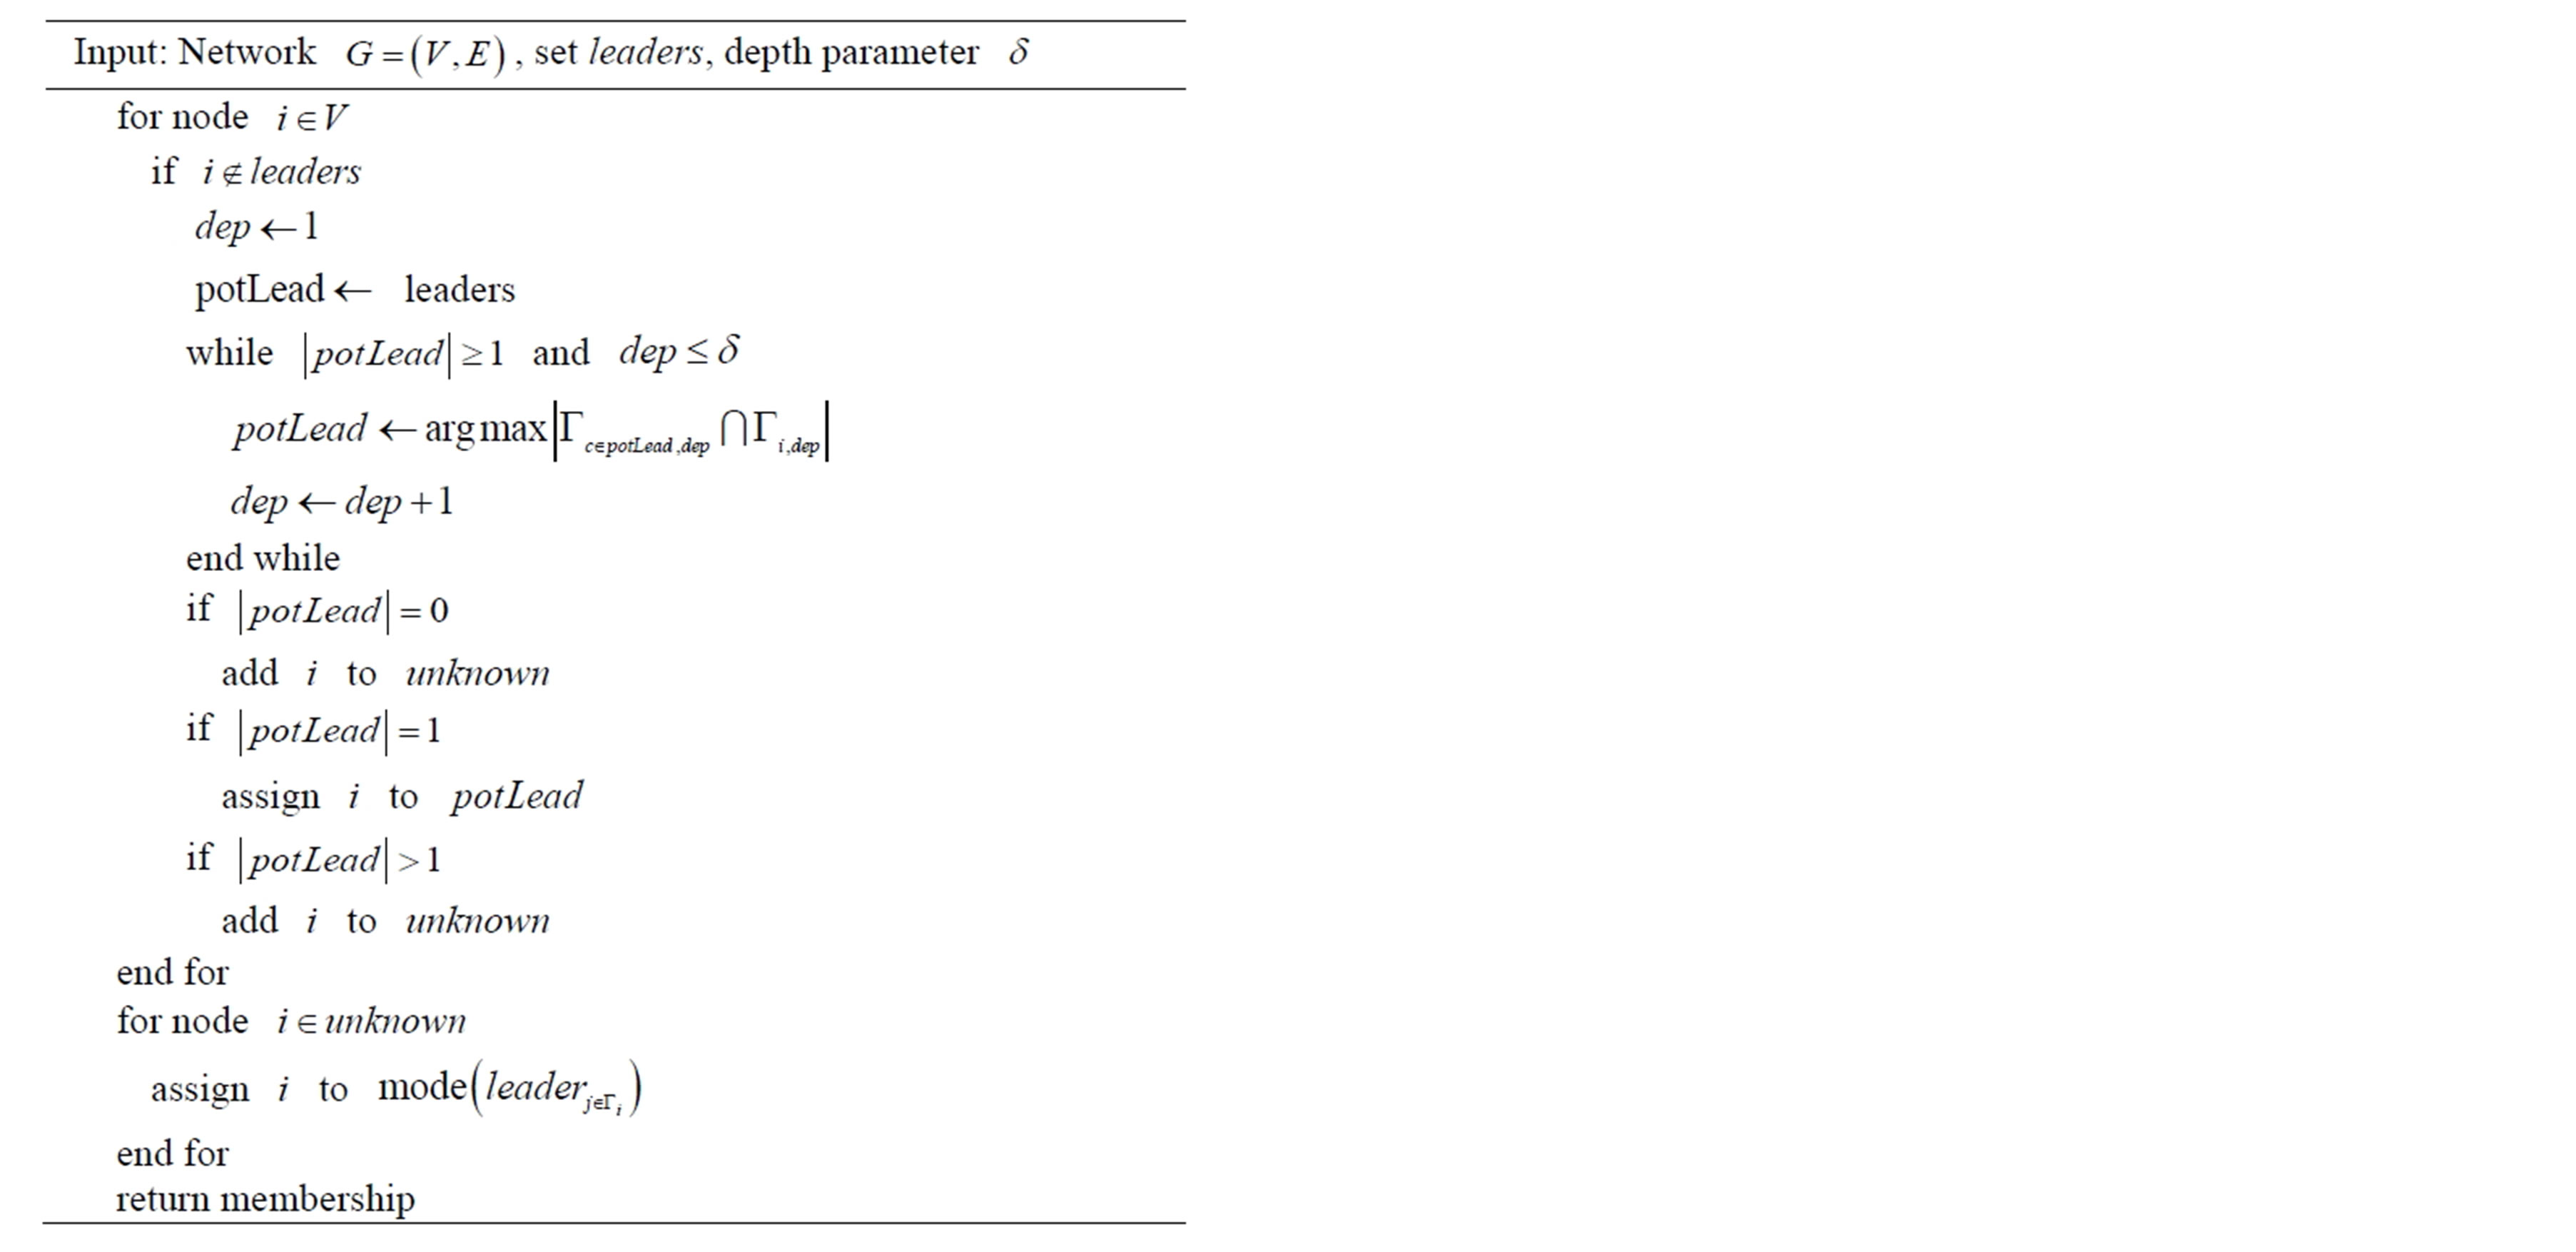
Algorithm 2. Match nodes with leaders.
5. Results
We compared the NSL algorithm to several of the community detection algorithms found in the igraph library for R on the test networks [13,14]. The algorithms used were LPA, Infomap [15], the fast greedy modularity optimization algorithm [16], and the multi-level modularity optimization algorithm. The primary metrics used were modularity and normalized mutual information (NMI). NMI scores were calculated between community membership vectors produced by each algorithm and the ground truth community membership on each network. A value of 0 indicates that the two vectors are completely uncorrelated, while a value of 1 indicates a perfect match.
5.1. Community Detection on Real Networks
Table 1 contains modularity scores for the tests on small networks. These modularity scores show that NSL yields comparable modularity scores to modularity optimization algorithms. The primary exception is the jazz network, on which NSL and Infomap both performed poorly in terms of modularity. Figure 3 shows a graph of the jazz network with the membership found by NSL and the multi-level modularity optimization algorithm, which had the highest modularity score. From these images we can see that modularity in this case breaks up a natural-looking community in favor of three smaller ones, which is similar to what happens in the modularitymaximized karate network partition when compared with its ground truth.
Figure 4 shows NMI scores compared against the available ground truth memberships. From this chart we see that NSL performed extremely well; it matched or outperformed every other algorithm on every network with only one exception. On the dolphin network, LPA achieved a higher NMI score than NSL by 0.0082. The NMI scores demonstrate the effectiveness of our algorithm, and point out an interesting trend. In each ground truth NMI comparison, NSL outperformed Infomap, despite how similar the two algorithms are in terms of modularity. Also, these improvements in NMI are correlated
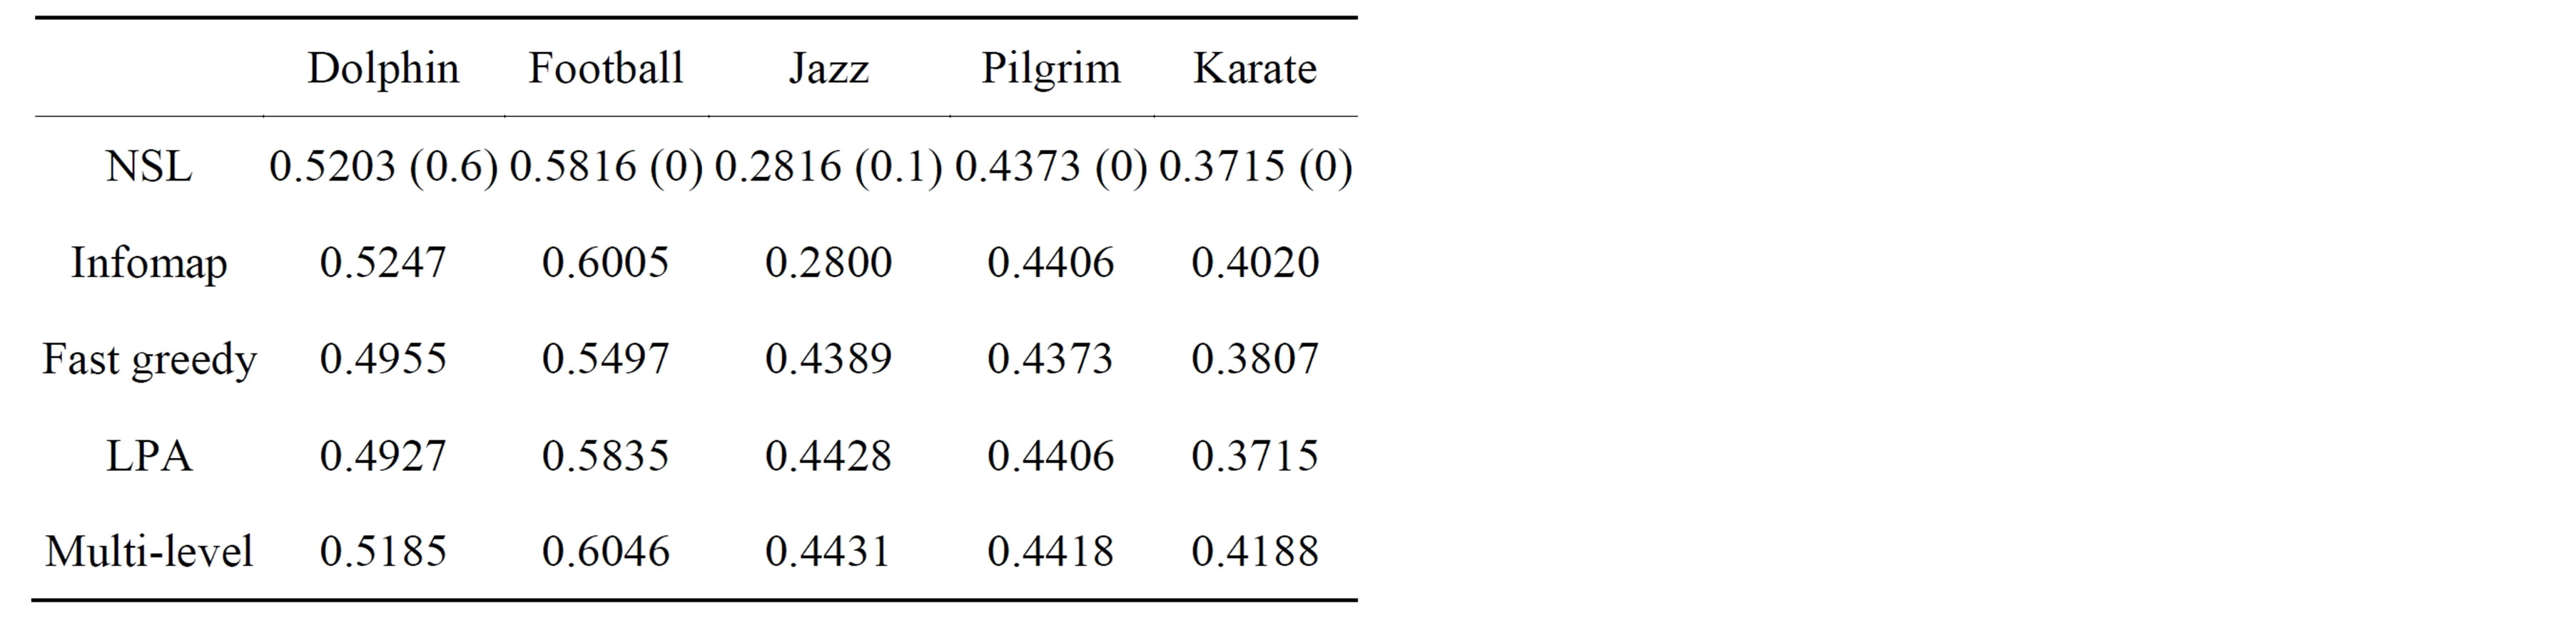
Table 1. Modularity scores for each of five small networks for each of five algorithms. Parenthetical numbers refer to the lowest α-value corresponding to the optimal result.
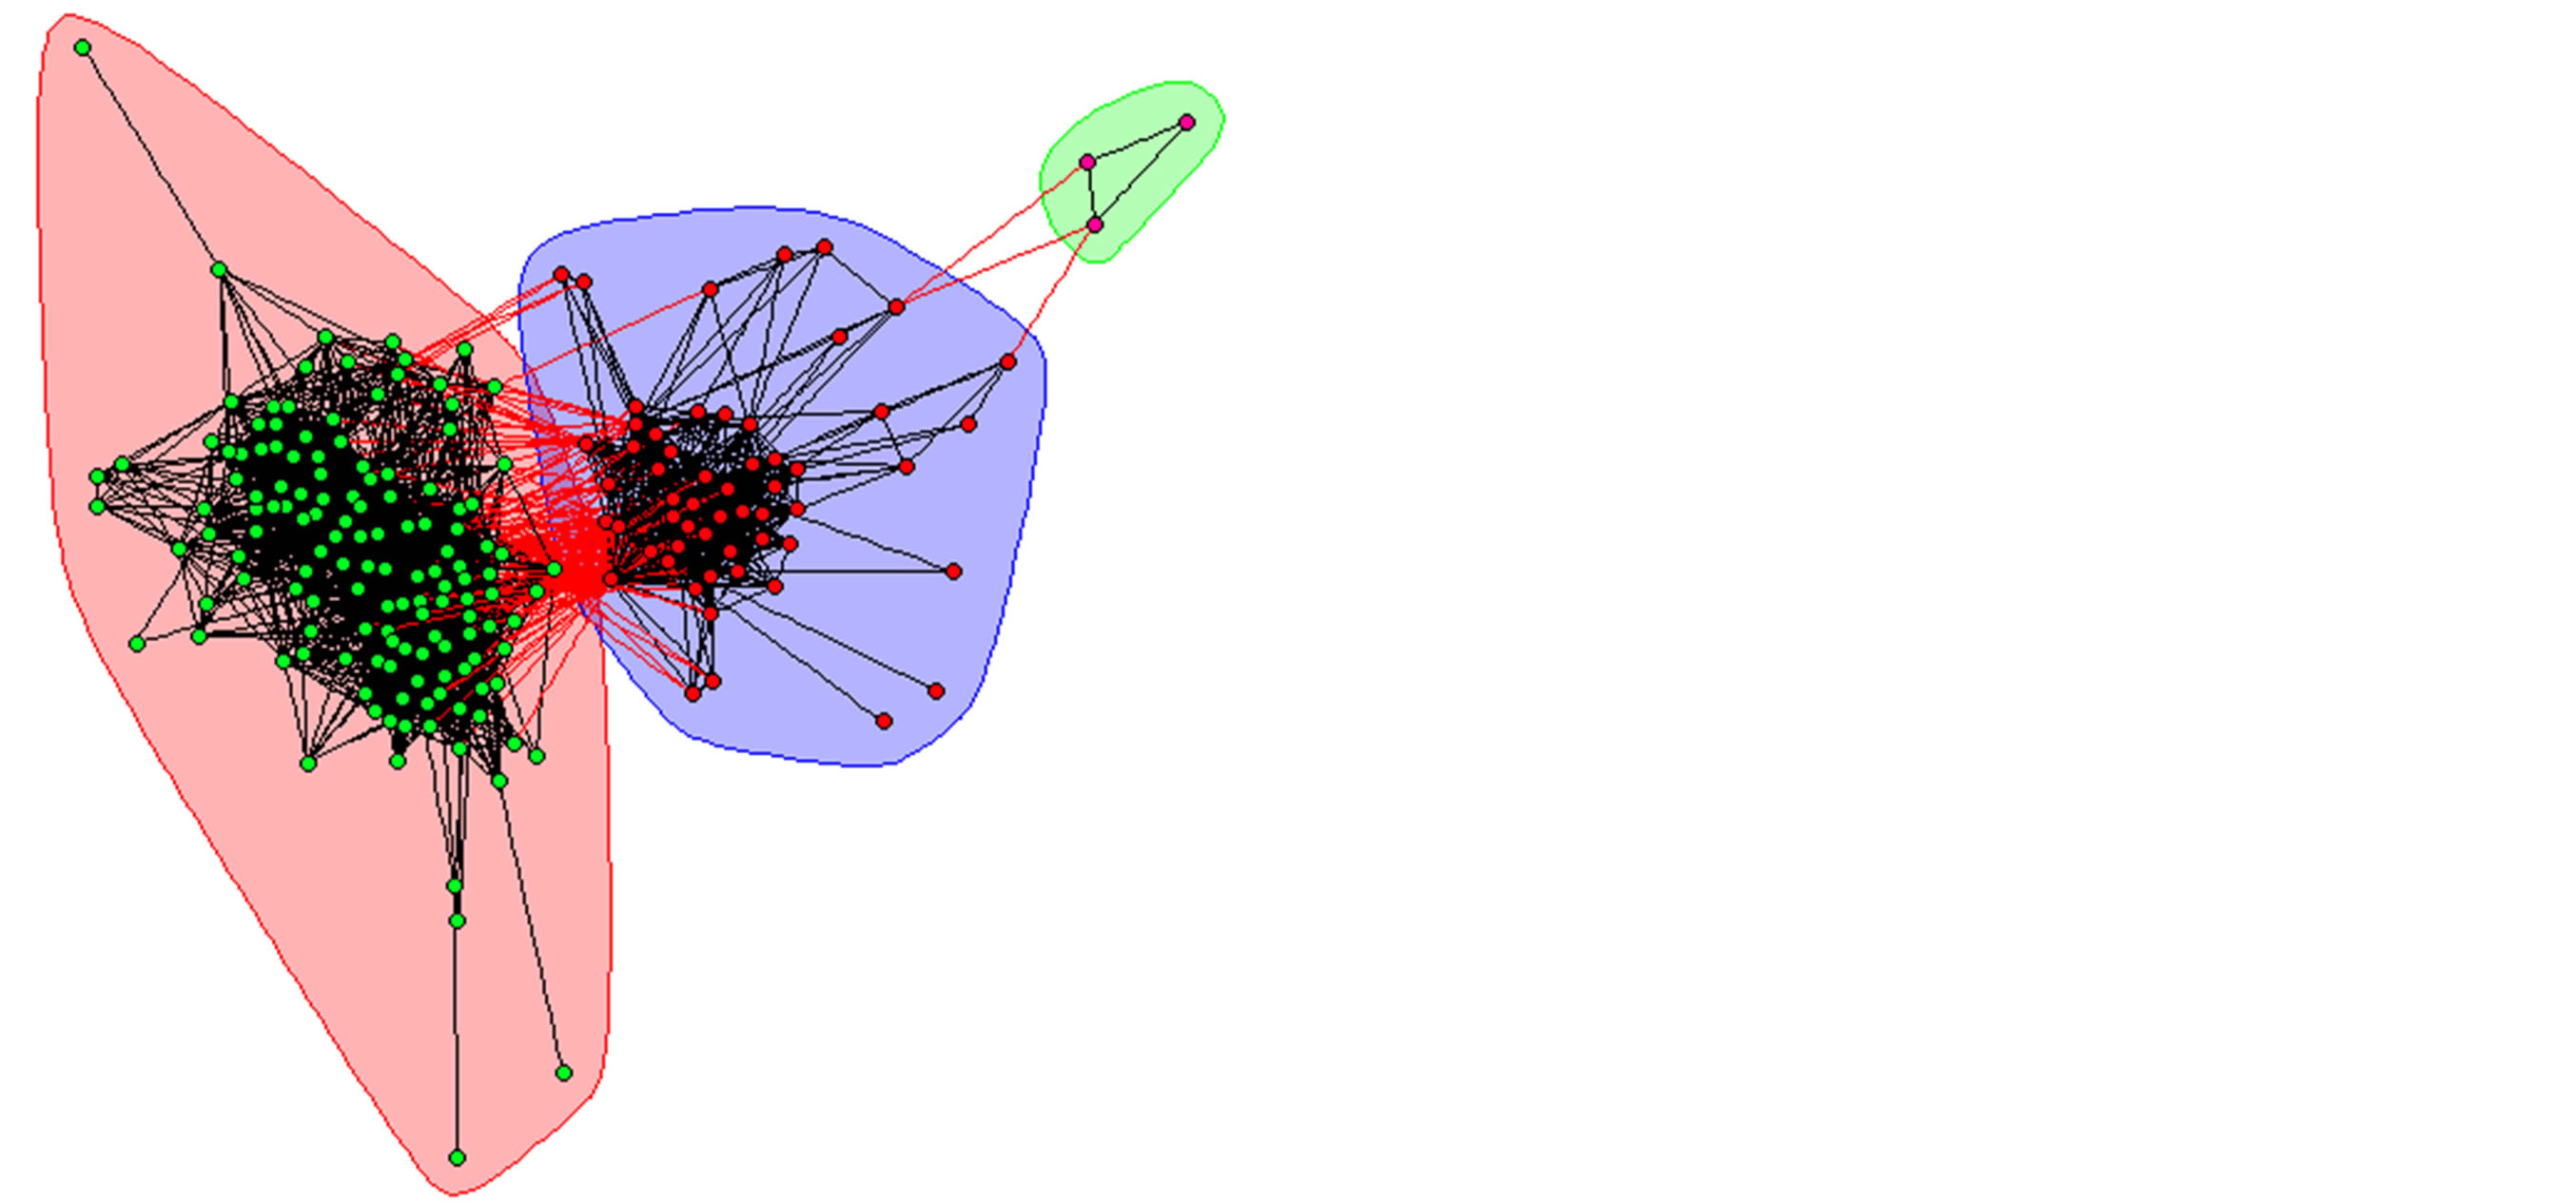
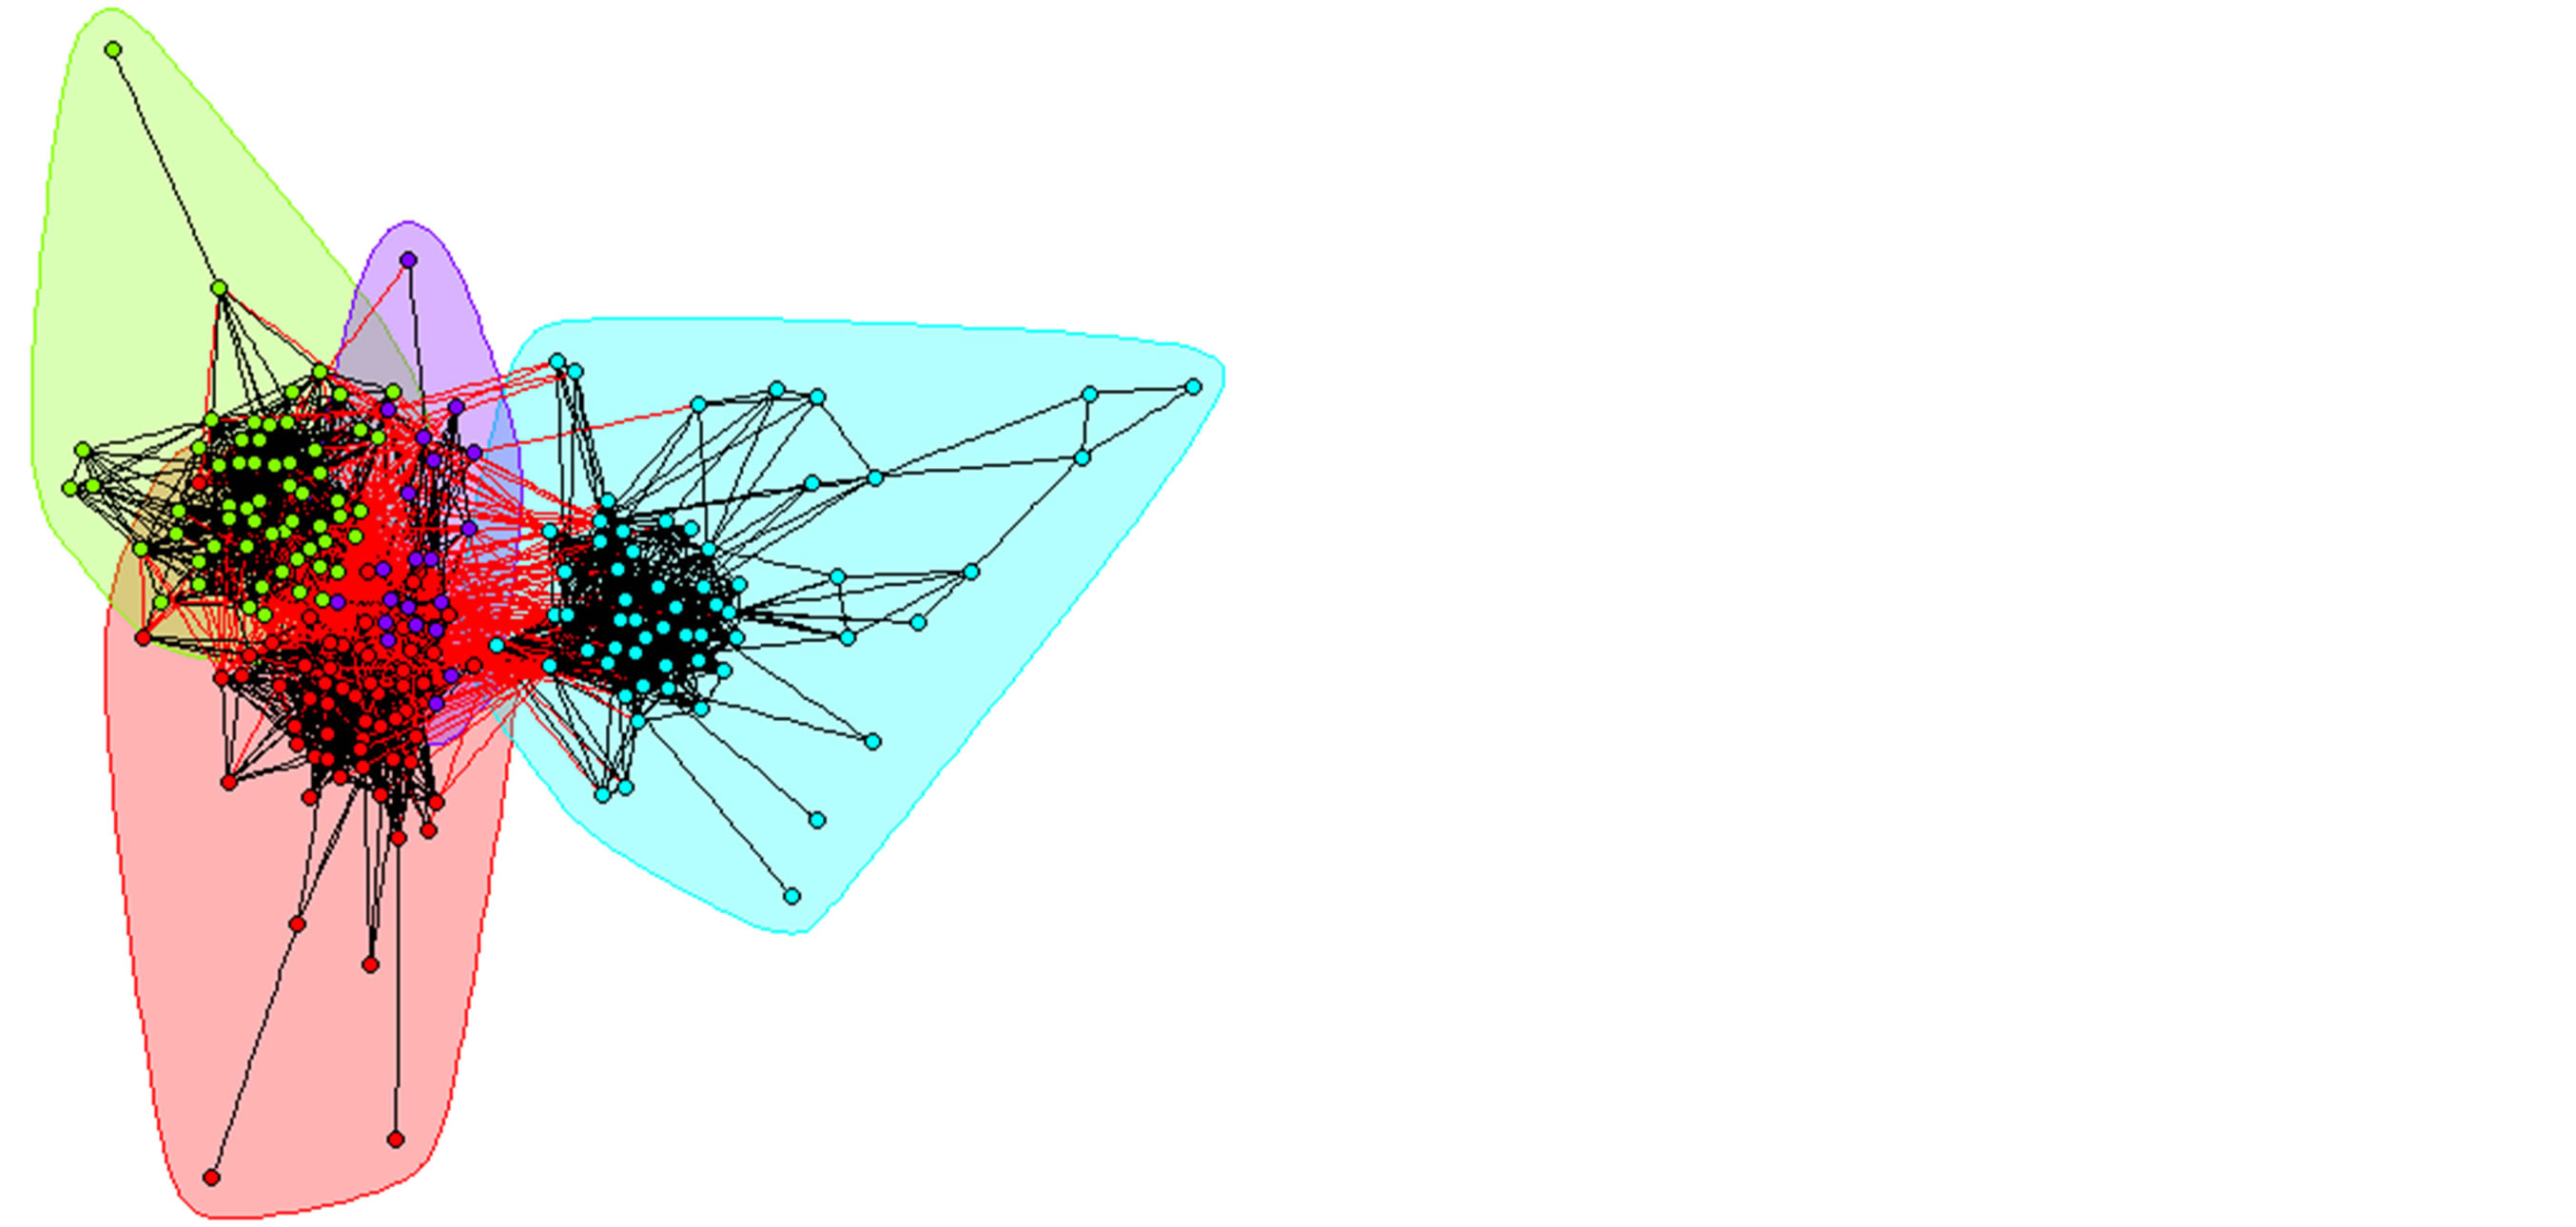
Figure 3. Jazz network community partitions by NSL (upper) and multi-level (lower).
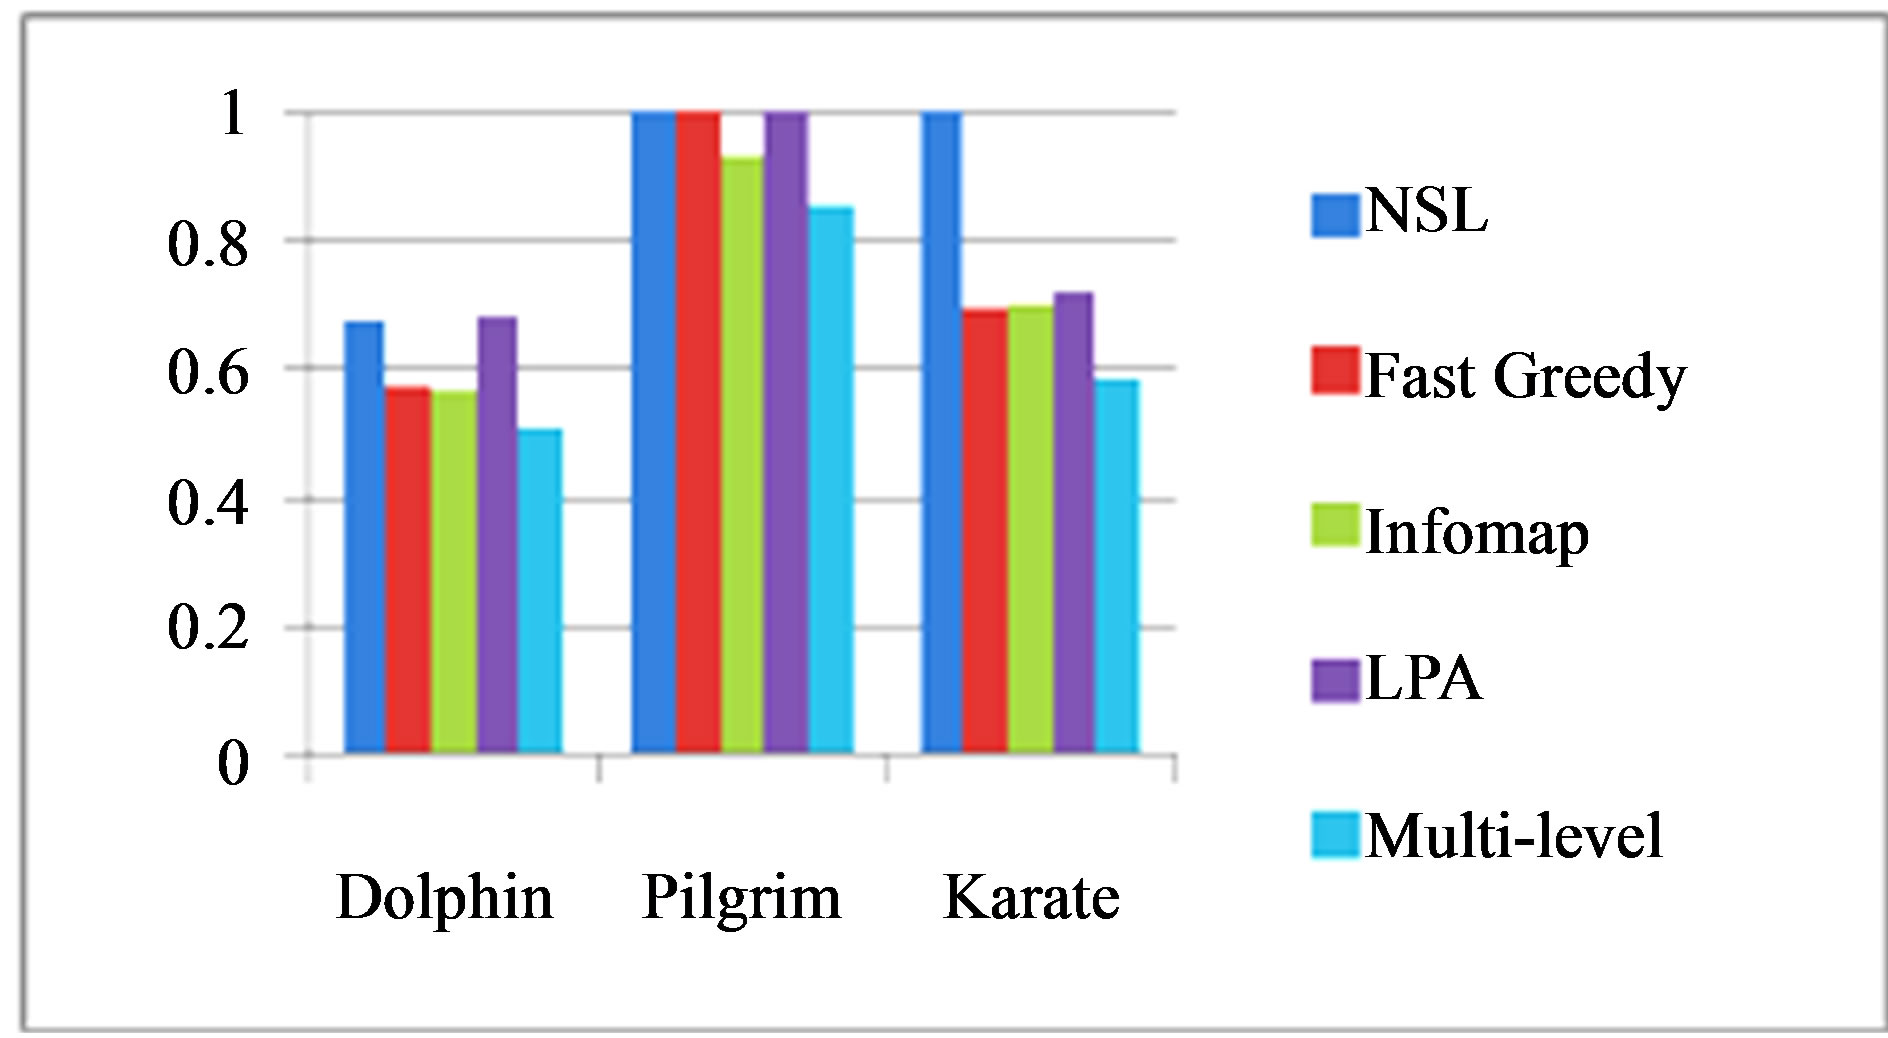
Figure 4. Bar graph of NMI scores with ground truth community partitions for NSL, the fast greedy algorithm, infomap, LPA, and the multi-level algorithm on each of the dolphin, Pilgrim, and karate networks. The alpha parameter for NSL’s optimal result on the dolphin network was 0.4, while Pilgrim and karate both used an alpha of 0.
with a drop in the modularity score, in keeping with the previously observed trend that modularity maximization often deviates from the ground truth communities observed.
The difficulty in determining quality of a partition is that ground truth membership vectors are rare, even for small networks. No comprehensive ground truth vectors exist for large networks, so in general modularity is the only measure of quality of large-network community partitions. Not all algorithms that work well on small networks can be said to have the same kind of performance on large networks. Also, some algorithms are better suited to dense networks, while others are better suited to sparse ones. Without a ground truth basis for observation, it is exceedingly difficult to determine performance on large networks. Table 2 contains modularity scores for four algorithms on the large networks examined. The range of modularity scores on these is much broader than on small networks, as there are many more options for community partitions. Many of these modularity score ranges look similar to those from the jazz network, with NSL receiving lower modularity scores than other algorithms, with few exceptions. There may be some similarities in the structures of these networks that lends to the marked difference between the NSL clustering and optimal modularity clustering. This seems a reasonable hypothesis, as both jazz and the four co-authorship networks are collaboration networks. As was already seen, the communities found by NSL stand up better to visual examination in the case of the jazz network, but the arXiv networks are too large for such an examination to be possible in this format. The Houghton College Twitter network is not a collaboration network, however, and it is still small enough for such an examination to be possible. It also has a great deal of information about the users available, which will be helpful in our analysis.
5.2. Houghton College Twitter Network Community Analysis
An investigation of the general affiliations of the accounts
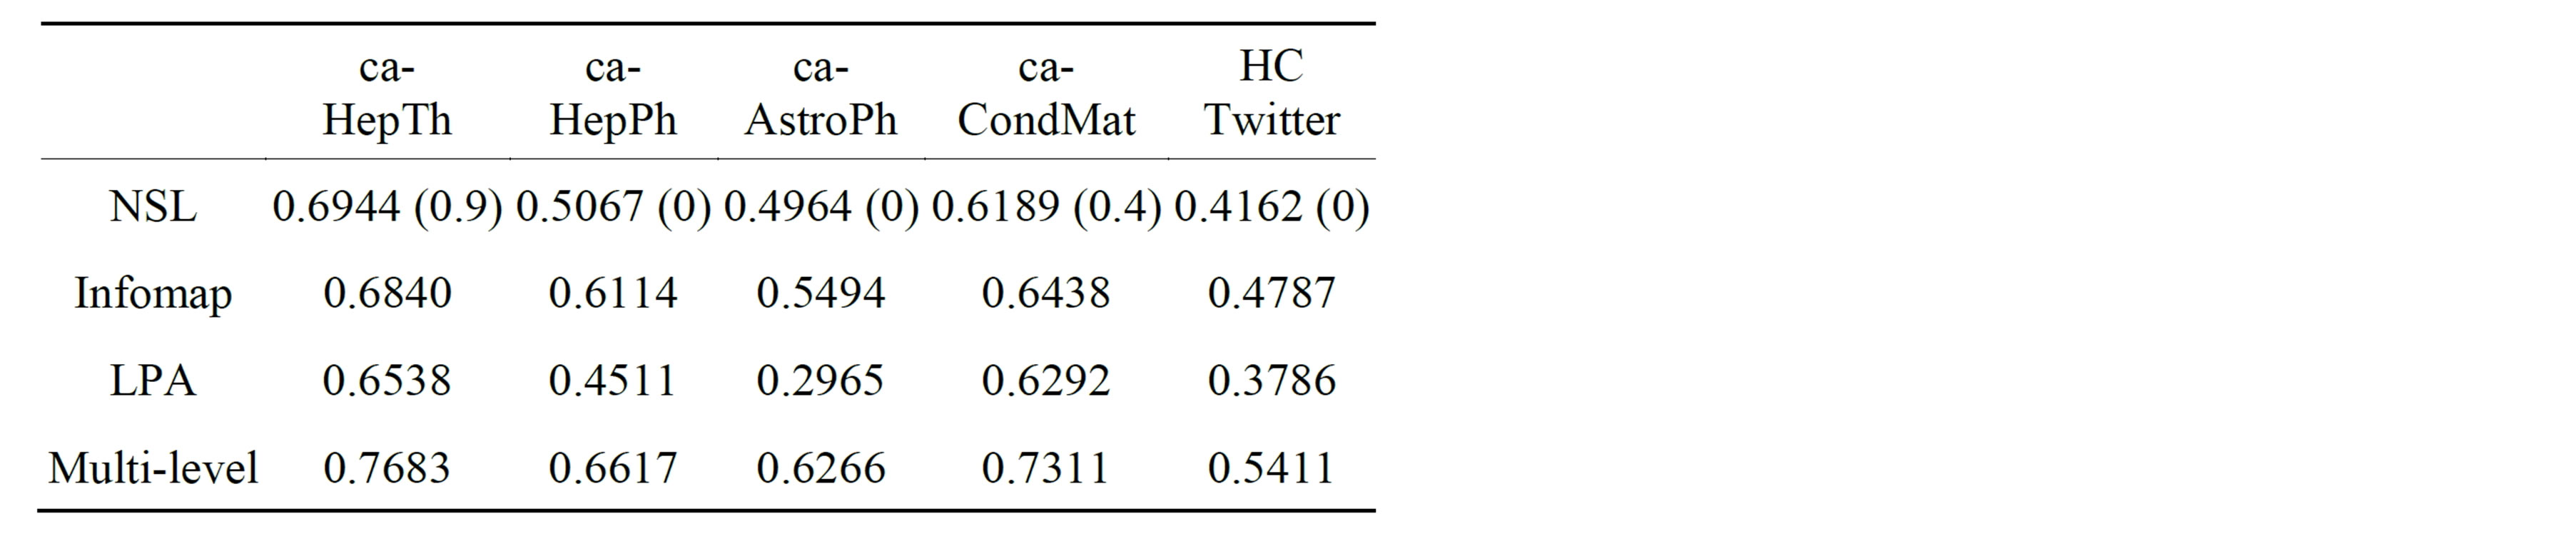
Table 2. Modularity scores on five large networks. Parenthetical numbers indicate the lowest α-value corresponding to the optimal modularity. The fast greedy algorithm’s implementation was unable to run on some of these networks, so its results are omitted from the table.
in the Houghton College Twitter network revealed that 141 accounts belong to students at Houghton College, 139 to alumni, 48 to other users affiliated with Houghton College, and 340 others, such as schools, businesses, churches, and many individuals not affiliated with the college. The remaining 129 accounts lack sufficient identifying information to determine an affiliation. The primary communities according to NSL and the fast greedy community detection algorithm are shown in Figure 5.
The communities produced by the community detection algorithms used were compared using the function
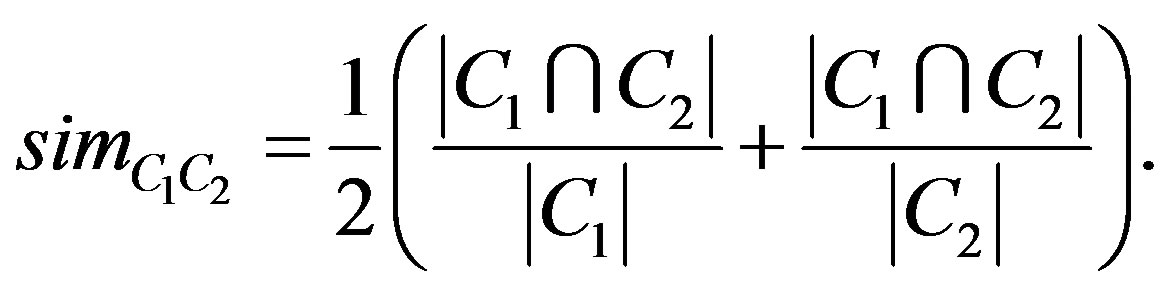 (4)
(4)
The NSL algorithm found three large communities, which contained 390, 179, and 106 members, respectively (communities 1, 2, and 3 in Figure 5). It also found several small communities. It was determined that community 1 according to NSL had a sim-value of 0.8134 with the corresponding community as found by
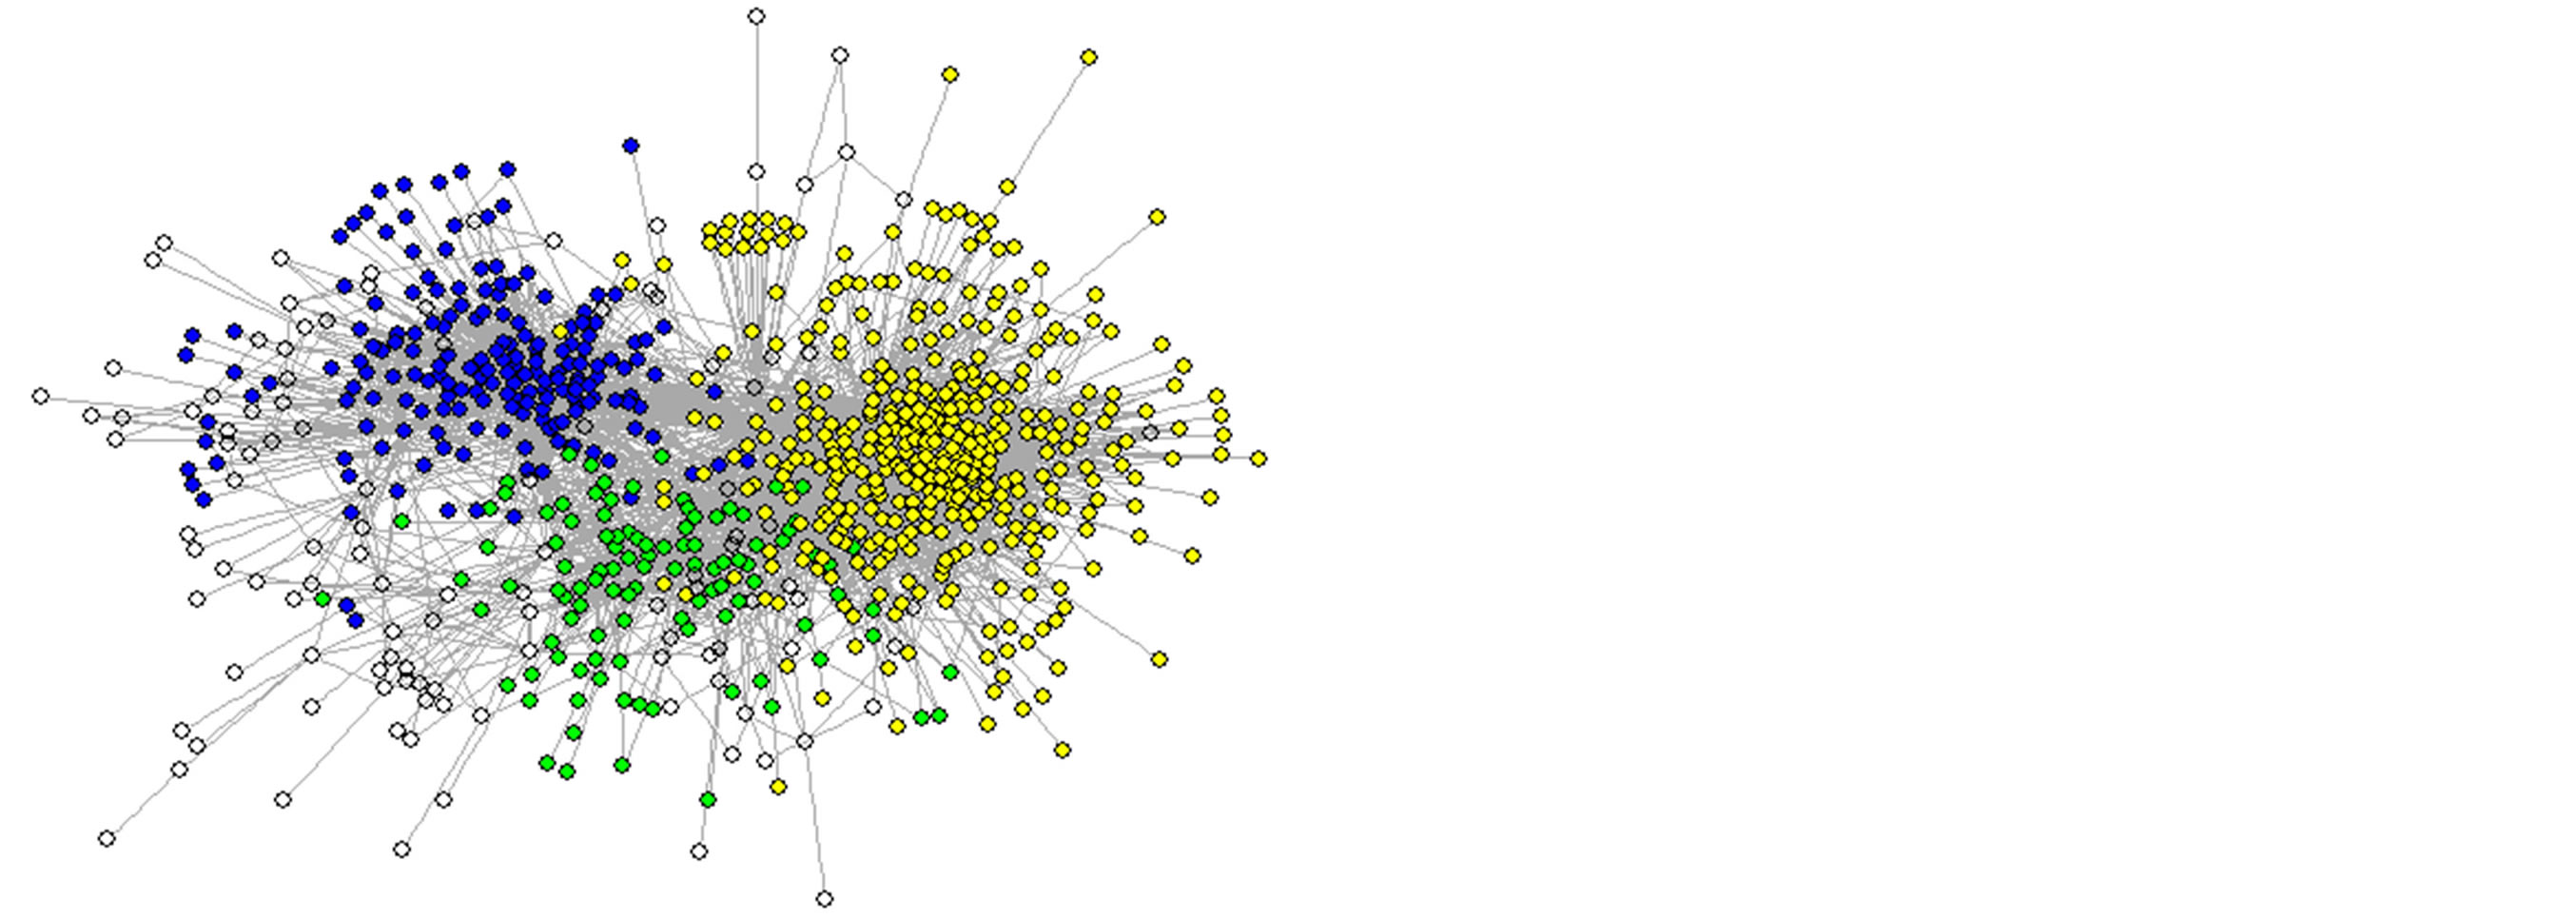
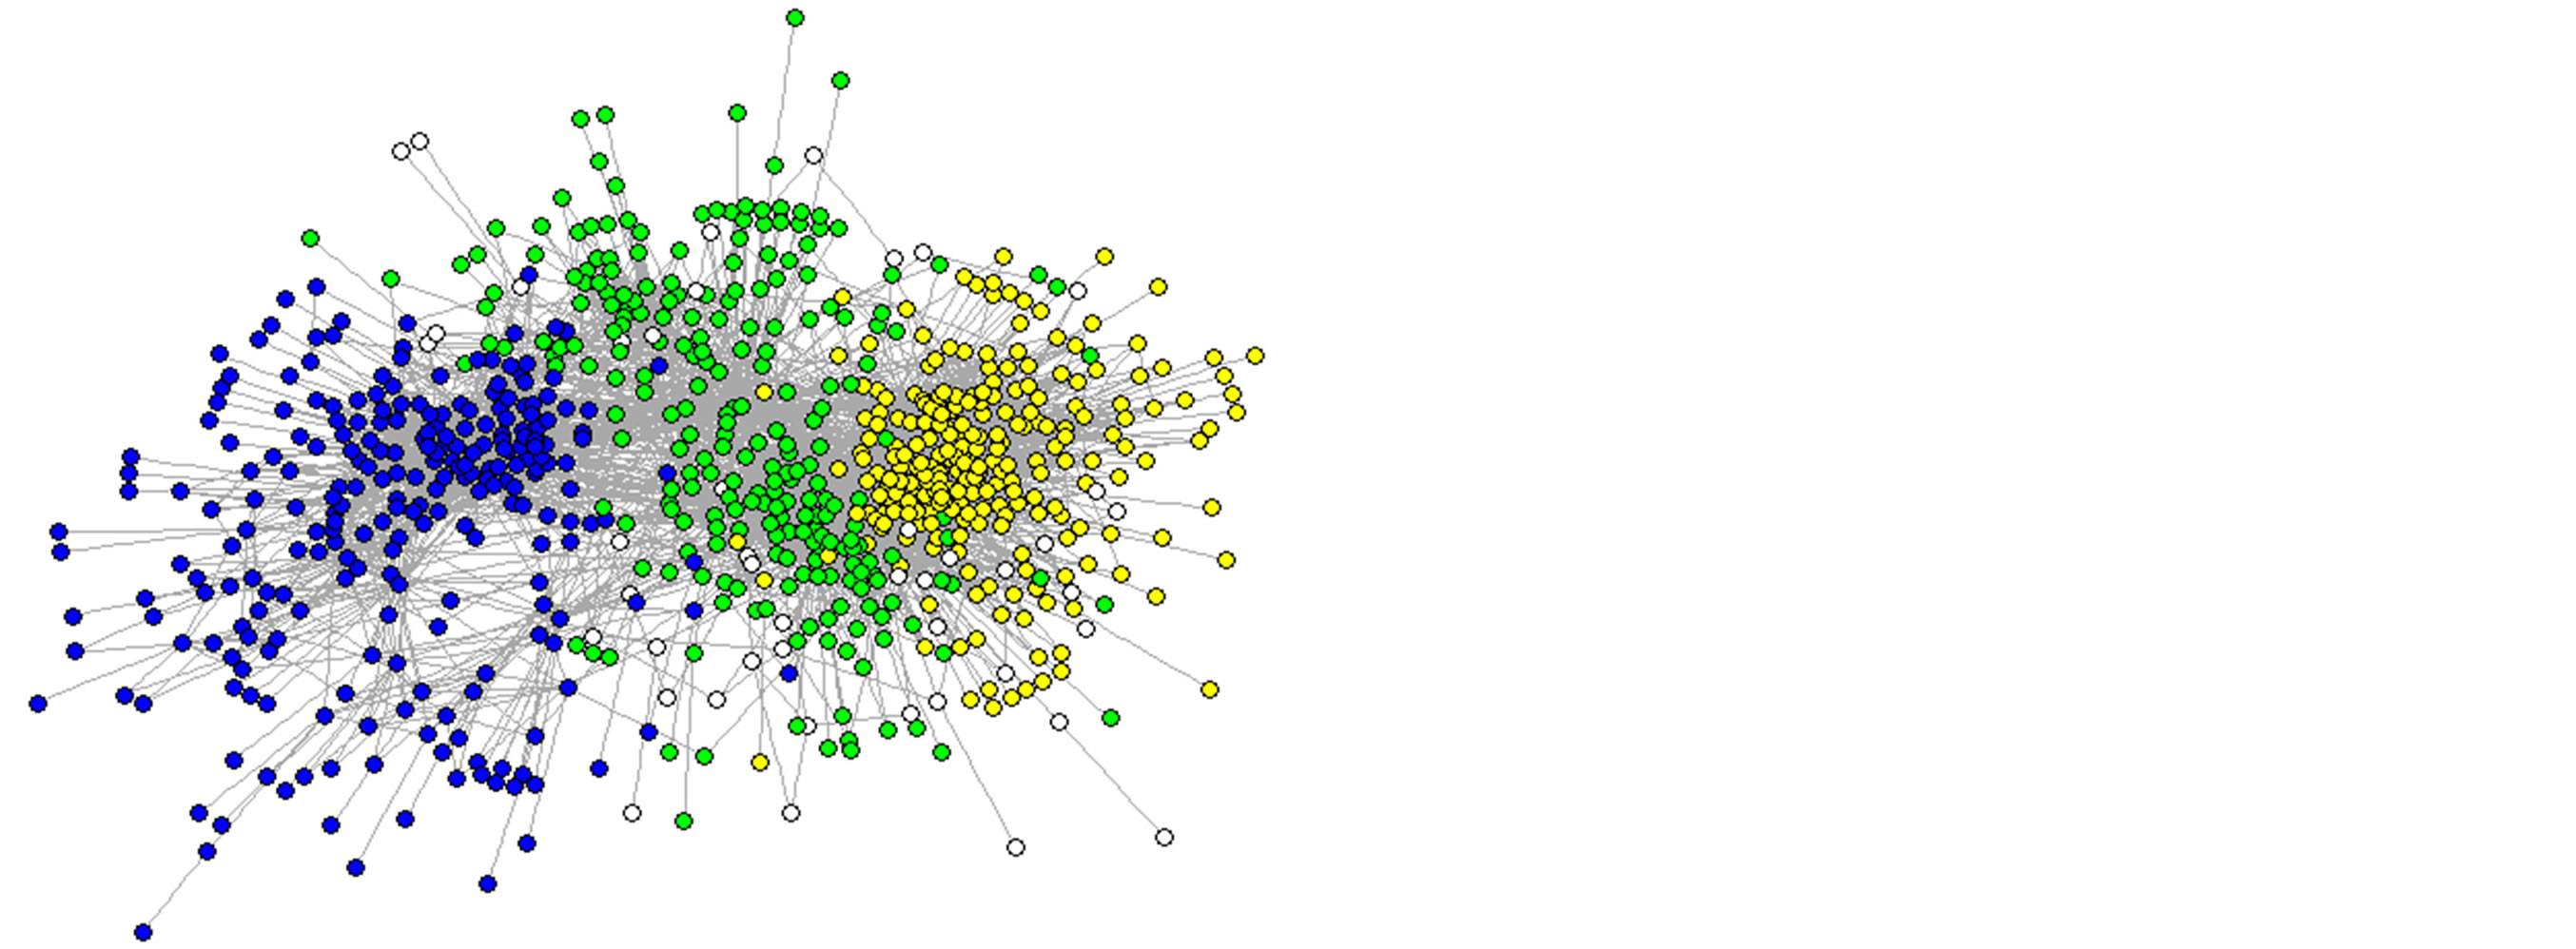
Figure 5. Houghton College Twitter Network with Communities found by NSL (upper) and the fast greedy modularity optimization algorithm (lower). The nodes in yellow form community 1, while nodes in blue and green are in communities 2 and 3, respectively. The white nodes are members of other communities.
the fast greedy algorithm. The fast greedy algorithm also found two other large communities, each with a highsim-value to one of the two other large NSL communities, along with several small communities. The fast greedy algorithm had a modularity score of 0.4945, which is one of the highest modularity scores attained on this network. This coupled with the similarity of the communities found by the two algorithms makes it suitable for a more detailed analysis. Details about the large communities found by both algorithms are shown in Table 3.
The compositions of community 1 are shown in Table 4. From this table it can be seen that the two different boundaries found for the same community are both of high quality. The fast greedy algorithm discovered a tight community of most of the students in the network, with some of their older peers and others. NSL found a slightly broader community which contained nearly all of the students in the network and most of the alumni and other users associated with Houghton College. In Figure 5 we can see that the tightness gained in community 1 according to the fast greedy algorithm is balanced by a loss of tightness in community 3 relative to NSL. The versions of communities 2 and 3 found by NSL are more tightly defined than those of the fast greedy algorithm. In addition, Figures 6 and 7 show the most frequent labels attributed to users in communities 2 and 3, respectively, from the manual labeling process. From these data we see that the communities found by the NSL algorithm on the Houghton College Twitter network are of high quality.
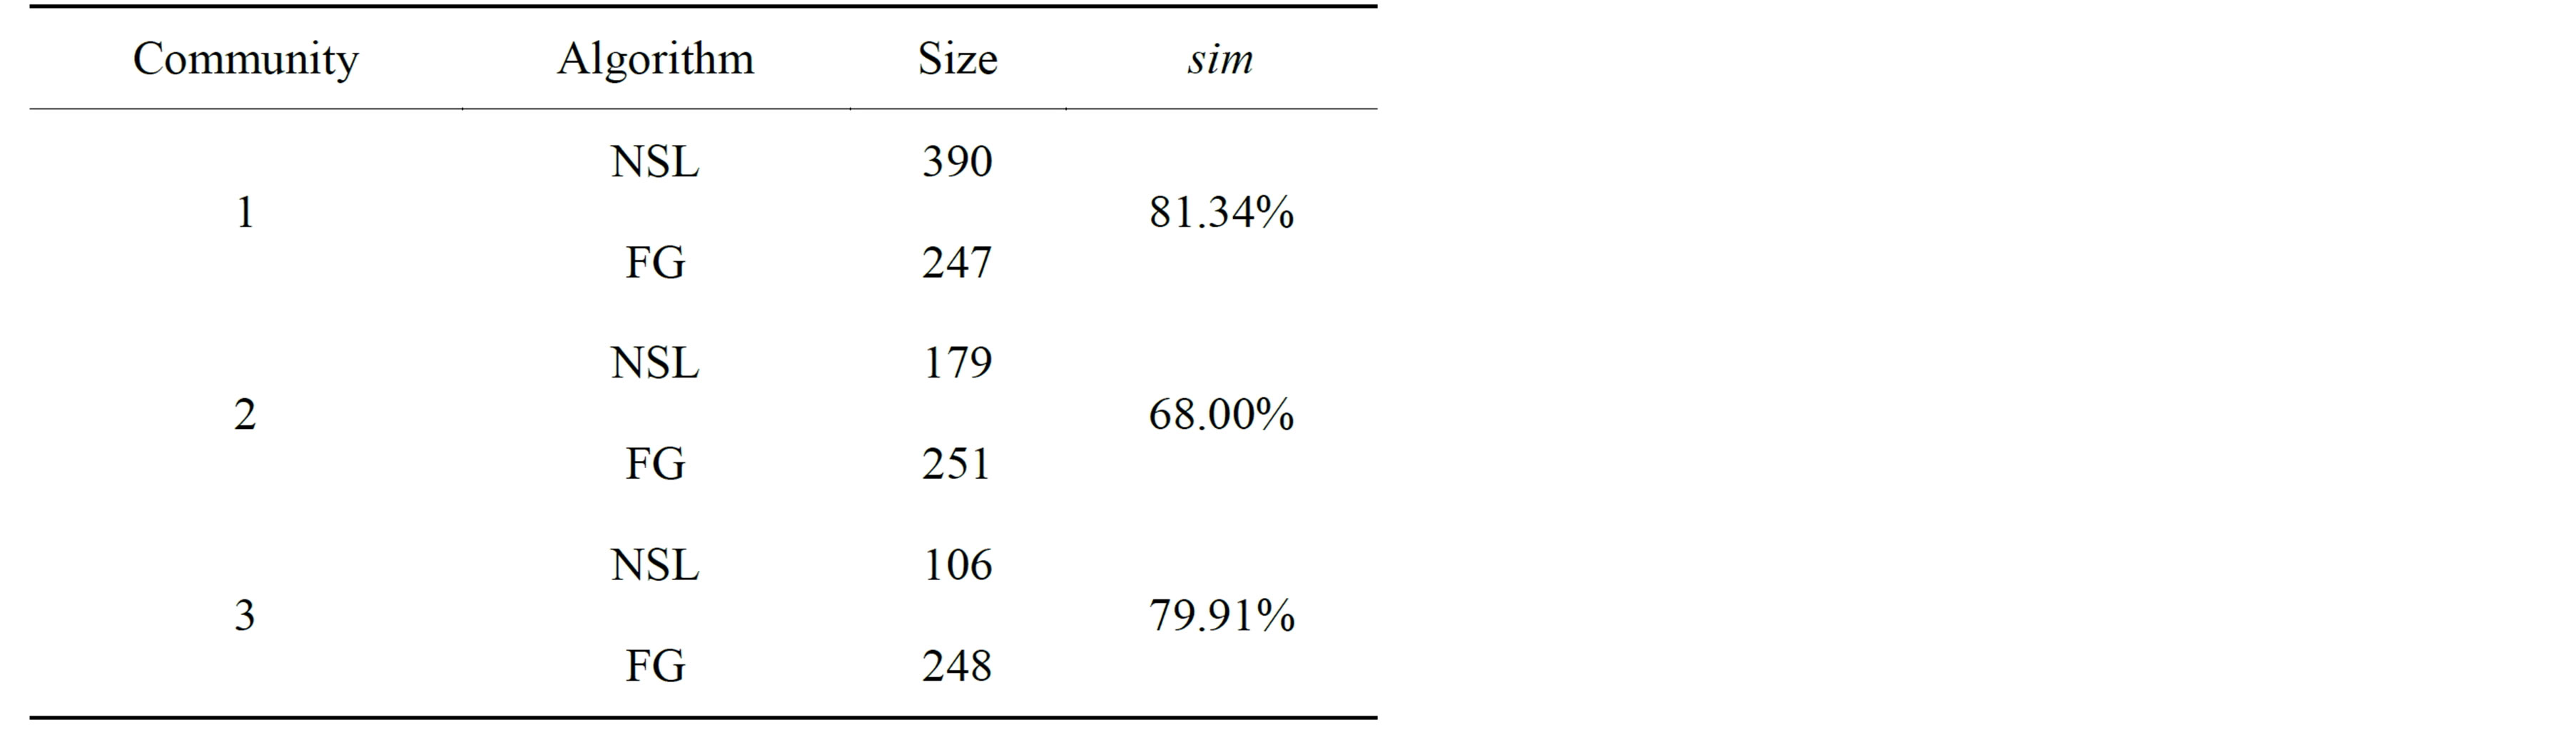
Table 3. Sizes and sim values of communities 1, 2, and 3 of the Houghton College Twitter network found by NSL and the fast greedy algorithm.
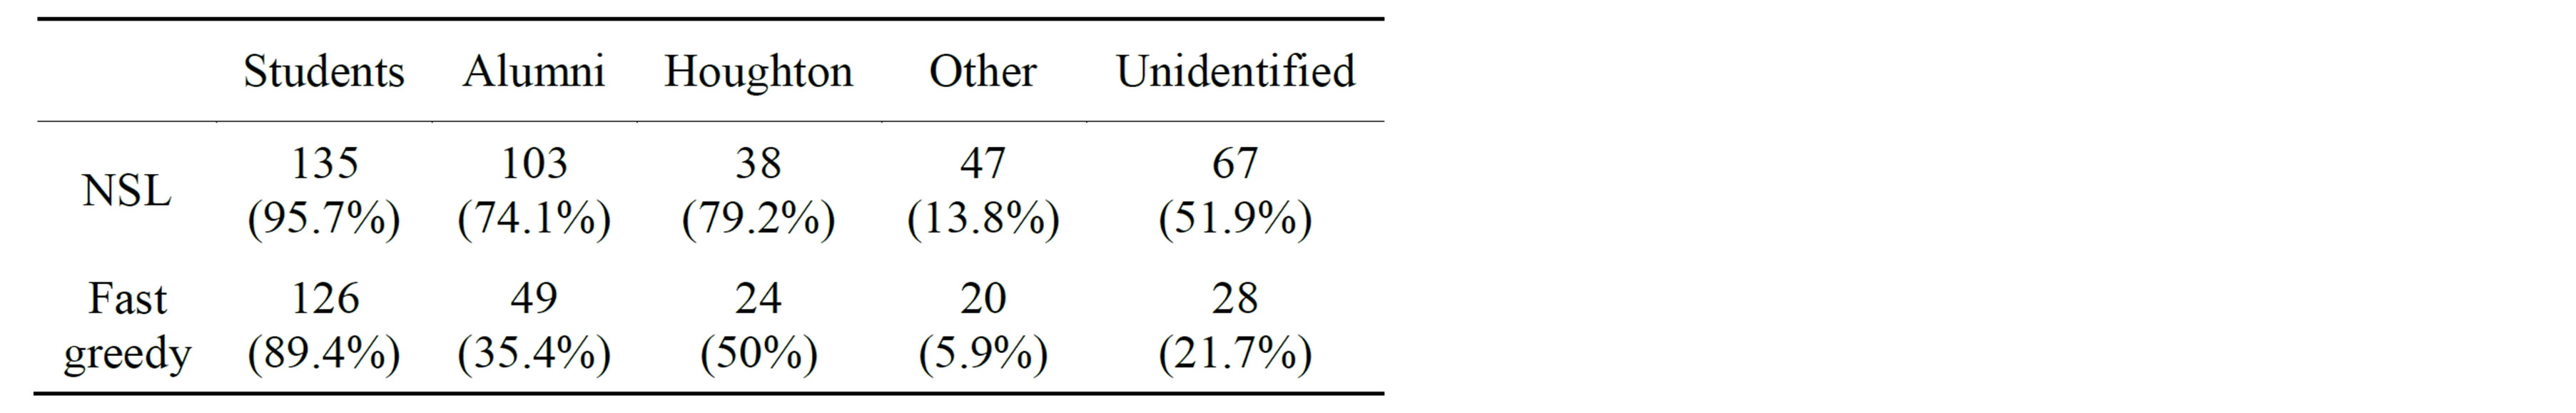
Table 4. Membership distributions of community 1 as found by NSL and the fast greedy algorithm. The denominator of the percentages is the total number of users in the category (e.g. students—NSL identified that 135 of 141 confirmed students in the network belong to one community (95.7%)).

Figure 6. Frequent account labels in community 2 of the Houghton College Twitter network as found by NSL.

Figure 7. Frequent account labels in community 3 of the Houghton College Twitter network as found by NSL.
One way of determining what a community represents is to examine its leader, which is the focus of the NSL algorithm. The leaders of communities 1, 2 and 3 are the accounts @HoughtonProbs, @CCCU_news, and @ JoAnneLyonGS, respectively. The @HoughtonProbs account is one of the many meme accounts found on Twitter, presumably taking inspiration from the “first world problems” meme; it publishes tweets referring to problems or “problems” peculiar to the subculture of Houghton, New York. The account @CCCU_news is operated by The Council for Christian Colleges and Universities, which describes itself as “an international association of intentionally Christian colleges and universities.”2 Houghton College is listed on the CCCU website as a member, along with 117 other colleges and universities.3 The account posts news stories relevant to those institutions. The third major leader in the network, @JoAnneLyonGS, is a prominent member of the Wesleyan denomination of the Protestant church, the official denomination of Houghton College.
These three leaders have high degrees of correlation with their respective communities. The community membership shown in Table 4 is the community led by @HoughtonProbs. Figures 6 and 7 correspond to the respective communities of @CCCU_news and @JoAnneLyonGS. From these figures it is clear that the communities found by the NSL algorithm are naturally aligned with their leaders. This demonstrates the effectiveness of the NSL algorithm; it is able to find meaningful communities across a wide range of networks, and find leaders who are representative of those communities.
6. Conclusion
In this paper, we present a new algorithm, NSL, for determining leaders of a given network and determining community memberships around those leaders. NSL’s results were compared against several other algorithms on the basis of modularity and also NMI scores with the true community memberships of some small networks. The NMI scores demonstrate that NSL is a very promising algorithm for finding realistic leaders and community structures for small networks. An in-depth examination of the Houghton College Twitter network indicates that it shows a promise on larger networks as well. In addition to the efficacy of the algorithm itself, the neighborhood similarity centrality function can be recognized as useful on its own for determining importance of nodes in a network. Further research should be conducted into its use and limitations. Potential expansions of the algorithm include extending it for use on directed networks, which could be done by using a modified similarity function which weights edges to a vertex over edges from it; modifying it for overlapping community detection by altering the clustering step, locally varying the tuning parameter  and testing the effects of applying this parameter inside the neighborhood similarity function.
Acknowledgements
We would like to thank Houghton College for the opportunity to perform this research, and also William Deitrick for his work compiling the Houghton College Twitter network. We would also like to thank Dr. Xumin Liu at RIT for helpful discussions of node importance in social networks.
REFERENCES
- U. N. Raghavan, R. Albert and S. Kumara, “Near Linear Time Algorithm to Detect Community Structures in LargeScale Networks,” Physical Review E, Vol. 76, No. 3, 2007, Article ID: 036106. http://dx.doi.org/10.1103/PhysRevE.76.036106
- J. Xie, B. K. Szymanski and X. Liu, “SLPA: Uncovering Overlapping Communities in Social Networks via A Speaker-Listener Interaction Dynamic Process,” Proceedings of Data Mining Technologies for Computational Collective Intelligence Workshop at ICDM, Vancouver, 11-14 December 2011, pp. 344-349.
- J. Xie and B. K. Szymanski, “LabelRank: A Stabalized Label Propagation Algorithm for Community Detection in Networks,” Proceedings of the IEEE Network Science Workshop, West Point, 29 April-1 May 2013, pp. 138- 143.
- J. Huang, H. Sun, Y. Liu, Q. Song and T. Weninger, “Towards Online Multiresolution Community Detection in Large-Scale Networks,” PLoS ONE, Vol. 6, No. 8, 2011, p. e23829. http://dx.doi.org/10.1371/journal.pone.0023829
- R. Rabbany, J. Chen and O. R. Zaiane, “Top Leaders Community Detection Approach in Information Networks,” Proceedings of the 4th SNA-KDD Workshop on Social Network Mining and Analysis, The ACM SIGKDD Conference on Knowledge Discovery and Data Mining (KDD), Washington DC, 2010.
- W. W. Zachary, “An Information Flow Model for Conflict and Fission in Small Groups,” Journal of Anthropological Research, Vol. 33, No. 4, 1977, pp. 452-473.
- B. Dickinson, B. Valyou and W. Hu, “A Genetic Algorithm for Identifying Overlapping Communities in Social Netowkrs Using an Optimized Search Space,” Social Networking, Vol. 2, No. 4, 2013, pp. 193-201. http://dx.doi.org/10.4236/sn.2013.24019
- D. Lusseau, K. Schneider, O. J. Boisseau, P. Haase, E. Slooten and S. M. Dawson, ”The Bottlenose Dolphin Community of Doubtful Sound Features a Large Proportion of Long-Lasting Associations,” Behavioral Ecology and Sociobiology, Vol. 54, No. 4, 2003, pp. 396-405. http://dx.doi.org/10.1007/s00265-003-0651-y
- P. Gleiser and L. Danon, “Community Structure in Jazz,” Advances in Complex Systems, Vol. 6, No. 4, 2003, pp. 565-573. http://dx.doi.org/10.1142/S0219525903001067
- M. Girvan and M. E. J. Newman, “Community Structure in Social and Biological Networks,” Proceedings of the National Academy of Sciences of the United States of America, Vol. 99, No. 12, 2002, pp. 7821-7826. http://dx.doi.org/10.1073/pnas.122653799
- J. Leskovec, J. Kleinberg and C. Faloutsos. “Graph Evolution: Densification and Shrinking Diameters,” ACM Transactions on Knowledge Discovery from Data, Vol. 1, No. 1, 2007, Article 2.
- X. Liu, Z. Xie and D.-Y. Yi, “Community Detection by Neighborhood Similarity,” Chinese Physics Letters, Vol. 29, No. 4, 2012, Article ID: 048902. http://dx.doi.org/10.1088/0256-307X/29/4/048902
- G. Csardi and T. Nepusz, “The Igraph Software Package for Complex Network Research,” InterJournal, Vol. Complex Systems, 2006. http://igraph.sf.net
- R Core Team, “R: A Language and Environment for Statistical Computing,” R Foundation for Statistical Computing, Vienna, 2013. http://www.R-project.org/
- M. Rosvall and C. T. Bergstrom, “Maps of Information Flow Reveal Community Structure in Complex Networks,” Proceedings of the National Academy of Sciences of the United States of America, Vol. 105, No. 4, 2008, pp. 1118- 1123. http://dx.doi.org/10.1073/pnas.0706851105
- A. Clauset, M. E. J. Newman and C. Moore, “Finding Community Structure in Very Large Networks,” Physical Review E, Vol. 70, No. 6, 2004, Article ID: 066111. http://dx.doi.org/10.1103/PhysRevE.70.066111
NOTES
1http://arxiv.org/
2www.twitter.com/CCCU_news
3www.cccu.org/members_and_affiliates