International Journal of Medical Physics, Clinical Engineering and Radiation Oncology
Vol.05 No.01(2016), Article ID:63479,19 pages
10.4236/ijmpcero.2016.51006
Commissioning of TrueBeamTM Medical Linear Accelerator: Quantitative and Qualitative Dosimetric Analysis and Comparison of Flattening Filter (FF) and Flattening Filter Free (FFF) Beam
Ravindra Shende1*, Gourav Gupta1, Ganesh Patel2, Senthil Kumar1
1Department of Radiation Oncology, Capitol Hospital, Jalandhar, India
2Department of Radiation Oncology, Chirayu Medical College & Hospital, Bhopal, India

Copyright © 2016 by authors and Scientific Research Publishing Inc.
This work is licensed under the Creative Commons Attribution International License (CC BY).
http://creativecommons.org/licenses/by/4.0/


Received 26 November 2015; accepted 14 February 2016; published 17 February 2016
ABSTRACT
Motive of the study is to present quantitative and qualitative analysis and comparison of beam data measurement with FF (flattening filter) and FFF (flattening filter free) beam in a Varian TrueBeamTM Medical Linear Accelerator. Critique of beam characterization and evolution of dosimetric properties for 6 MV, 10 MV, 15 MV FF beam and 6 MVFFF, 10 MVFFF FFF beam has been carried out. We performed the comparison of photon beam data for two standard FF photon energy 6 MV, 10 MV verses 6 MVFFF, and 10 MVFFF FFF beam. Determination and comparison of parameter involved PDD (Percentage depth dose), Depth dose profile, Symmetry, Flatness, Quality index, Relative output factor, Penumbra, Transmission factor, DLG (Dosimetric leaf gap), in addition to degree of Un-flatness and off-axis ratio of FFF beam. Outcomes of presenting study had shown that change of various parameters such as Percentage depth dose curves, Shape of the depth dose pro- file, Transmission, Value of quality index and significant rise in surface dose for FFF in comparison with FF beam. Differences in the output factor at lower and higher field sizes for FFF beam com- pared to that of FF beam were found. The maximum output factor deviation between 6 MV and 6 MVFFF was found to be 4.55%, whereas in 10 MV and 10 MVFFF was 5.71%. Beam quality TPR20/10 for FFF beam was found to be lesser in magnitude, 5.42% for 6 MVFFF whereas 4.50% for 10 MVFFF compared to 6 MV and 10 MV FF beam respectively. Jaw transmission and interleaf leakage for FFF beam were found to be lesser than FF beam. Also DLG for FFF beam was found to be lesser in magnitude comparable to that of flattened beam. This study is mainly inclined towards evaluation and comparison of the FF and FFF beam. It has been observed that, the outcome of a commissioning beam data generation fully complies with vendor specification and published literature.
Keywords:
True Beam Medical Linear Accelerator, Commissioning, Photon Beam Data, Flattening Filter, Flattening Filter Free

1. Introduction
Installation and commissioning of the Varian TrueBeamTM millennium 120 leaf Medical Linear Accelerator were carried out in Super Specialty Capitol Hospital, Jalandhar Punjab (India). Usually Varian offers the TrueBeamTM machine in two different versions, one is with millennium 120 leaf MLC (Multi Leaf Collimator) for general purpose and the other is TrueBeamSTX with HD (High definition) 120 leaf MLC having a special purpose for stereotactic radiotherapy, which has at central (8 cm, leaf width projected at isocenter) 32 leaf pairs of MLC having 2.5 mm leaf thickness and outer (14 cm, leaf width projected at isocenter) 28 leaf pairs of MLC having 5 mm leaf thickness to achieve high precise target conformation and minimize the penumbra effect. Both TrueBeamTM machines have a feature with FF (Flattening Filter) and FFF (Flattening Filter Free) mode along with electron energy. Figure 1(a) shows the schematic representation of key component and beam generating system of Varian TrueBeamTM Linear Accelerator. True beam system generates the beam by activating an electron gun, bunching the released electrons, accelerating them through the wave guide and then steering them through a 270˚ achromatic bend magnet. 3 mm width of incident electron beam strike target and continuous deceleration of electron inside target generates X-ray radiation. True beam system utilizes the triode gun design which is capable of high speed electron source. Buncher coil helps properly center the electron beam and form electron bunching. Accelerator large solenoid focusing coil along the length of tube maintain electron bunching focus and narrow energy spectrum at output of the guide. Position steering and angle steering coil is used to angle the beam at the end of guide tube and inside bending magnet respectively. Multiple target system with target material is optimized for different energy range. Flattening filter is placed on carrousel just below the target assembly to achieve beam uniformity. Output of beam continuously monitor by ion chamber placed below the flattening filter. The beam is continuously steered by feed-back servo control system that responds to ionization chamber monitoring of beam position, angle, symmetry, flatness, beam output. At the end, collimator assembly consists of independent X and Y jaw along with MLC to define the field geometry. Figure 1(b) shows the front view of Varian TrueBeamTM Medical Linear accelerator.
Head of True Beam design is slightly different from traditional one. For example carrousel system has been modified to excess the use of several photon energy as well as electron energy; field light is associated with movement of the carrousel. Highly equipped TrueBeamTM linear accelerator has capabilities with on-board imaging (KV, MV, CBCT), flat conventional beam along with FFF beam delivery.
Traditionally, Radiotherapy has been practicing with a flat beam profile to ease of dose computation and treatment planning. Since, technology has evolved and successful implementation IMRT (Intensity Modulated Radiation Therapy), SBRT (Stereotactic Body radiation Therapy), Rapid Arc (with static and dynamic MLC) delivery technique came into the practice. Over the span of time significance of flat beam to deliver the IMRT has become insignificant. As long as the beam profile is stable and reproducible over the period of time, the FFF beam can be introduced. There are many publications dealing with the topic of FFF including Monte Carlo beam modeling. Having FFF treatment delivery is the pride of the institution. Although, many centers throughout the world, having facility with FFF beam, but still used of FFF beam is under hesitation and not fully implemented all around the world. However, the use of FFF is newly adopted in radiotherapy. We have performed a comprehensive evaluation of 6 MVFFF and 10 MVFFF beam energy. Principally, FFF beam offers maximum high dose rate of 1400 MU/Mit and 2400 MU/Mit for 6 MVFFF and 10 MVFFF beam respectively.
Removal of flattening filter alters the physics around flattening beam. Significant increases in dose rate, causes softening of beam spectrum and reduction in scatter radiation as well as a decrease in neutron and photon leakage from the head.
 (a)
(a)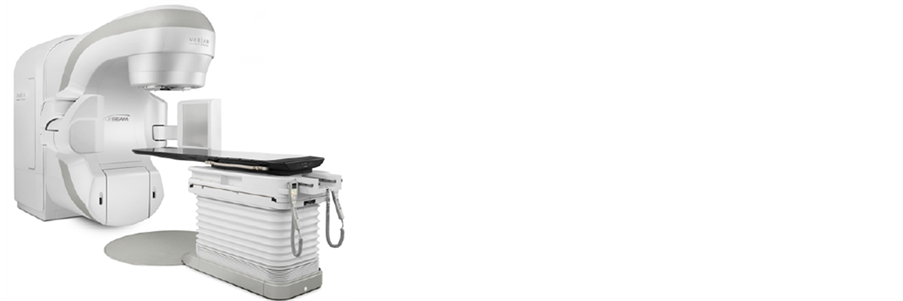 (b)
(b)
Figure 1. (a) Schematic representation of Varian TrueBeamTM Medical Linear Accelerator system; (b) Front view of Varian TrueBeamTM Medical Linear Accelerator.
2. Method & Material
Commissioning of TrueBeamTM Linear Accelerator is performed with the help of the IBA dosimetry system in water phantom (RFA-Blue Phantom, with Omni-Pro Accept-7 software). All data collection and testing were performed in accordance with the international practice and guidelines such as AAPM Task Group TG-142 and TG-106. FFF beam data collection and evolution carried out as per AERB (Atomic energy regulatory board, INDIA). A procedure such as MLC DLG (Dosimetric Leaf Gap) is carried out according to Varian specified guidelines. The chamber used for beam data collection and dosimetric measurements are CC013, PPC05, and FC56-G. The beam data measurement is done as per recommendation of AAA (Anisotropic Analytical Algo- rithm) for photon beam and EMC (Electron Monte Carlo) for electron beam in order to commissioning the Ec- lipse (Version: 13.5) TPS (Treatment Planning System). Beam data measurement ware performed for standard photon energies 6 MV, 10 MV, 15 MV flattening filter beam and 6 MVFFF, 10 MVFFF flattening filter free beam.
2.1. Comparison of Commissioning Parameter
Percentage depth dose and depth dose profile were measured at 100 cm SSD; with CC013 ion chamber.
2.1.1. Percentage Depth Dose (PDD)
PDDs were measured for various field sizes ranging from 3 × 3 cm2 to 40 × 40 cm2. Various parameters such as Dmax, PDD at 5 cm, 10 cm and 20 cm for FF and FFF beam were compared for selective field sizes (5 × 5, 10 × 10, 20 × 20 and 40 × 40) cm2. Although dose per pulse is same for varying dose rate, measurement is performed with a constant dose rate of 300 MU/Mit. Chamber correction for Effective point of measurement (0.6 *rcav) [1] is taken into account in a software setting itself. All percentage depth doses were smoothened by least-square algorithm. After that PDDs were normalizing at a depth of maximum to 100%. Point by point comparisons of the depth dose curve is performed up to a measurement scanning depth of 35 cm.
2.1.2. Open Field Depth Dose Profile
In-line, cross-line and diagonal beam profiles were measured for all available beam energies for various recom- mended field sizes at Dmax, 5 cm, 10 cm, 20 cm, 30 cm depth. Beam profile data were first smoothened by me- dian filter and then corrected for the central axis discrepancy. After that beam profiles ware normalize to 100% at the central axis to their corresponding field size. Analysis of beam profile of the flattening filter (FF) beam carried out through the AAPM TG-45 (IEC 60976) protocol [2] . According to AAPM TG-45 protocol Flatness can be specified as a maximum permissible percentage variation from the average dose across the central 80% of the full width at half maximum (FWHM) of the profile in a plane transverse to the beam axis. That is, the flatness F is given by:
 (1)
(1)
where, Dmax and Dmin are the maximum and minimum dose values in the central 80% of the dose profile, usually specified at a depth of Dmax cm or 10 cm. For FFF beam, 80% of the beam width misleading number and should not be applied to FFF beam. AERB (Atomic Energy Regulatory Board, India) has released TG as an acceptance test report for commissioning of the FFF beam to evaluate the various parameters such as field size, flatness, symmetry and penumbra. FFF beam analysis done as per their recommendation [3] . Consistent performance and stability of FFF beam profile is indicated by a lateral width of 90%, 75% and 60% isodose [3] .
2.1.3. Symmetry
Symmetry evaluations for both FF and FFF beam were done as per recommendation of International Electro technical Commission (IEC 60976, 2008) [2] .
2.1.4. Field Size
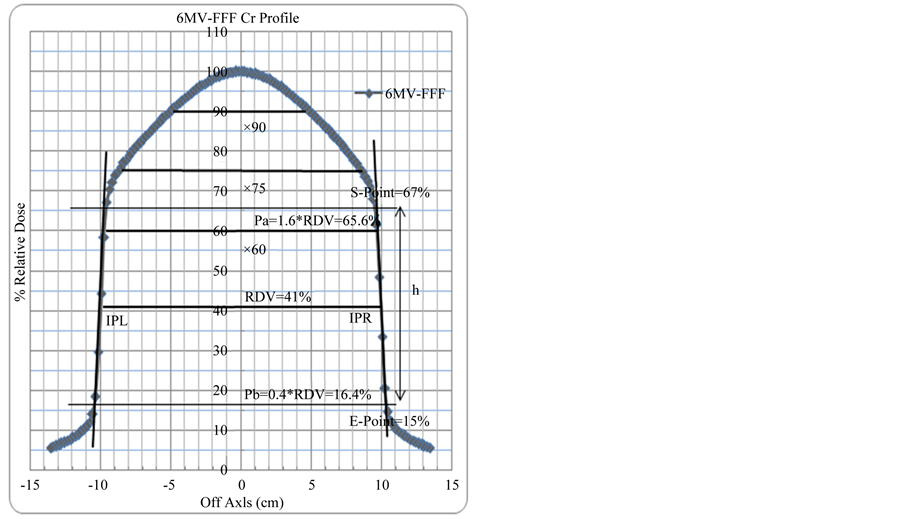
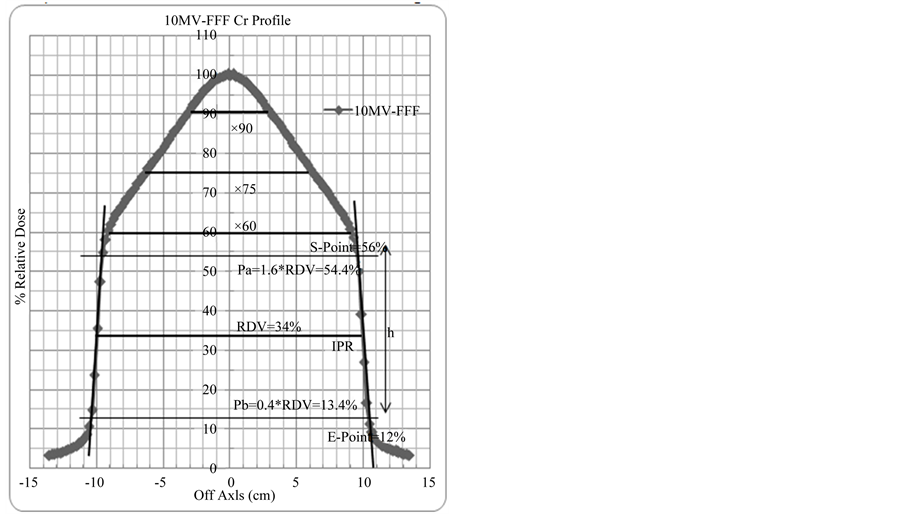
Usually, the field size of flat beam defined as the distance between 50% of the isodose level in profile, norma- lized to 100 at beam central axis at reference depth [4] . Same definition cannot be applied to FFF beam. In order to determine the field size for FFF beam, the AERB Task Group recommended the procedure as follows [3] . Field size shall be defined by collimator settings only. For verifying the constancy of the beam profiles along major axes (In-Plane and Cross-Plane), the separation between inflection points (IPs) been recorded. Inflection point was identified as per its mathematical definition. However, for practical purposes, it is approximated as the mid-point on either side of the high gradient region (sharply descending part) of the beam profile. Its location was identified as follows Figures 2(a)-(d) locate starting point (S) and end point (E) on high gradient region of the beam profile. The vertical separation between S and E gives rise to the height (h) on the high gradient region of the beam profile. The Inflection point is located in h/2 on both sides of the beam profile. Separation between inflection points is defined as the geometrical field size for the FFF beam [3] . Field size for both FF and FFF beam is illustrated.
2.1.5. Degree of Un-Flatness
This was measured as per the recommended protocol in AERB Task Group; quantification of FFF beam is car- ried out based on lateral separation of the dose profile at 90%, 75%, and 60% from the central axis [3] . This value is recorded for all FFF beams.
2.1.6. Penumbra
Penumbra for flat beam defined as the lateral separation of (20% - 80%) isodose on either side of beam profile normalized to 100% at the central axis. But for FFF beam different formalism recommended by the AERB Task

 (a) (b)
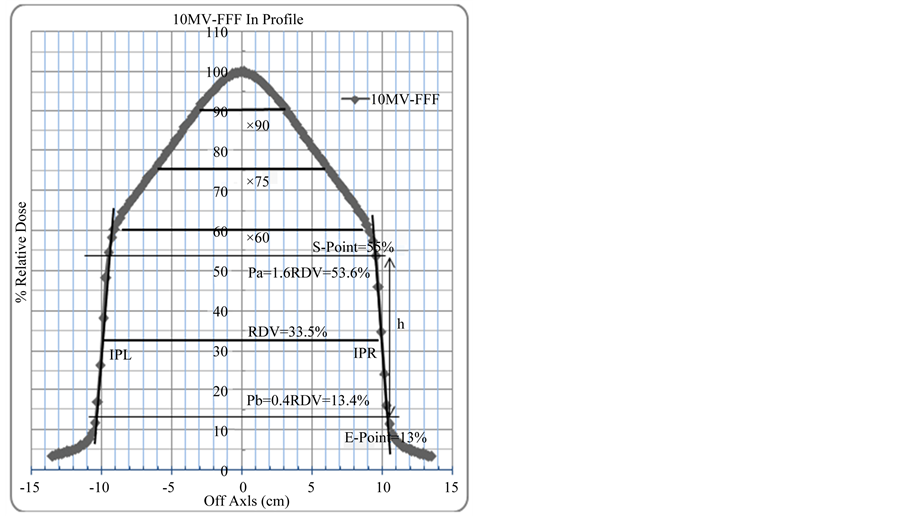
 (c) (d)
Figure 2. (a) In-line depth dose profile of 6 MVFFF beam to analyses FFF beam parameter at SSD = 90 cm, d = 10 cm and field size 20 × 20 cm2; (b) Cross-line depth dose profile of 6 MVFFF beam to analyses FFF beam parameter at SSD = 90 cm, d = 10 cm and field size 20 × 20 cm2; (c) In-line depth dose profile of 10 MVFFF beam to analyses FFF beam parameter at SSD = 90 cm, d = 10 cm and field size 20 × 20 cm2; (d) Cross-line depth dose profile of 10 MVFFF beam to analyses FFF beam parameter at SSD = 90 cm, d = 10 cm and field size 20 × 20 cm2.
Group, for determining radiation beam penumbra, dose value of IP is taken as reference dose value (RDV). Points Pa and Pb are located at 1.6 and 0.4 times of RDV, respectively [3] . Determined points shown on the pro- file, as shown in Figures 2(a)-(d). Lateral separation between Pa and Pb on either side of the profile is consi- dered as a measure of the radiation beam penumbra. The penumbras along major axes are indicated for all the available FFF photon beam energies.
2.1.7. Surface Dose
Surface dose is measured with both CC013 and PPC05 chamber for flattening filter and FFF beam for various field sizes 5 × 5, 10 × 20, 20 × 20, 30 × 30. Estimated surface dose compared between the flattening filter 6 MV, 10 MV and flattening filters free 6 MVFFF, 10 MVFFF beam.
2.1.8. Relative Output Factor
Output factor (Scp) comprises of both collimator (Sc) & phantom scatter factor (Sp). Collimator scatter consists of photons scattered mainly from the collimator, but also possibly from the air and the flattening filter of a Linac. Collimator scatter factor is a function of beam quality and field size, which increases with increasing field size. It is defined as the ratio of output in air for given field to the reference field size. Usually the reference field size is taken as 10 × 10 cm2 [5] . Measurements were performed in the air at SAD 100 cm with sufficient buildup cap to provide charge particle equilibrium. Whereas phantom scatter factor, is defined as the ratio of output for the given field to reference field size at reference depth in water phantom under maximum scatter condition [5] . We measure total phantom scatter factor as a part of commissioning the Treatment planning system (TPS). Measure- ments were performed in water phantom with SAD 100 cm at a depth of 10 cm [1] . Phantom scatter factor was measured for various symmetric and asymmetric field sizes ranging from 3 × 3 cm2 to 40 × 40 cm2 for both FF 6 MV, 10 MV and FFF 6 MVFFF, 10 MVFFF beam. Total phantom scatter factor was normalized at 10 × 10 cm2 for all measured field sizes.
2.2. Measurement of Dosimetric Parameter
Parameter measured for daily QA verification and TPS required data, such as, Beam Quality, Off-Axis ratio, Jaw transmission measured with FC65-G ion chamber and Interleaf leakage, Dosimetric leaf gap (DLG) were measured with small volume CC013 ion chamber. All measurements were carried out with an IBA Dose-1 elec- trometer.
2.2.1. Beam Quality
According to TRS-398 TPR20/10 is defined as beam quality index. TPR20/10 value is determined from empirical formula TPR20/10 = 1.2661 × PDD20,10 − 0.0595. Where, PDD20,10 is ratio of PDD at 10 cm & 20 cm [6] depth. TPR20/10 is also measured directly in D20,10 phantom in isocentric setup for 10 × 10 field in depth of 10 cm and 20 cm. Value is measured for all available photon beam energy & compared with values obtained from empirical formula.
2.2.2. Off Axis Ratio (OAR)-Measurement
The OAR was measured for FF and FFF beam at central axis & ±3 cm to 10 cm × 10 cm collimator setting, in RFA iso-centrically [3] . This is also measured in D20,10 Phantom to generate the data for daily QA verification. OAR has dosimetric significance for FFF beam over flat beam profile.
2.2.3. Percentage Jaw Transmission
Percentage of jaw transmission measured in Acrylic water equivalent RW3-30 × 30 cm3 slab phantoms for SCD = 100 cm at depth of Dmax for their corresponding beam energy [1] . Transmission were Measured for all (Uppers X1, X2, and Lowers Y1, Y2) jaws. Meter reading was taken for each of fully closed jaws. Normalization was performed with respect to 10 × 10 cm2 open fields.
2.2.4. Interleaf Leakage
Leakage measurement is carried out off central 10 cm in SCD 100 cm at a depth of 5 cm in water phantom (RFA). Interleaf leakage measurements were performed separately for both banks [7] . Small volume ion cham- ber CC013 exactly placed between the two leaves. Projection of the leaf is properly verified and Meter readings are taken 10 cm off-axis with fully closed MLC. An increment of 1 cm taken in order to place the chamber ex- actly between the two leafs and chamber moved to next consecutive position with the help of Omni-Pro software. The same procedure is followed for intra leaf transmission except the chamber is placed in center of leaf. Nor- malization performed to field size of MLC 10 × 10 cm2 open fields. Measurement carried out with dose rate of 600 MU/Mit for FF beam and 800 MU/Mit for FFF and meter reading were collected for 200 MU.
2.2.5. Dosimetric Leaf Gap (DLG)
Dosimetric leaf gap is property of round shaped MLC leafs. Varian linear accelerator has round shaped MLC leaves. Transmission through an end portion of the leaf causes a difference in an actual physical optical and rad- iation field defined by MLC [8] . DLG has relevance in IMRT and Rapid-Arc planning where large numbers of MU are delivered through multiple MLC shaped. In order to compensate for transmission through the end of leaf, it’s important to incorporate DLG value in TPS. DLGs were measured in SAD setup at a depth of 5 cm deeper than the depth of electron contamination. DLGs were measured as per the Varian procedure [9] . Varian provided XML dicom files consist of plan of programmed sliding MLC field gaps of (2 mm, 4 mm, 6 mm, 10 mm, 14 mm, 16 mm and 20 mm). The Gap moves from −60 mm to + 60 mm with constant speed with respect to MU. The leaves position is defined every 10 mm by a control point. The resulting fluence is uniform within the field size of 10 × 10 cm2. Average transmission for both the bank (RT) and meter reading for each moving gap size (Rg) is measured. Contribution of average MLC leaf transmission to the gap (RgT) is calculated from given formula [9] :
 (2)
(2)
where,
RgT = Average MLC transmission corresponds to gap g.
RT = (RT, A + RT, B)/2.
RT = Average transmission.
RT, A = MLC transmission for bank A.
RT, A = MLC transmission for bank B.
g = MLC gap size.
Corrected gap reading was calculated from each gap. Corrected gap is defined as the
 (3)
(3)
where,
 = Corrected gap reading correspond to gap g.
Rg = Meter reading with gap size g.
Graph was drawn between gap size g verses  and fit a linear function given by

Point given by gap size g and corrected gap reading . Downward extrapolation of the line intersects at x-axis, the value at the point of intersection defined as leaf gap. Leaf gap measurement is performed for all available photon energy.
where,
a = Slope of equation.
b = Point of intersection on x-axis which corresponds to dosimetric leaf gap g.
3. Result
3.1. Comparison of Commissioning Parameter
3.1.1. Percentage Depth Dose
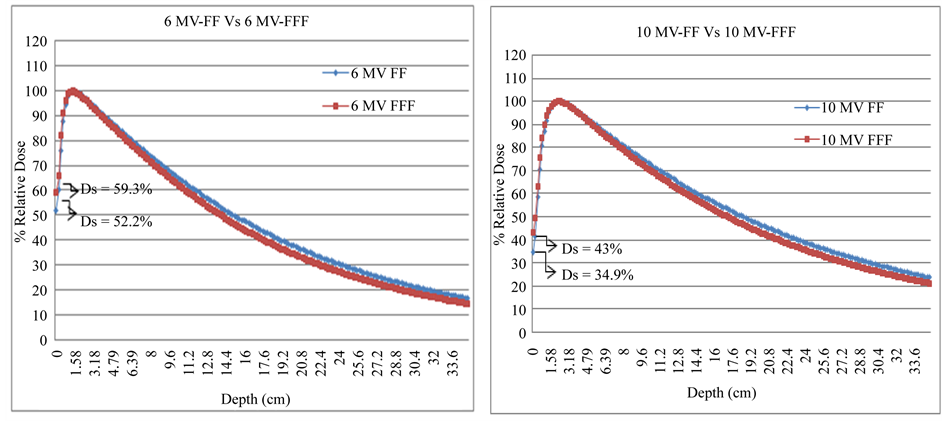
Softening of beam spectra and loss of beam hardening effect yield reduction in PDD at 10 cm for 6 MVFFF and 10 MVFFF FFF beam from their corresponding 6 MV and 10 MV FF beam were 4.35% and 5.30% observed respectively. No any significant changes are observed in the value of Dmax over the range of field size for 6 MV, 10MV FF and 6 MVFFF, 10 MVFFF FFF beam. Evaluated data were fully compliance with the various pub- lished literature [10] [11] . Measured compared depth dose curve for both FF and FFF beam energies shown in Figure 3(a) and Figure 3(b). Removal of flattening also causes a significant rise in surface dose for FFF beam
 (a) (b)
Figure 3. (a) Comparison of percentage depth dose curve for 6 MV FF beam verses 6 MVFFF beam; (b) Comparison of per- centage depth dose curve for 10 MV FF beam verses 10 MVFFF beam.
compared to that FF beam. Increase in a surface dose of 7.1% (with CC013), 9% (with PPC05) for 6 MVFFF and 8.1% (with CC013), 10.6% (with PPC05) for 10 MVFFF beam were observed compared to that of flattened beam. Measured depth dose parameter and surface dose for selective field sizes are shown in Table 1 and Table 2 respectively. Variation of surface dose with beam energies of FF and FFF beam are shown in Figure 4.
3.1.2. Open Field Depth Dose Profile
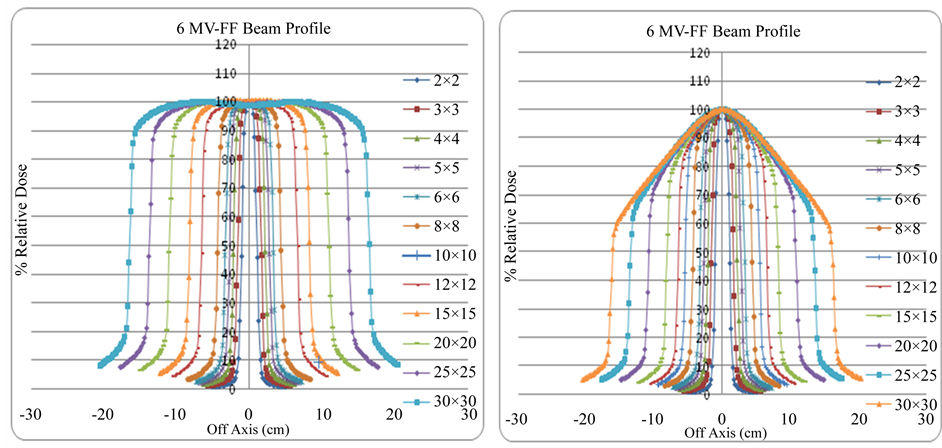
Flatness and Symmetry values for FF beam and FFF beam are shown in Table 2. These differences between FF and FFF beams can again be explained by the off-axis softening effect in FFF beams. Reduction in off axis ratio of 5% and 9% for 6 MVFFF and 10 MVFFF was observed in comparison of flat beam in both cross-line and in-line beam profile at ±3 cm respectively. Figure 5(a), Figure 5(b) and Figure 6(a), Figure 6(b) shows FF and FFF beam profile for 6 MV and 10 MV respectively.
Penumbra and field size for FFF beam requires special consideration. We followed AERB TG recommenda- tion for estimation of field size and penumbra [3] . Procedure for determining penumbra and field size is ex- plained in method and material section. Lateral separation between left and right inflection point provide geo- metric field size. Estimated field size found to be slightly less in magnitude. Maximum deviation found to be 1mm in planed collimator opening and estimated. Average penumbras for FFF beam were observed to be slightly less than that of a FF beam [12] . Measured and evaluated parameter such as field size, penumbra, off- axis ratio and lateral width of FFF beam as degree of Un-flatness are given in Table 3. Similarly measured val- ues of penumbra for FF beam are shown in Table 2.
3.1.3. Relative Output Factor
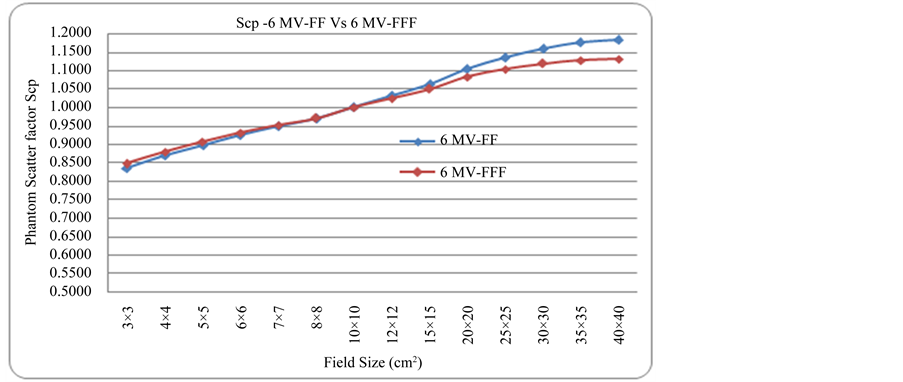
Total scatter factor for FF (6 MV, 10 MV) and FFF (6 MVFFF, 10 MVFFF) were measured. Measurements were carried out for field size ranging from 3 × 3 cm2 to the 40 × 40 cm2. Measured Output factor ranged from 0.8341 to 1.1827 for 6 MV, whereas 0.8474 to 1.1312 for 6 MVFFF and 0.8474 to 1.1358 for 10 MV, whereas 0.8855 to 1.0744 for 10 MVFFF. It has been observed that output factor (Scp) at lower field sizes for FFF beam slightly higher in magnitude compare to that of FF beam. Delta variation between FFF and FF slowly decreases with rise in field size and output factors converge to unity at field size of 10 × 10 cm2. There is no significant difference in Scp at lower field sizes for 6 MVFFF beam compared to 6 MV. However, as the field size was increased above 10 × 10 cm2, increase in Scp values for (6 MV, 10 MV) FF beam compared to (6 MVFFF, 10 MVFFF) FFF beams were observed. Delta variation between FF and FFF found to be comparatively more for higher energy beam and also, at the higher field size. The maximum deviation between 6 MV and 6 MVFFF is found to be 4.55%, whereas in 10 MV and 10 MVFFF was 5.71%. Measured Output factor for FF and FFF

Table 1. TrueBeamTM depth dose analyses parameter, PDD measurement performed at SSD = 100 cm.
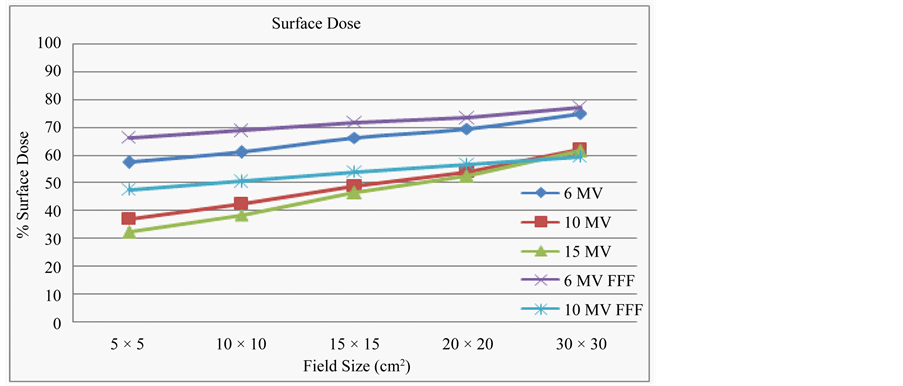
Figure 4. Surface doses (measured with PPC05): Variation of % surface dose with different beam energy and field sizes.
Table 2. TrueBeamTM measured and analyses parameter for FF & FFF beam.
(Lt/Rt)* Corresponds to the left & right sided penumbra.
beam for both symmetric and asymmetric fields are shown in Tables 4(a)-(f). Variation of measured Scp values between (6 MV, 6 MVFFF) and (10 MV, 10 MVFFF) beam plotted against their equivalent field sizes are shown in Figure 7(a), Figure 7(b) respectively.
3.2. Comparison of Dosimetric Parameter
3.2.1. Beam Quality
Comparisons of Measured and calculated values of TPR20/10 for available beam energy are shown in Table 2. Beam quality of FFF beam found to be lesser in magnitude compared to that of FF beam. Percentage of magnitude difference in 6 MVFFF and 10 MVFFF were found to be 5.42% and 4.50% than that of 6 MV and 10 MV FF beam respectively. The percentage deviation between measured and calculated value were observed 0.6%, 0.26%, 0.08%, 0.35% and 0.82% for 6 MV, 6 MVFFF, 10 MV, 6 MVFFF and 15 MV respectively. Graphical representations of beam quality verses beam energy are shown in Figure 8.
 (a) (b)
Figure 5. (a) Depth dose profile for 6MV FF beam at SSD = 100 cm and various field setting ranging from 2 × 2 cm2 to 30 × 30 cm2; (b) Depth dose profile for 6MVFFF beam at SSD = 100 cm and various field setting ranging from 2 × 2 cm2 to 30 × 30 cm2.
 (a) (b)
Figure 6. (a) Depth dose profile for 10 MV FF beam at SSD = 100 cm and various field setting ranging from 2 × 2 cm2 to 30 × 30 cm2; (b) Depth dose profile for 10 MVFFF beam at SSD = 100 cm and various field setting ranging from 2 × 2 cm2 to 30 × 30 cm2.
3.2.2. Jaw Transmission
Reduction in percentage of average jaw transmission found to be 1.58 and 1.71 times for 6 MVFFF and 10 MVFFF FFF beam than that of corresponding 6 MV and 10 MV FF beam respectively. Values of measured average jaw transmission are shown in Table 2 and Figure 9 provides a graphical variation of average jaw transmission verses beam energy.
Table 3. TrueBeamTM measured and analyses parameter for FFF beam.
(Field Size)* Corresponds to estimate the field size from graph & (Lt/Rt)* Corresponds to left & right penumbra.
3.2.3. Interleaf Transmission
Measured values of average and maximum interleaf MLC transmission is shown in Table 2. MLC transmission is increasing with the increase in beam energy. Significant reduction in MLCs interleaf transmissions was observed for FFF beam compared to that of FF beam. This reduction in average interleaf transmissions was found to be 1.78 and 2.09 times for 6 MVFFF and 10 MVFFF FFF beam than their corresponding 6 MV and 10 MV FF beam respectively. Similarly, the magnitude of decrease in maximum interleaf transmission for 6 MVFFF and the 10 MVFFF FFF beam is 1.04 and 1.93 times than that of 6 MV and 10 MV FF beam respectively. All the interleaf transmission measurements were performed at 10 cm off-axis. Minimal difference has been observed at central axis and at 10 cm off axis. Because of the divergent nature of the beam, Interleaf transmission for peripheral MLC found to be lesser compared to that of central one. Graphical representation of Average and Maximum interleaf transmission with beam energy are shown in Figure 10.
3.2.4. Dosimetric Leaf Gap
Calculated DLG parameters for measurement are shown in Table 2. DLG for FFF beam found to be lesser in magnitude comparable to that of FF beam. This increase in DLG with energy found to be minimal. At lower energy 6 MVFFF difference is found to be more than that of 10 MVFFF. Variation in magnitude of DLG found to 3 mm & 1 mm for 6 MVFFF and 10 MVFFF FFF beam than that of 6 MV and 10 MV FF beam respectively.
(a) (b) (c) (d) (e) (f)
Table 4. (a) TrueBeamTM output factor for symmetric field size-measured at depth of 10 cm and SSD = 90 cm; (b) TrueBeamTM output factor for 6 MV asymmetric field size-measured at depth of 10 cm and SSD = 90 cm; (c) TrueBeamTM output factor for 6 MVFFF asymmetric field size-measured at depth of 10 cm and SSD = 90 cm; (d) TrueBeamTM output factor for 10 MV asymmetric field size-measured at depth of 10 cm and SSD = 90 cm; (e) TrueBeamTMoutput factor for 10 MVFFF asymmetric field size-measured at depth of 10 cm and SSD = 90 cm; (f) TrueBeamTM output factor for 15 MV asymmetric field size-measured at depth of 10 cm and SSD = 90 cm.
 (a)
(a)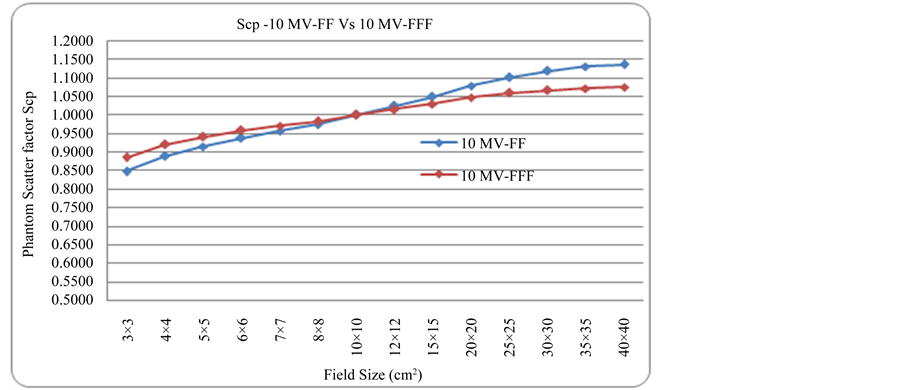 (b)
(b)
Figure 7. (a) Comparison of relative output factor Scp for 6 MV FF and 6 MVFFF beam at depth of 10 cm, SSD = 90 cm and field sizes ranging from 3 × 3 cm2 to 40 × 40 cm2; (b) Comparison of relative output factor Scp for 10 MV FF and 10 MVFFF beam at depth of 10 cm, SSD = 90 cm and field sizes ranging from 3 × 3 cm2 to 40 × 40 cm2.
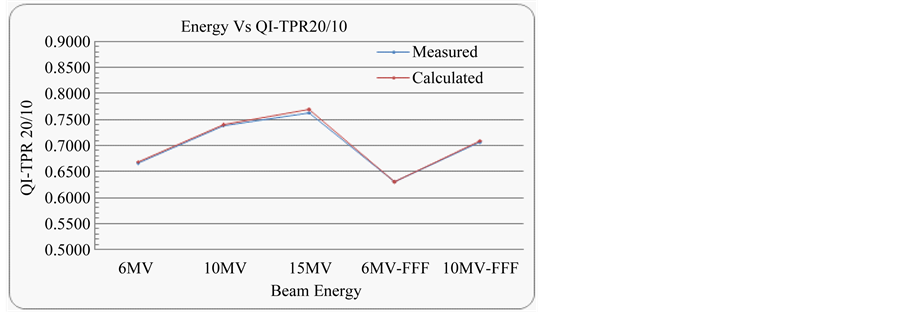
Figure 8. Variation of measured and calculated beam quality index TPR20/10 with FF and FFF beam energy.
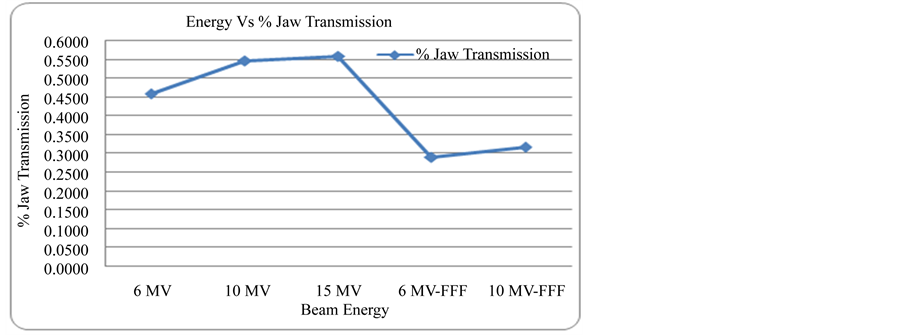
Figure 9. Variation of average jaw transmission with FF and FFF beam energy measured at depth of Dmax and SCD = 100 cm.
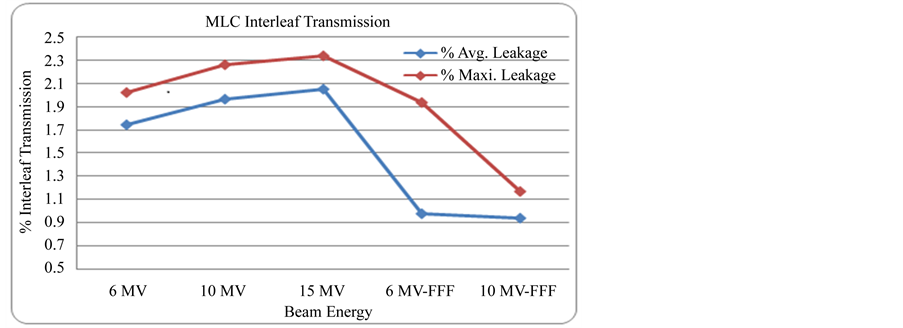
Figure 10. Variation of Average and Maximum interleaf transmission with FF and FFF beam.
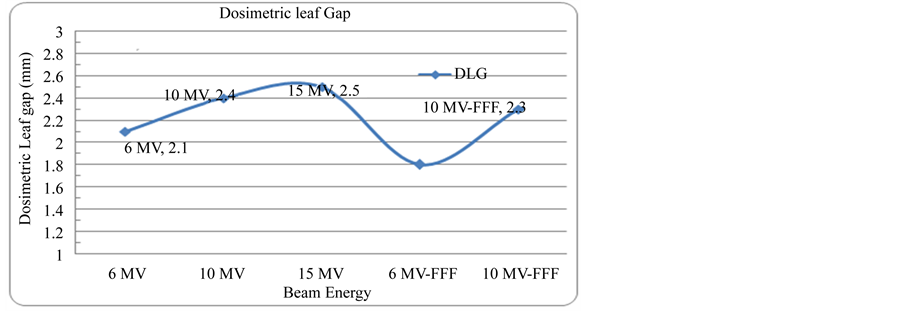
Figure 11. Variation of dosimetric leaf gap (DLG) with FF and FFF beam energy.
Graphical representation of the variation in DLG parameter with beam energy is shown in Figure 11.
4. Discussion
Percentage depth dose is a performance indicator for beam quality. PDD at 10 cm for a field size of 10 × 10 cm2 at SSD 100 cm is a key parameter. Various depth dose parameters for FF and FFF beam are shown in Table 1. It has been observed that, PDD curve for FFF beam has lower down beyond the region of TCPE (Transient Charged Particle Equilibrium) due to the loss of beam hardening effect. Dmax is more specifically function of beam quality and design of the head of the treatment machine.
Removal of flattening filter causes softening of the resulting beam, decrease in scattering and electron conta- mination from flattening filter. The combined effect gives rise to reduce in surface dose. Low energy photon causes an increase in surface dose; a significant rise in surface dose for FFF beam was observed.
Absence of flattening filter causes drastic changes in dose rate and shape of the beam profile. Reference pa- rameters associated with beam profile are flatness, symmetry, and penumbra. It has been observed that removal of the flattening filter also causes lateral softening of the beam. Central Horn in the flattened beam is the cha- racteristic of flattening filter, removal of a FF cause forward peak in the center of the beam and steep gradient in the periphery. The lateral dose falloff in plateau of higher energy is more pronounced compared to lower energy, which influence lateral variation in dose distribution. This can be explained by the smaller scattering angles at higher energies [12] and low energy photons have a larger scattering angle.
In order to quantify the magnitude of the degree of un-flatness of flattening filter free beam, AERB TG re-
commended lateral width of 90%, 75%, and 60% of the beam profile. Lateral separations for lower energy FFF beam were found to be more comparable to that of a high energy FFF beam and width becomes saturated as we become down on the profile. These differences between FF and FFF beams can again be explained by the off-axis softening effect in FFF beams.
Total output factor is the product of collimator scatter (Sc) and phantom scatter (Sp) factor. It has been observed that output factor (Scp) at a smaller field sizes for FFF beam slightly higher in magnitude compare to that of FF beam. Delta variation between FF and FFF slowly decreases with rise in field size and output factors converges to unity at field size of 10 × 10 cm2.There is no significant difference in Scp at smaller field sizes for 6 MVFFF beam compared to 6 MV. However, as the field size were increased above 10 × 10 cm2, increase in Scp values for (6 MV, 10 MV) FF beam compared to (6 MVFFF, 10 MVFFF) FFF beams were observed. Delta variation between FF and FFF comparatively, found to be more for higher energy beam and also at the higher field size. Consequently, at smaller field size in-air collimator scatter factors of FFF beam were found to be the lesser than that of a corresponding FF beam [13] . Dominant factor at lower field sizes are collimator scatter (Sc), whereas at higher field sizes are phantom scatter (Sp). The Difference in two different curves is due to the reduction in head scatter contribution, whereas phantom scatter is remains same. Significant differences in output factor (Scp), between FF beam and FFF beam shows an important role of flattening filter.
As we know the parameter TPR20/10 is a measure of the effective attenuation coefficient describing the approximately exponential decrease of a photon depth dose curve beyond the depth of dose maxima and more importantly, it is independent of the electron contamination in the incident beam. Hence, the magnitude of TPR20/10 in case of FFF beam is lesser than the magnitude of FF beam.
Jaw transmission follows analogous results to TPR20/10. Average percentage jaw transmission for FFF beam found to be less compared to that of FF beam. Measurement performed at off central does not cause significant change in jaw transmission.
Many important parameters related to MLC need consider while configuring the MLC in treatment planning system, MLC transmission is one of those parameters. MLC transmission is increasing with the increase in beam energy. Beam hardening effect has been observed in MLC with increasing energy. Lateral dose falloff for FFF beam and divergent nature of the beam causes, significant reduction in MLC interleaf.
As we know that MLCs transmission increases with increase in energy. On the same analogy, it is being observed that DLG also increases with increase in energy due to the increase in transmission through a round leaf gap of MLC. Characteristic of dosimetric leaf gap influence inverse planning result and dose distribution. The Inadequate dosimetric leaf gap could cause dosimetric errors in the PTV and the OAR (Organ at Risk).
5. Conclusion
Commissioning of Varian TrueBeamTM Linear Accelerator was successfully carried out. Removal flattening filter alters various commissioning associated parameter as Field flatness, Field penumbra, Beam quality, Surface dose, Transmission factor, off axis energy variation and Homogeneity need to be redefined for FFF beam other than FF beam. Since, the concept of homogeneity cannot be applied to FFF beam special attention need to be given while treatment planning. Due to smaller variation of head scatter, off axis energy distribution, electron contamination, leaf transmission the dose calculation accuracy expected to increase. Availability of FFF beam provides additional clinical advantage over flat beam. Commissioning and clinical implementation of FFF mode needs extensive quality assurance. An International TG commissioning protocol needs to be established for measurement of certain FFF associated parameter such flatness, symmetry and stability. FFF beam provides shorter beam delivery has its own advantage in patient comforts; Patient target positioning, Pre and post imaging while SBRT, SRT, and SRS treatment delivery. Overall treatment time required for “Respiratory Gating” and “Rapid Arc” could much shorter because of the larger dose rate. As per as a treatment planning concern, it gives rise to lesser dose in the periphery of the target compared to flattening filter beam. The patient might benefit from decrease exposure of normal tissue. Consistency and stability have been observed over the period of data acquisition.
Acknowledgements
The author would like to acknowledge people for their assistance, continuous encouragement and making this work possible.
Cite this paper
RavindraShende,GouravGupta,GaneshPatel,SenthilKumar, (2016) Commissioning of TrueBeamTM Medical Linear Accelerator: Quantitative and Qualitative Dosimetric Analysis and Comparison of Flattening Filter (FF) and Flattening Filter Free (FFF) Beam. International Journal of Medical Physics, Clinical Engineering and Radiation Oncology,05,51-69. doi: 10.4236/ijmpcero.2016.51006
References
- 1. Das, I.J., Cheng, C.W., Watts, R.J., Ahnesjö, A., Gibbons, J., Li, X.A., Lowenstein, J., Mitra, R.K., Simon, W.E. and Zhu, T.C. (2008) Accelerator Beam Data Commissioning Equipment and Procedures: Report of the TG-106 of the Therapy Physics Committee of the AAPM. Medical Physics, 35, 4186-4215.
http://dx.doi.org/10.1118/1.2969070 - 2. Nath, R., Biggs, P.J., Bova, F.J., Ling, C.C., Purdy, J.A., van de Geijn, J. and Weinhous, M.S. (1994) AAPM Code of Practice for Radiotherapy Accelerators: Report of AAPM Radiation Therapy Task Group No. 45. Medical Physics, 21, 1093-1121. (AAPM Report No. 47)
- 3. Sahani, G., Sharma, S.D., Sharma, P.K., Deshpande, D.D., Negi, P.S., Sathianarayanan, V.K. and Rath, G.K. (2014) Acceptance Criteria for Flattening Filter-Free Photon Beam from Standard Medical Electron Linear Accelerator: AERB Task Group Recommendations. Journal of Medical Physics, 39, 206-211.
http://dx.doi.org/10.4103/0971-6203.144482 - 4. Khan, F.M. (2003) Physics of Radiation Therapy. 3rd Edition, Chapter No. 11, Lippincott Williams & Wilkins.
- 5. Khan, F.M. (2003) Physics of Radiation Therapy. 3rd Edition, Chapter No. 10, Lippincott Williams & Wilkins.
- 6. Musolino, S.V. (2000) Absorbed Dose Determination in External Beam Radiotherapy: An International Code of Practice for Dosimetry Based on Standards of Absorbed Dose to Water. Health Physics, 81, 592-593. (IAEA TRS-398)
- 7. Boyer, A., Biggs, P., Galvin, J., Klein, E., LoSasso, T., Low, D., Mah, K. and Yu, C. (2001) Basic Applications of Multileaf Collimator: Report of Task Group No. 50 Radiation Therapy Committee. American Association of Physicists in Medicine (AAPM TG-50, 10) (AAPM Report No. 72).
- 8. Szpala, S., Cao, F. and Kohli, K. (2014) On Using the Dosimetric Leaf Gap to Model the Rounded Leaf Ends in VMAT/RapidArc Plans. Journal of Applied Clinical Medical Physics, 15, 4484.
- 9. Dosimetric Leaf Gap Measurement, Procedure Recommended by Varian Medical System. Eclipse 10 Inverse Planning Administration and Physics rev. 6.1.1.
- 10. Gloria, P. (2013) Commissioning Measurements for Photon Beam Data on Three TrueBeam Linear Accelerators, and Comparison with Trilogy and Clinac 2100 Linear Accelerators. Journal of Applied Clinical Medical Physics, 14, 4077.
- 11. Chang, Z., Wu, Q.W., Adamson, J., Ren, L., Bowsher, J.E., Yan, H., Thomas, A. and Yin, F.-F. (2012) Commissioning and Dosimetric Characteristics of TrueBeam System: Composite Data of Three TrueBeam Machines. Medical Physics, 39, 6981-7018.
http://dx.doi.org/10.1118/1.4762682 - 12. Georg, D., Knöös, T. and McClean, B. (2011) Current Status and Future Perspective of Flattening Filter Free Photon Beams. Medical Physics, 38, 1280-1293.
http://dx.doi.org/10.1118/1.3554643 - 13. Ashokkumar, S., Nambi Raj, N.A., Sinha, S.N., Yadav, G., Thiyagarajan, R., Raman, K. and Mishra, M.B. (2014) Comparison of Head Scatter Factor for 6MV and 10MV Flattened (FB) and Unflattened (FFF) Photon Beam Using Indigenously Designed Columnar Mini Phantom. Journal of Medical Physics, 39, 184-191.
http://www.jmp.org.in
http://dx.doi.org/10.4103/0971-6203.139010
List of Abbreviations
FF: Flattening filter
FFF: Flattening filter free
PDD: Percentage depth dose
Dmax: Depth of dose maxima
TPR20/10: Tissue Phantom Ratio at depth 20 cm and 10 cm
DLG: Dosimetric leaf gap
MLC: Multi leaf collimator
FWHM: Full width at half maxima
HD: High definition
KV: Kilo voltage
MV: Mega voltage
CBCT: Cone beam computed tomography
IMRT: Intensity modulated radiation therapy
SBRT: Stereotactic body radiation therapy
SRT: Stereotactic radio therapy
SRS: Stereotactic radio surgery
RFA: Radiation field analyzer
AAPM: American association of physicist in medicine
AERB: Atomic energy regulatory board
TG: Task group
AAA: Anisotropic analytic algorithm
EMC: Electron Monte Carlo
TPS: Treatment planning system
PTV: Planning target therapy
IP: Inflection point
S: Starting Point
E: End Point
rcav: Radius of cavity of cylindrical ion chamber
Scp: Total scatter output factor
Sp: Phantom scatter output factor.
Sc: Collimator Scatter output factor
TCPE: Transient charged particle equilibrium
OAR: Organ at risk
OAR: Off axis ratio
NOTES

*Corresponding author.