Advances in Nanoparticles
Vol.2 No.2(2013), Article ID:31476,8 pages DOI:10.4236/anp.2013.22018
Nonuniform Distribution of Capping Ligands Promoting Aggregation of Silver Nanoparticles for Use as a Substrate for SERS
1Shandong Provincial Key Laboratory of Chemical Energy Storage and Novel Cell Technology, School of
Chemistry and Chemical Engineering, Liaocheng University, Liaocheng, China
2State Key Laboratory of Coordination Chemistry, School of Chemistry and Chemical Engineering, Nanjing
National Laboratory of Microstructures, Nanjing University, Nanjing, China
E-mail: *hongminlcu@163.com
Copyright © 2013 Yanwei Zhang et al. This is an open access article distributed under the Creative Commons Attribution License, which permits unrestricted use, distribution, and reproduction in any medium, provided the original work is properly cited.
Received December 29, 2012; revised January 30, 2013; accepted February 6, 2013
Keywords: Silver Nanoparticle; Aggregation; SERS Analysis; Citrate; R6G
ABSTRACT
Citrate-reduced silver nanoparticles (Ag-NPs) are used extensively for surface-enhanced Raman scattering (SERS) studies, but are typically found to aggregate using an aggregation agent. This study is aimed at developing a simple, stable, and reproducible aggregated method for Ag-NPs without any aggregation agents in aqueous solutions. The aggregation is induced by the process of centrifugation, water washing and ultrasonication. A mechanism based on the nonuniform distribution of capping ligands is proposed to account for the aggregated structure formation. UV-Vis-NIR extinction spectra and TEM allowed us to identify the existence of Ag-NPs aggregation. Further, due to the polydisperse mixture of Ag-NPs (20 - 65 nm) used in the present work, Ag-NPs are aggregated closely, which contribute to the observation of low-concentration SERS from the residual citrate layer or even the single-molecule SERS of R6G on aggregation. After the evaporation of droplet of Ag-NPs aggregation on the Si substrate, citrate or R6G could also be detected but with marked redor blue-shifts.
1. Introduction
Surface-enhanced Raman scattering (SERS) technique has proved to be a very effective analytical tool due to its high sensitivity, high selectivity, and fluorescence-quenching properties [1-4], which is a nondestructive technique that provides rich molecular information about molecules and molecular structures in the close vicinity of noble metal surfaces such as gold and silver [5-8]. With down to single molecule sensitivity with intrinsic molecular signature, it has become a promising technique for characterization and detection of a variety of molecules [9-15].
One highly promising approach for the design of SERS substrates involves the positioning or fabrication of nearly adjacent metallic nanostructures with nanoscale gaps [16]. Gaps between adjacent metallic nanostructures have been shown to support extremely intense local electromagnetic fields, known as “hot spots”, upon optical excitation [17-20]. Roughened metal surfaces and dried colloids are common used to generate the “hot spots”, but they cannot yield reproducible SERS spectra because of irreproducible SERS substrates or different orientation of analytical molecules on a metal surface [8]. Noble metal NPs aggregation structure in aqueous solution is a better SERS substrate for reliable and convenient detection for any analytes compared to solid nanostructures. Furthermore, because of the limited influence of waters, SERS, compared with infrared spectroscopy, is a better fit for the main analytical systems that reside in water [20]. In general, Ag-NPs aggregation are induced by using aggregation agents such as electrolytes (nitric acid, metal halide or sulfate salts) [8,10,21]. Especially, citrate-reduced silver colloids aggregated with MgSO4 can give very large SERS enhancement of DNA or proteins [8,10]. However, the existence of the aggregation agents may have an adverse effect on the analytes. For examplehalide-aggregated silver colloids are unsuitable for SERS studies of anionic analytes since the added halide ions form a strongly bonded surface layer which repels anions [22,23]. Although these aggregations can be used sometimes as excellent SERS substrates under defined experimental conditions, the instability and uncontrollable aggregation issues also limit their use.
As far as I know, there is only one previous study where SERS signals in aqueous solution could be obtained for single-molecular R6G by the utilization of Ag-NPs aggregation induced without aggregation agents [24], and few SERS-based studies have reported the direct detection of low-concentration citrate for the citrate-reduced silver nanoparticles (Ag-NPs). In the present study, Ag-NPs were aggregated by the treatment of two cycles of centrifugation, removing the supernatantand and ultrasonication and one time of water washing. The procedure of centrifugation and water washing is used for eliminating the excess surface charge provided by citrate anions. Such an aggregation is most likely due to the nonuniform distribution of capping agents on the Ag-NP crystal surfaces caused from the ultrasonicationand preferred interactions of the uncapped nanoparticle regions. Importantly, on the basis of strong aggregation of Ag-NPs with polydispersity in aqueous solution we have developed a simple SERS detection method for the low-concentration citrate group and even the single-molecular R6G. The procedure of aggregation and SERS determination of citrate and R6G is shown in Scheme 1. But SERS spectra of the negatively charged folic acid and several proteins selected here cannot be observed due to the influence of the charge repelling or the bulk effect.
2. Experimental
2.1. Chemicals
Trisodiumcitrate, AgNO3, rhodamine 6G (R6G), bovine serum albumin (BSA), catalase, pepsin, cytochrome c, avidin, lysozyme and folic acid were purchased from SigmaAldrich. Nanopure water (18.2 MΏ·cm), purified by a Millipore system, was used throughout the experiment.
2.2. Preparation of Silver Colloidal Suspension
The Ag-NPs were prepared via reduction of AgNO3 with sodium citrate, based on the modified method reported by Lee and Meisel. Briefly, 18 mg AgNO3 was dissolved in 100 mL distilled water. This solution was heated until boiling. Then, a 10 mL aliquot of 1% sodium citrate was added into the solution and boiling was kept for 1 h. This colloidal Ag-NP suspension is called 1×. The synthesized colloidal Ag-NPs were characterized with transition electron microscopy (TEM) and UV-Vis-NIR Spectroscopy. A TEM image of the Ag-NPs is provided in Figure 1A, the colloidal suspension contains several sizes and shapes of Ag-NPs with an average diameter of 40 nm. The maximum of the absorption on the UV-Vis-NIR spectrum was observed at ~415 and 470 nm (Figure 2A). In order to increase the number of the Ag-NPs and form the aggregated structure in the colloidal suspension, 1 mL original suspension was centrifuged at 1500 rpm for 5 min and 0.9 mL supernatant removed with the help of a pipet to bring 0.1 mL concentrated 10 × Ag-NPs which was further processed with ultrasonication for 5 min and re-dispersed into 1 mL with ultrapure water. Then, the treatment of the centrifugation, supernatant remove and ultrasonication happened again without washing with water, which brought the final concentration Ag-NPs aggregation (0.1 mL). This concentrated Ag-NP aggregation was used for SERS experiments of citrate and all analytes.
2.3. SERS Measurements
SERS of citrate were directly determined by putting the suitable Ag-NPs aggregate solution into a quartz glass capillary without any other treatment. The R6G, folic acid or proteins aqueous solutions mixed with the treated Ag-NPs aggregation according to 1:10 proportion and put into a quartz glass capillary for Raman measurement.
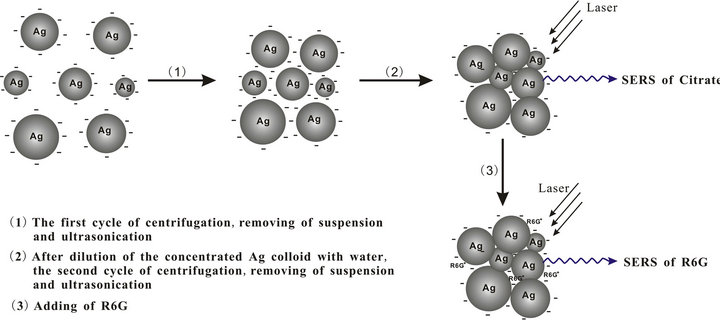
Scheme 1. Schematic illustration of the aggregating process of Ag-NPs by the proposed method and used as the substrate for SERS analysis of citrate and R6G.
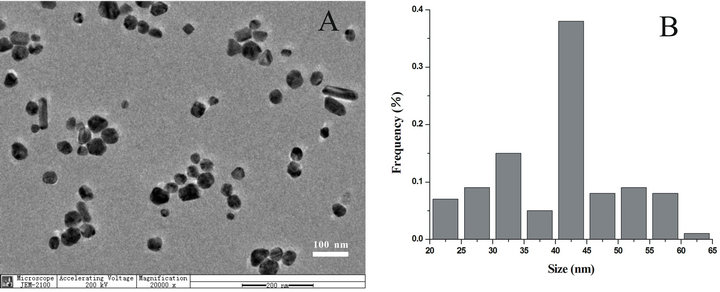
Figure 1. (A) TEM image of the original citrate-reduced Ag-NPs prepared by the present method; (B) The size distribution of Ag-NPs with polydispersity.
All SERS spectra were measured with a Renishaw micro-Raman system (RM 2000), and the 785 nm line of a NIR diode laser was used as an excitation source. The signal was calibrated by using the 520 cm−1 line of a Si wafer and a 50 × objective. The typical exposure time for each SERS measurement in this study was 20 s. Spectra were recorded in the 200 - 4000 cm−1 region. After SRES spectra collection, we did not treat them except for baseline correction.
3. Results and Discussion
TEM measurements (Figure 1A) ensured us that various shapes of prepared particles such as ellipsoid, rod, sphere or their aggregation were contained with wide range of sizes, 20 - 65 nm (Figure 1B), as supported by a little local surface plasmon peak at 415 nm with accompanying a distinct shoulder at longer wavelength 470 nm formed by the local aggregation of Ag-NPs in extinction spectra (Figure 2A-a). These observations are in contrast to those for the nanoparticles (size in 50 - 90 nm) prepared by the same method but with less amount of reducing agents sodium citrates [8,17] or by the microwave method [13,24], which are not only isolated in solution but also homogeneous in shape and sizes, and only with a sharp localized surface plasmon peak at 400 nm in extinction spectra. Aggregated particles prepared here facilitated us to investigate their function as the SERS substrate.
It is well known that citrate-reduced Ag-NPs are stabilized by a surface layer of silver citrates, with pendant negative groups [25]. In the present of appropriate AgNPs aggregation, citrate group should be examined by SERS. But we cannot observe the Raman spectrum of citrate from the original solutions. Since the EM field between the Ag-NPs increases when the gap distance decreases, the shorter gap distance can lead to a stronger EM field and, therefore, an increased SERS signal. Above the consideration of this aspect, the aggregation presented in the original Ag-NPs solutions should be enhanced further.
Generally, the aggregation process of Ag-NPs is induced by the addition of acid or activating ions, for example, Cl− or SO42− [8,10,21]. In this contribution, we wish to report on a facile preparation route that relies on the decreasing of the capping citrates on the surface of Ag-NPs leading to their aggregation. Also, the degree of aggregation can be controlled by facile adjustment the amounts and distribution of charges on the Ag-NPs surface. Previously, Zhu and coworkers reported a nanoparticles assembly method through controlling the distribution of charges on gold nanoparticles [26,27]. Here, in order to increase the number of the Ag-NPs in the colloidal solution and decrease their gap distance, the original suspension was centrifuged and a portion of supernatant was removed to bring the final concentration to 10 × Ag-NPs. Disappointedly, on this occasion the SERS analysis of residual citrate cannot be observed all the same (Figure 3-a). This may be because the one cycle of treatment process of centrifugation, removing the supernatant and ultrasonication cannot decrease the amount of charges, but only increase the concentration of NPs and reduce the distance of neighboring Ag-NPs.
Figure 2A-b shows UV-Vis spectra of the aggregated Ag-NPs solution after one cycle (Ag-1) of the centrifugation, removing the supernatant, ultrasonication and ultrapure water dilution treatment by the present method (Scheme 1). Similar to the sample Ag-blank, Ag-NPs also exhibit a relative good state of monodispersity, even after the removal of most stabilizing agents. It reveals that the process of concentration cannot induce the effective aggregation for SERS analysis, which is also confirmed by TEM (not shown).
Generally speaking, the citrate anions were chemisorbed and in no way washed away by pure water [28]. Actually, in the conditions of the low concentration of citrate anion, the ultrasonication can induce the nonuniform distribution of negative charges which result in the
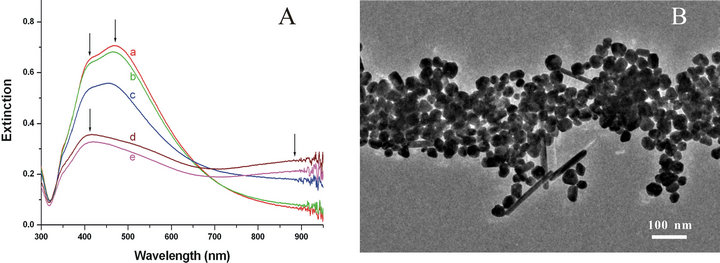
Figure 2. (A) UV-Vis-NIR spectra of an original citrate-reduced Ag-NPs solution (a, Ag-blank), and Ag-NPs aggregated solutions after one cycle (b, Ag-1), two cycles (c, Ag-2), three cycles (d, Ag-3), and four cycles (e, Ag-4) of centrifugation, removing the supernatant, ultrasonication and water dilution, respectively; (B) TEM image of the Ag-NPs aggregation after two cycles of the treatment process of centrifugation, ultrasonication and water dilution.
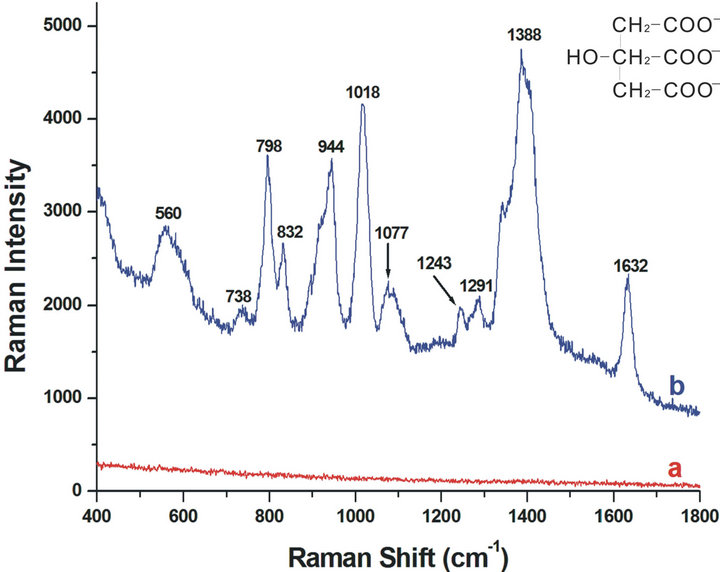
Figure 3. SERS spectra of citrate group in the concentrated 10 × Ag-NPs solutions (a) and (b) with one cycle of ultrapure water dilution, centrifugation, removing the supernatant and then ultrasonication for 10 × Ag-NPs.
formation of larger aggregation [27]. It indicates that the ultrasonication plays a major role in the aggregation process of Ag-NPs of the proposed method here.
Figure 2B shows the TEM image of Ag-NPs aggregation prepared from 1 mL of two cycles of centrifugation, removing the supernatant, ultrasonication and water dilution (Ag-2). The close aggregation of Ag-NPs can be seen everywhere, and the amount of isolated Ag-NPs and small assembly parts are decreased apparently. The state of the aggregation in solution was also revealed by the UV-Vis-NIR extinction spectrum, Figure 2A-c. First, the absorption intensity of isolated Ag-NPs and small aggregation is decreased obviously compared with the untreated solution. Second, broad bands were observed at above 800 nm in UV-Vis-NIR spectra of the aggregated silver solutions after two cycles of processes. It enables us conclude these particles are most aggregated in solution. According to the surface plasmon resonance (SPR) of silver aggregation, we chose 785 nm as an excitation wavelength for electromagnetic enhancement [29,30]. Exhilaratingly, intense SERS spectra of citrate were obtained on the Ag-NPs aggregation after one cycle of ultrapure water dilution, centrifugation, removing the supernatant and then ultrasonication for 10 × Ag-NPs.
Figure 3-b shows the SERS spectra of citrate, and the bands are consistent with the values being assigned previously [21,25]. The SERS frequency and relative intensity of each band together with tentative assignments of a number of citrate bands are reported in Table 1. The principal band is at 1388 cm−1, which is assigned as the carboxylate symmetric stretching mode from citrate, vs(COO). When compared with the Raman spectrum of trisodium citrate in solution (~1417 cm−1), this band is broadened and blue-shifted, indicating interactions between the carboxylates and the silver surface. This is also supported by the decreasing of the bands at 1291 and 1243 cm−1 which are associated with the carboxylate deformations, δ(COO). A strong increase in relative intensity is observed for the band at 1018cm−1, which is tentatively assigned to the carbon-oxygen stretch, v(C-O), of the tertiary alcohol. The bands at 944 and 832 cm−1 are assigned to the three carbon-carbon stretching modes, v(C-COO), and also the strong intensity of the band at 798 cm−1 is associated with the carbon-oxygen symmetric stretching mode, vs(CCCC-O). Differently, a new band at 560 cm−1 was observed, which is never reported previously. And it is assigned as the carboxylate in-plane bending vibration mode, v(COO), and the weak band at 738 cm−1 could be its out-plane bending vibration. The reproducibility of these bands has been confirmed, three determinations for different samples are carried out at different laser power and the results are shown in Figure 4. In addition, an acute weak peak was also observed at 1632 cm−1. When similar band in this general region was
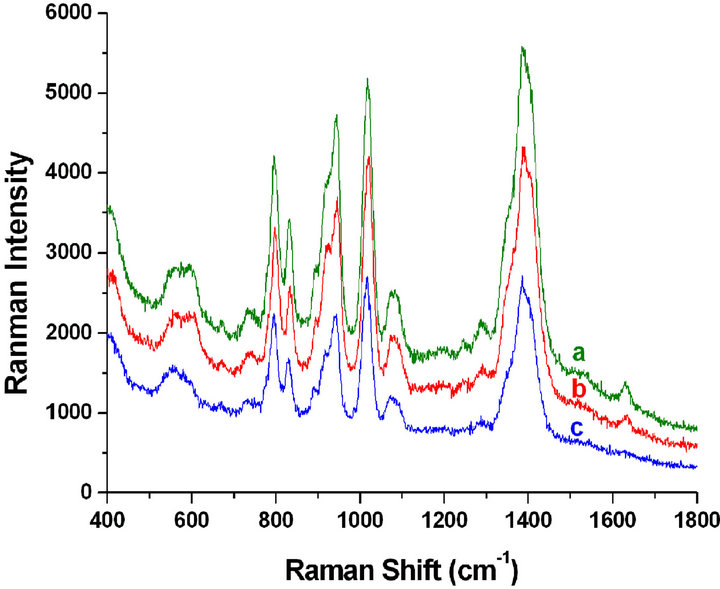
Figure 4. The mean SERS of citrate group in the concentrated Ag-NPs solutions prepared by the proposed method from different samples. Laser power at the samples (a), (b) and (c) were set at 25, 25 and 2 mW, respectively.
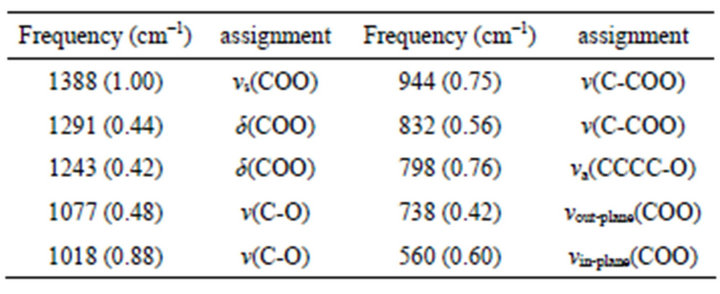
Table 1. SERS frequencies and assignments for citrate at the surface of Ag-NPs aggregation. The values in parentheses are the relative intensities of each band with respect to the principal band (~1388 cm−1).
previously observed in SERS experiments, it was convincingly argued that it was due to amorphous carbon created on the Ag surface by high intensity laser irradiation [21]. In order to prove the assignment, a weak laser power at the sample at 2 mW was set, and this band is disappeared as expected and accordingly the other bands are all observed as mentioned above (see Figure 4-c).
However, for preparing the stable Ag-NPs aggregation, the process of water washing could not increase beyond one time. An important observation is that, after two cycles of ultrapure water dilution, centrifugation, removing the supernatant and then ultrasonication for 10 × Ag-NPs the resulting solution was very unstable, and increasing larger aggregation formed in the solution which will precipitate to the bottom of the centrifuge tube after a while. Figures 2A-d and -e show the UV-Vis-NIR extinction spectra of these samples obtained after two and three cycles of washing process. It can be seen that smaller Ag-NPs aggregation have disappeared, and follows the enhancing of the longitudinal band corresponding to the formation of larger aggregation. Although SERS spectra of citrates could also be observed for the position of Ag-NPs aggregation, we cannot obtain any signal at the blank part. The nonhomogeneity of Ag-NPs aggregation is not favorable of SERS analysis for analytes in aqueous solution.
The efficacy of the Ag-NPs aggregation obtained by the proposed method is not limited to the citrate anions at the surface of Ag-NPs. We have also recorded strong SERS signals from 10−12 mol/L level R6G, which is a well-known surface-enhanced Raman dye and has been used in single-molecule detection [31,32]. In the experiment, the diameter of the laser bot is 1 µm, and the determination depth for the sample is about 1 mm. Accordingly, the determination volume of the laser for the sample is about 8 ´ 10−13 L. The concentration of R6G is prepared as 2.2 ´ 10−12 mol/L. As a consequence, the molecular amount of R6G in the determination is 1.05 and it has reached the single-molecular detection level (Figure 5). The sensitive detection for R6G is benefited mostly by the electromagnetic enhancement caused by the Ag-NPs aggregation. Partly remaining negative charges on the Ag surface, and the decrease of the gap size among adjacent Ag-NPs, providing huge electric field, facilitated R6G cations to adsorb on the nanoparticles, especially at the junction. Studies reveal that it is difficult to detect R6G molecules in the non-aggregated silver colloids at such low concentration [28]. Otherwise, there exist the strong electrostatic interactions between the citrate anions and the positive R6G molecules, which provides additional chemical enhancement by the electronic interaction between metals and adsorbed species. Further, the negative folic acid has also been experi mented. But its SERS spectra cannot be obtained except for that of citrate, which may be due to the charge repelling between folic acid and citrate ions preventing the
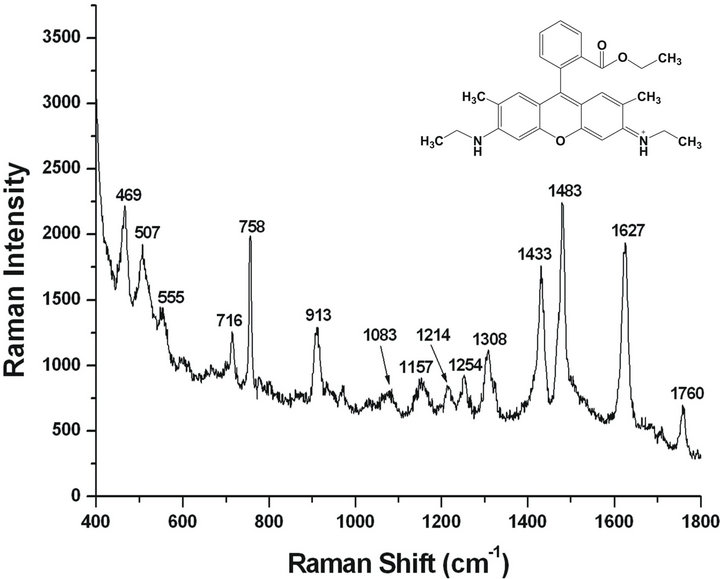
Figure 5. SERS spectrum of R6G in the Ag-NPs aggregate solution with one cycle of ultrapure water dilution, centrifugation, removing the supernatant and then ultrasonication for 10 × Ag-NPs.
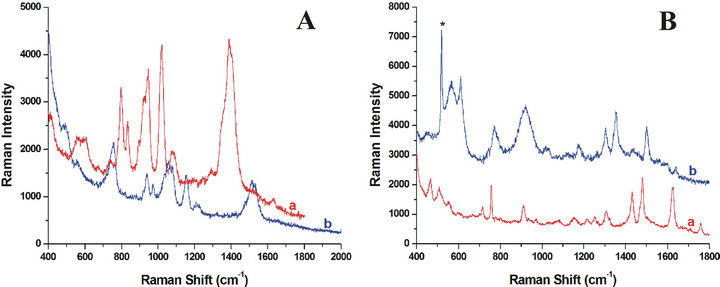
Figure 6. Comparison of SERS spectrum of citrate anions (A) and R6G (B) in the Ag-NPs aggregation aqueous solution (a) or the dried Ag-NPs aggregation on the Si substrate (b). The symbol of * in this figure denotes the Raman signal from Si substrate.

Table 2. Comparison of SERS frequencies of citrate anions and R6G in aqueous solution and on Si substrate for citrate.
former onto or into close proximity with the Ag-NPs. In addition, except for the charge effect, the small gap size of the Ag-NPs aggregation has also restricted its use in the detection of macromolecules, such as proteins. We have tested two series of proteins: negatively charged ones (BSA, pepsin and catalase) and positively charged ones (cytochrome c, avidin and lysozyme). But no any typical bands originating from different amino acid residues are observed. Since the size of proteins is much larger than the size of R6G, as well as the residual citrate anions, which prevent to access the Ag surfaces for some groups of target proteins (e.g., COO-, tyrosine, and tryptophan residues) by physical and hydrophobic interactions. In addition, the small size of the spaces among the Ag-NPs in the aggregation could be another factor. Secondly, due to the smaller size of silver nanoparticles compared to those used in literatures (usual 50 - 90 nm) [8,33,34] and its nonuniformity the spaces among the Ag-NPs are very small, which permit the entry for small molecules like R6G and block macromolecules into the “spot dots”, such as catalase with the size of (6.02 ± 0.09 nm) although with positive charges [35]. The absence of citrate bands from the spectra of the R6G shows that they also can not compete effectively with the protonated amino for the sites on the surface. There is clearly a “first layer” effect operating since the signals from the surface-bound species dominate the spectra.
In order to further demonstrate the reproducibility of the controlled assembly system, the SERS spectra of the aggregated status of Ag-NPs evaporation of water from the droplet on a quartz plate were investigated. We found that the signal of citrate group could also be observed as expected, but with marked red-shift for all peaks (shift about 135 cm−1) (Figure 6A). The R6G SERS spectra of volatile aggregation of R6G/Ag-NPs mixture with the concentration mentioned above was also obtained. Nevertheless, the signals are blue-shift differently (shift about 135 cm−1) (Figure 6B), which may be due to the orientation discrepancy for different molecules on the surface of Ag-NPs aggregation solid substrates when compared to that of the aqueous solution. Comparison of SERS frequencies in aqueous solution and on Si substrate for citrate and R6G respectively are shown in Table 2.
4. Conclusions
On the basis of our experimental results, the SERS spectra of the low-concentration citrate or the single-molecule R6G could be detected on the Ag-NPs aggregation prepared by the proposed method. After two cycles of centrifugation, removing the supernatant and ultrasonication and one time of water washing Ag-NPs can aggregate closely in aqueous solution without adding any aggregation agents. But the aggregating process cannot excess two cycles for the stability and reproducibility of the aggregated systems. In the process of aggregation, ultrasonication plays a key role which lead to the nonuniform distribution of capping ligands. However, with the present Ag-NPs aggregation, the negatively charged folic acid and two types of proteins selected here cannot be observed. This is attributed to poor adsorption of the anionic molecules to the Ag-NPs aggregation due to the charge repelling with the negatively charged citrate layer on the surface of the silver or the larger molecular size for proteins. In addition, after the evaporation of a droplet of Ag-NPs aggregation solution on the Si substrate, citrate or R6G could also be detected but with marked redor blue-shifts.
We believe that our approach provides a simple and efficient pathway to the rational development of nanoparticles aggregate systems, which can allow the detection of trace concentrations of not just known Raman markers, but also some positively charged small molecules. More NPs aggregation for SERS substrates with different metals or sizes will be further researched by this way of useless of aggregation agents for the detection of practical target molecules such as DNA, protein, biomarkers, plastic explosives, and hazardous chemicals directly in aqueous solution.
5. Acknowledgements
We acknowledge the National Natural Foundation of China (21105042), the National Basic Research Program (No. 2010CB234601), the Natural Science Foundation of Shandong Province (ZR2011BM007, ZR2010BQ021) and the Liaocheng University Funds for Young Scientists (31805) for financial support. And this work was supported by Shandong “Tai-Shan Scholar Research Fund”.
REFERENCES
- R. K. Chang and T. E. Furtak, “Surface-Enhanced Raman Scattering,” Plenum Press, New York, 1982. doi:10.1007/978-1-4615-9257-0
- K. Kneipp, H. Kneipp, I. Itzkan, R. R. Dasari and M. S. Feld, “Ultrasensitive Chemical Analysis by Raman Spectroscopy Chemical Reviews,” Vol. 99, No. 10, 1999, pp. 2957-2975. http://shaker.umh.es/docencia/aesma/review.Raman.Spctroscopy.1999.pdf
- G. C. Schatz and P. R. Van Duyne, “Electromagnetic Mechanism of Surface-Enhanced Spectroscopy,” In: J. M. Chalmers and P. R. Griffiths, Eds., Handbook of Vibrat ional Spectroscopy Vol. 1, John Wiley & Sons Ltd., Chichester, 2002, p. 759.
- R. Aroca, “Surface-Enhanced Vibrational Spectroscopy,” John Wiley & Sons Ltd., Chichester, 2006. doi:10.1002/9780470035641
- K. Kneipp, M. Moskovits and H. Kneipp, “Surface-Enhanced Raman Scattering,” Springer-Verlag, Berlin, 2006. doi:10.1007/3-540-33567-6
- S. Lee, S. Kim, J. Choo, S. Y. Shin, Y. H. Lee, H. Y. Choi, S. Ha, K. Kang and C. H. Oh, “Biological Imaging of HEK293 Cells Expressing PLCγ1 Using Surface-En-
- hanced Raman Microscopy,” Analytical Chemistry, Vol. 79, No. 3, 2007, pp. 916-922. doi:10.1021/ac061246a
- C. Ruan, W. Wang and B. Gu, “Detection of Alkaline Phosphatase Using Surface-Enhanced Raman Spectroscopy,” Analytical Chemistry, Vol. 78, No. 10, 2006, pp. 3379-3384. doi:10.1021/ac0522106
- X. X. Han, G. G. Huang, B. Zhao and Y. Ozaki, “Label-Free Highly Sensitive Detection of Proteins in Aqueous Solutions Using Surface-Enhanced Raman Scatting,” Analytical Chemistry, Vol. 81, No. 9, 2009, pp. 3329- 3333. doi:10.1021/ac900395x
- X. X. Han, B. Zhao, Y. Ozaki, “Surface-enhanced Raman scattering for protein detection,” Analytical Bioanalytical Chemistry, Vol. 394, No. 7, 2009, pp. 1719-1727. doi:10.1007/s00216-009-2702-3
- S. E. J. Bell and N. M. S. Sirimuthu, “Suface-Enhanced Raman Spectroscopy (SERS) for Sub-Micromolar Detection of DNA/RNA Mononucleotides,” Journal of the American Chemical Society, Vol. 128, No. 49, 2006, pp. 15580-15581. doi:10.1021/ja066263w
- W. Yuan, H. P. Ho, R. K. Y. Lee, S. K. Kong, “Sur FaceEnhanced Raman Scattering Biosensor for DNA Detection on Nanoparticle Island Substrates” Applied Optics, Vol. 48, No. 22, 2009, pp. 4329-4337. doi:10.1364/AO.48.004329
- Y. C. Cao, R. Jin and C. A. Mirkin, “Nanoparticles with Raman Spectroscopic Fingerprints for DNA and RNA Detection,” Science, Vol. 297, No. 5586, 2009, pp. 1536- 1540. doi:10.1126/science.297.5586.1536
- H. W. Han, X. L. Yan, R. X. Dong, G. Ban and K. Li, “Analysis of Serum from Type II Diabetes Mellitus and Diabetic Complication Using Surface-Enhanced Raman Spectra (SERS),” Applied Physics B, Vol. 94, No. 4, 2009, pp. 667-672. doi:10.1007/s00340-008-3299-5
- T. A. Alexander, “Development of Methodology Based on Commercialized SERS-Active Substrates for Rapid Discrimination of Poxviridae Virions,” Analytical Chemistry, Vol. 80, No. 8, 2008, pp. 2817-2825. doi:10.1021/ac702464w
- M. Kahraman, A. I. Zamaleeva, R. F. Fakhrullin and M. Culha, “Characterization of Yeast Species Using SurfaceEnhanced Raman Scattering Volume,” Applied Spectroscopy, Vol. 63, No. 11, 2009, pp. 1276-1282. doi:10.1366/000370209789806849
- H. Wang, C. S. Levin and N. J. Halas, “Nanosphere Arrays with Controlled Sub-10-nm Gaps as Surface-Enhanced Raman Spectroscopy Substrates,” Journal of the American Chemical Society, Vol. 127, No. 43, 2005, pp. 14992-14993. doi:10.1021/ja055633y
- Y. Maruyama and M. Futamata, “Anion Induced SERS Activation and Quenching for R6G Adsorbed on Ag Nanoparticles,” Chemical Physics Letters, Vol. 448, No. 1-3, 2007, pp. 93-98. doi:10.1016/j.cplett.2007.09.056
- P. J. Schuck, D. P. Fromm, A. Sundaramurthy, G. S. Kino and W. E. Moerner, “Improving the Mismatch between Light and Nanoscale Objects with Gold Bowtie Nanoantennas,” Physical Review Letters, Vol. 94, No. 1, 2005, pp. 17402. doi:10.1103/PhysRevLett.94.017402
- R. Kodiyath, T. A. Papadopoulos, J. Wang, Z. A. Combs, H. Li, R. J. C. Brown, J. Bredas and V. V. Tsukruk, “Silver-Decorated Cylindrical Nanopores: Combining the Third Dimension with Chemical Enhancement for Efficient Trace Chemical Detection with SERS,” Journal of Physical Chemistry C, Vol. 116, No. 26, 2012, pp. 13917- 13927. doi:10.1021/jp300902u
- W. Ren, Y. X. Fang and E. K. Wang, “A Binary Functional Substrate for Enrichment and Ultrasensitive SERS Spectroscopic Detection of Folic Acid Using Graphene Oxide/Ag Nanoparticle Hybrids,” ACS Nano, Vol. 5, No. 8, 2011, pp. 6425-6433. doi:10.1021/nn201606r
- S. E. J. Bell and N. M. S. Sirimuthu, “Surface-Enhanced Raman Spectroscopy as a Probe of Competitive Binding by Anions to Citrate-Reduced Silver Colloids,” Journal of Physical Chemistry A, Vol. 109, No. 33, 2005, pp. 7405-7410. doi:10.1021/jp052184f
- S. E. J. Bell, J. N. Mackle and N. M. S. Sirimuthu, “Quantitative Surface-Enhanced Raman Spectroscopy of Dipicolinic Acid-Towards Rapid Anthrax Endospore Detection,” Analyst, Vol. 130, No. 4, 2005, pp. 545-549. doi:10.1039/b415290e
- S. E. J. Bell and N. M. S. Sirimuthu, “Surface-Enhanced Raman Spectroscopy (SERS) for Sub-Micromolar Detection of DNA/RNA Mononucleotides,” Journal of the American Chemical Society, Vol. 128, No. 49, 2006, pp. 15580-15581. doi:10.1021/ja066263w
- F. R. Ma, K. Liu, Y. Zhang and S. Pan, “A Novel Silver Colloid as Substrate for Detection of Single-Molecular Level of R6G,” The Journal of Light Scattering, Vol. 19, No. 1, 2007, p. 11.
- C. H. Munro, W. E. Smith, M. Garner, J. Clarkson and P. C. White, “Characterization of the Surface of a CitrateReduced Colloid Optimized for Use as a Substrate for Surface-Enhanced Resonance Raman Scattting,” Lanmuir, Vol. 11, No. 10, 1995, pp. 3712-3720. doi:10.1021/la00010a021
- M. Hong, L. L. Wu, L. F. Tian and J. Zhu, “Controlled Assembly of Au, Ag, and Pt Nanoparticles with Chitosan,” Vol. 15, No. 24, 2009, pp. 5935-5941.
- L. L. Wu, C. S. Shi, L. F. Tian and J. Zhu, “A One-Pot Method to Prepare Gold Nanoparticle Chains with Chitosan,” Journal of Physical Chemistry C, Vol. 112, No. 2, 2008, pp. 319-323. doi:10.1021/jp076733o
- M. Futamata and Y. Maruyama, “LSP Spectral Changes Correlating with SERS Activation and Quenching for R6G on Immobilized Ag Nanoparticles,” Applied Physics B, Vol. 93, No. 1, 2008, pp. 117-130. doi:10.1007/s00340-008-3179-z
- S.Schlucker, “Surface Enhanced Raman Spectroscopy: Analytical, Biophysical and Life Science Applications,” Wiley-VCH Verlag GmbH & Co., Weinheim, 2011.
- H. Wang, C. S. Levin and N. J. Halas, “Nanosphere Arrays with Controlled Sub-10-nm Gaps as Surface-Enhanced Raman Spectroscopy Substrates,” Journal of the American Chemical Society, Vol. 127, No. 43, 2005, pp. 14992-14993. doi:10.1021/ja055633y
- S. Nie and S. R. Emory, “Probing Single Molecules and Single Nanoparticles by Surface-Enhanced Raman Scattering,” Science, Vol. 275, No. 5303, 1997, pp. 1102- 1106. doi:10.1126/science.275.5303.1102
- K. Kneipp, Y. Wang, H. Kneipp, L. T. Perelman, I. Itzkan, R. R. Dasari and M. S. Feld, “Single Molecule Detection Using Surface-Enhanced Raman Scattering (SERS),” Physical Review Letters, Vol. 78, No. 9, 1997, pp. 1667- 1670. doi:10.1103/PhysRevLett.78.1667
- J. Polleux, N. Pinna, M. Antonietti and M. Niederberger, “Ligand-Directed Assembly of Preformed Titania Nanocrystals into Highly Anisotropic Nanostrutures,” Advanced Materials, Vol. 16, No. 5, 2004, pp. 436-439. doi:10.1002/adma.200306251
- X. X. Han, Y. Kitahama, T. Itoh, C. X. Wang, B. Zhao, Y. Ozaki, “Protein-Mediated Sandwich Strategy for Surface-Enhanced Raman Scattering: Application to Versatile Protein Detection,” Analytical Chemistry, Vol. 81, No. 9, 2009, pp. 3350-3355. doi:10.1021/ac802553a
- M. Kahraman, I. Sur and M. Culha, “Label-Free Detection of Proteins from Self-Assembled Protein-Silver Nanoparticle Structures Using Surface-Enhanced Raman Scattering,” Analytical Chemistry, Vol. 82, No. 18, 2010, pp. 7596-7602. doi:10.1021/ac101720s
NOTES
*Corresponding author.