American Journal of Plant Sciences
Vol.5 No.9(2014), Article ID:44518,7 pages DOI:10.4236/ajps.2014.59130
QTL Analysis of Yield Components in Rice Using a Cheongcheong/Nagdong Doubled Haploid Genetic Map
Gyu Hwan Park1, Jin-Hee Kim2, Kyung-Min Kim2*
1Department of Plant Resources, College of Life Science and Natural Resources, Kyungpook National University, Sangju, Korea
2Division of Plant Biosciences, School of Plant Biosciences, Kyungpook National University, Daegu, Korea
Email: pgh@knu.ac.kr, jinhee2723@naver.com, *kkm@knu.ac.kr
Copyright © 2014 by authors and Scientific Research Publishing Inc.
This work is licensed under the Creative Commons Attribution International License (CC BY).
http://creativecommons.org/licenses/by/4.0/


Received 27 January 2014; revised 2 March 2014; accepted 20 March 2014
ABSTRACT
In this study, only two of 12 quantitative trait loci (QTLs) affecting yield and yield components were identified in a single year, indicating that individual QTLs are probably sensitive to the environment. A rice growth survey of “Cheongcheong” and “Nag dong” in a doubled haploid population in 2012 revealed that yield capacity was influenced by climate change. Analysis of yield and yield components indicated that five average traits are high in “Cheongcheong”. Frequency distribution tables indicated that panicles per plant (PPP), spike lets per panicle (SPP), and 1000-grain weight (TGW) were normally distributed. The strongest relationship was identified between SPP and seed set percentage (SSP) among phenotypic correlations related to yield and yield components found on chromosomes 2, 3, 6, 8 in 2012. SPP and SSP was a very relevant requisite about quantity. Analysis of QTL about quantity was total 9. In the present study, a doubled haploid population was used to analyze the epistatic effects on yield and yield components in rice. Although other epistatic QTLs were not included in any of the main-effect QTLs, they significantly influenced the traits. These results indicated that epistatic interaction plays an important role in controlling the expression of complex traits. Thus, the utilization of marker-assisted selection in rice breeding programs should take epistatic effects into consideration. Hence, the QTLs responsible for major effects are more suitable for marker-assisted selection programs to improve yield and related traits across different environments.
Keywords:Rice; QTL; Yield; Epistatic

1. Introduction
Rice, which is one of the most important crops grown worldwide, is eaten by more than half of the world’s population. Rice consists of the indica, japonica, and javanica types. These phenotypes developed under different environmental conditions, and are thus clearly distinguished by the country in which they are grown. Residents of the Republic of Korea, and most Asian countries, rely on rice for 60% - 70% of their daily nourishment. Since the green revolution in the 1980s, South Korean rice production has more than doubled. Beginning in the late 1990s, this increase has made stable self-sufficiency possible. In addition, Tongilbyeo was bred by cross breeding indica and japonica in the late 1960s, and has been bred ever since. Further, cultivation techniques have been established. Currently, improved japonica varieties are mainly being grown, although tongilbyeo-type varieties are grown for application-specific purposes. The development of rice cultivars has been successful, but the world’s population continues to suffer from famines. Therefore, continuous study into ways to increase the rice yield may be necessary.
The advent of molecular marker technology and molecular linkage genetic maps has made it possible to characterize the performance of individual quantitative trait loci (QTLs). These techniques have been widely applied to identify QTLs controlling yield and related traits in various crops, such as maize [1] -[3] , tomatoes [4] -[6] , and wheat [7] [8] . QTL analyses have been conducted focusing on traits that are components of grain yield and quality [9] -[11] . A number of QTLs have been identified in rice using various genetic backgrounds in different environments [12] -[15] , which has provided useful information for breeders to improve breeding strategies via marker-assisted selection (MAS). The effects of epistasis have been identified by classical quantitative genetic analysis. The existence of digenicepistatic interactions in barley has been demonstrated using morphological markers [16] . Recent QTL mapping studies have revealed that epistatic interactions among multiple loci play an important role in complex quantitative traits such as yield and yield components. In rice, several mapping populations have been developed to detect epistatic effects onyield and related traits, such as the F2, F2:3 chromosome segment substitution lines (CSSL). Doubled haploid (DH) populations with homozygous genotypes derived from F1 plants via anther culture can be used to detect additive effects within a single locus and additive effects between loci. Quantitative traits are controlled by polygenes that have very small effects and are sensitive to the environment. QTL-environment (QE) interaction is an important component for plant evolution and breeding. The QE of yield and related traits has been extensively investigated in many crops [17] -[19] . A number of QTLs detected in one or several different environments have been found to have significant QE effects in previous studies, indicating that QE interactions commonly impact quantitative traits in various environments.
This study was conducted to facilitate evaluation of the genetic basis of yield-related traits and improve selective efficiency via the detection of QTLs controlling yield and yield components in different environments, as well as the analysis of the epistatic effects and QE interactions using a rice DH population. The information presented in this study can be used for the development of new cultivars in future studies.
2. Materials and Methods
2.1. Plant Materials and Field Experiments
A population of 70 DH lines derived from a cross between the rice lines “Cheongcheong” (Oryza sativa L. ssp. indica) and “Nagdong” (Oryza sativa L. ssp. japonica) was used in this study, which was conducted on the experimental farm of Kyungpook National University. The germinated seeds were sown in a seedling bed, and seedlings were transplanted into three-row plots after 30 days. In 2012, the population was evaluated in a randomized complete block design with two replications Seventeen plants were cultivated in each row, with 30 cm between rows and 15 cm between plants within each row. The parents, “Cheongcheong” and “Nagdong”, were cultivated in 10 plots as controls. All of the panicles from each plant were harvested and retained in different envelopes to avoid seed shattering. Panicles per plant (PPP) were identified as the mean number of panicles per plant. Spikelets per panicle (SPP) were counted as the average number of spike lets per panicle. Seed set percentage (SSP) was evaluated using the number of filled grains per plant divided by the number of spike lets per plant. The 1000-grain weight (TGW) was measured as the average weight of 1000 filled grains. Yield was evaluated as the weight of all filled grains of the plant, which was converted to kg per 10a (kg/10a). Mean values of the two replications were calculated for each trait and used in data analysis.
2.2. DNA Extraction
A population of 70 DH lines derived from a cross between “Cheongcheong” (Oryza sativa L. ssp. indica) and “Nagdong” (Oryza sativa L. ssp. japonica) was grown in a greenhouse for 3 weeks. The experimental design was based on that of Chen and Ronand (1999). A total 20 - 100 mg of leaves of each sample was placed in 2-mLmicrotubes containing a tungsten ball and frozen liquid nitrogen for 5 minutes. The samples were then ground into powder using a Tissue Lyger (Qiagen, Co. Ltd) at 20 vibrations per second for30 seconds. Next, 700 µL of 2 × CTAB buffer (2% CTAB, 0.1M Tris, pH 8.0, 1.4MNaCl, 1% PVP) was added to the tubes. The samples were then vortexed, after which the tubes were incubated in a water bath at 65˚C for 20 minutes. After removal from the water bath, 700 µL PCI (phenol:chloroform:isoamylalcohol = 25:24:1) was added to the tubes and shaken for 20 minutes at room temperature before centrifugation. Next, 500 µL of the supernatant was removed and placed into a new 1.5-mLmicrotube, after which 350 µL isopropanol was added. The tubes were then shaken for 5 minutes, followed by freezing at −72˚C for 2 hours. Subsequently, the samples were melted slowly and centrifuged at 14,000 rpm for 10 minutes. The was supernatant removed from each tube, and the pellet dried at room temperature after washing two times in 70% ethanol. Finally, 20 µL of distilled water was added into each tube. The concentration of genomic DNA was checked using a Nano Drop 2000 Spectrophotometer.
2.3. QTLs Analysis of Yield Relationships
Distances between markers are presented in centiMorgans (cM) using the Kosambi function with an average interval of 10.6 cM. The completed genetic map used by the Plant Molecular Breeding Laboratory at the School of Applied Biosciences at Kyungpook National University. To identify the putative QTLs, composite interval mapping was employed using WinQTL Cartographer 2.5 [20] [21] . An LOD value of 2.5 was used as the threshold for significance, claiming a QTL at p < 0.05. QTLMapper 1.6 was used to detect the main effect QTLs, epistatic interactions, and their environmental interactions with a threshold of P ≤ 0.005 [22] . The QTL locations identified in the current research were compared with previously reported QTLs affecting rice yield and related traits using a genomic database (http://gramene.org). The methods were similar to those described by [14] .
3. Results
The yield of components was summarized for the parents and 120 DH lines in 2012 (Table 1). Phenotypic transgressive and continuous variations were observed for most traits. 2012 “Nagdong” had higher values for spike lets per panicle, seed set percentage, and grain yield, while 2012 “Cheongcheong” had higher panicles per plant and 1000-grain weight. Although the parents have high grain yield, some extremely low values for grain yield were observed due to the low seed set percentage in the DH population. Frequency distributions of yield and yield components are shown using the DH population in 2012.PPP was observed to have a high frequency from 9 - 14. SPP was observed to have a high frequency from 47 - 103. SSP was observed to have a high frequency from 64% - 83% and TGW was observed to have a high frequency from 21 - 25 g. The PPP, SPP, SSP, and TGW had a normal distribution, except yield. This phenomenon was probably attributable to the origin of the progeny from sub-specific (indica-japonica) crosses. Significant correlations (P < 0.05, P < 0.01were calculated among yield and related traits in 2012 (Table 2). Yield was positively correlated with SSP, SPP, and TGW. SPP was most strongly correlated with SSP. SSP, SPP, and TGW were negatively correlated. Putative QTLs and significant QTLs detected for yield and yield components are shown in Table 3 and Figure 1, Figure 2. In 2012, a total of 9 QTLs were identified on chromosomes 2, 3, 6, and 8. In addition, 35% - 53% of the contributions to the phenotypic variations appeared when QTL were applied. PPP was identified as having three QTLs. The first was found between RM 15063 and RM15448 of chromosome 3. Another was identified between RM 148 and RM6990 of chromosome 8. The final was identified between RM23314 and RM149 of chromosome 8. The phenotypic variations of the three QTLs were 53%, 47%, and 47%.Amongthese, there was a 5.02 LOD.SPP was identified in one QTL; found on chromosomes 6. This was identified between RM527 and RM50 of chromosomes 6, with a phenotypic variation of 35%. This was a 3.14 LOD.SSP was identified in two QTLs, on chromosomes 3, and 8. One was identified between RM6931 and RM15063 of chromosome 3, and showed phenotypic variation of 40%. Another was identified between RM1235 and RM22334 of chromosome 8, and had a phenotypic variation of 36%. Among these, there was a 4.40 LOD. Yield was identified in three QTLs, on chromosomes 2 and 8. A total of two QTLs were identified on chromo some 6. Phenotypic variations were

Table 1. Analysis of yield and yield component between parents and a DH population in 2012.
PPP: panicles per plant, SPP: spikelets per panicle, SSP: seed set percentage, TGW: 1000-grain weight.
Table 2. Analysis of yield and yield component between parents and a DH population in 2012.
PPP: panicles per plant, SPP: spikelets per panicle, SSP: seed set percentage, TGW: 1000-grain weight.
Table 3. Selection of the interval markers at composite interval mapping.
PPP: panicles per plant, SPP: spikelets per panicle, SSP: seed set percentage, TGW: 1000-grain weight. -: This QTL not possessed any marker.
41% and 40%.The other was identified between RM23230 and RM23314 of chromosome 8, with a phenotypic variation of 40%. Among these, there was 4.77 LOD (Table 4).
4. Discussion
In this study, only 9 QTLs affecting yield and yield components were identified in a single year, indicating that individual QTLs are sensitive to the environment. An interval was identified on chromosome 1 between markers RZ730 and RZ801, where QTLs associated with panicle number, plant height, maximum tiller number, and flag leaf length were detected [18] . qPPP1-1 flanked by marker 1008 and RM575 was identified and qPPP3, qPPP8-1, qPPP8-2 were first reported in the present study. It was reported that a QTL for spike lets per panicle was flanked by markers RM237 and RM128 on chromo some [14] . Furthermore, they reported a QTL for spike lets per panicle was flanked by markers RM237 and RM128 on chromo some [14] . In this study, qSPP6 was detected and flanked by markers 527 and 50.A QTL-associated seed set percentage was found with peak marker RM23 on chromosome 1 by [23] . In this study, qSSP8 was detected and flanked by markers 1235 and 22334. For 1000-grain weight, qTGW3 andqTGW5, which were the most important genes for grain length and grain width in rice, respectively, were detected [24] . In this study, qTGW3 was detected and flanked by markers 12662 and 12532. It was reported by [25] that qYIELD4 is flanked by C2807 and RM252 on chromosome 4
Table 4. Coincidence of phenotype and marker type of yield characters.
PPP: panicles per plant, SPP: spikelets per panicle, SSP: seed set percentage. O: PCR expressed band of ‘Cheongcheong’ type, X: PCR expressed band of ‘Nagdong’ type, -: not amplified band by PCR.
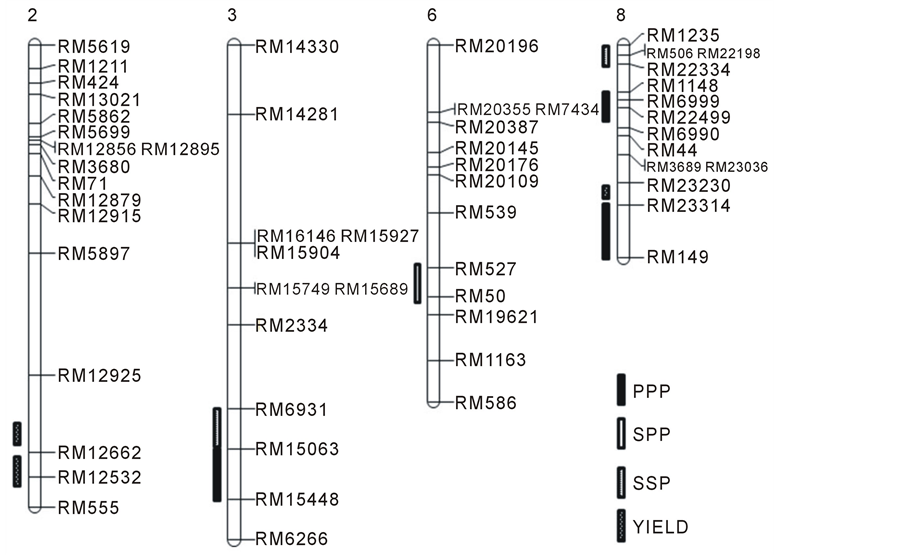
Figure 1. QTLs for yield and yield components were identified in 70 doubled haploid lines derived from a “Cheongcheong” × “Nagdong” cross. The approximate positions of centromeres are represented on the 12 chromosomes using red bars. The QTLs reported by previous studies are indicated on the right of chromosomes.PPP: panicles per plant, SPP: spikelets per panicle, SSP: seed set percentage.
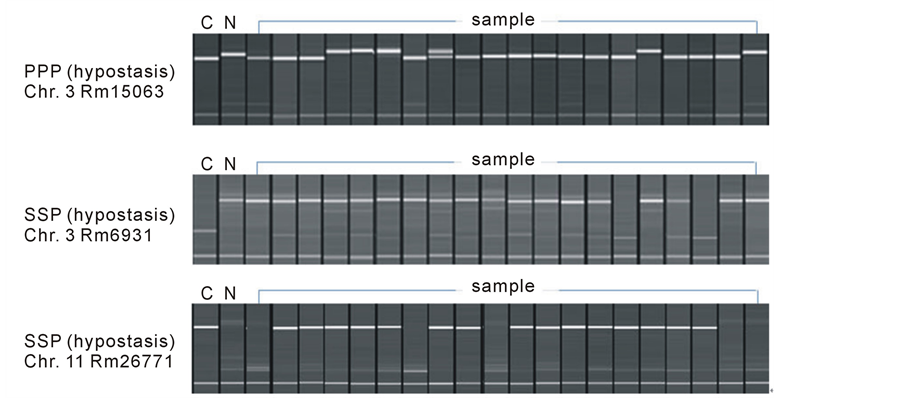
Figure 2. Coincidence of phenotype and marker typeon band. C: “Cheongcheong”, N: “Nagdong”, Sample: plants from “Cheongcheong” × “Nagdong” cross.
[9] [26] . In this study, qYIELD8 was detected and flanked by markers 23230 and 23314. Investigation of the phenotypic correlations of five traits indicated that SPP and SSP have the highest correlation.
Acknowledgements
This work was supported by a grant from the Next-Generation BioGreen 21 Program (No. PJ0080912014), Rural Development Administration, Republic of Korea. This research was supported by the Kyungpook National University Research Fund, 2013.
References
- Burr, B., Burr, F.A., Thompson, K.H., Albertson, M.C. and Stuber, C.W. (1988) Gene Mapping with Recombinant Inbreds in Maize. Genetics, 118, 519-526.
- Beavis, W.D., Grant, D., Albertsen, M. and Fincher, R. (1991) Quantitative Trait Loci for Plant Height in four Maize Populations and Their Associations with Qualitative Genetic Loci. Theoretical and Applied Genetics, 83, 141-145. http://dx.doi.org/10.1007/BF00226242
- Veldboom, L.R. and Lee, M. (1994) Molecular-Marker-Facilitated Studies of Morphological Traits in Maize. II: Determination of QTLs for Grain Yield and Yield Components. Theoretical and Applied Genetics, 89, 451-458. http://dx.doi.org/10.1007/BF00225380
- Paterson, A.H. and Lander, E.S., Hewitt, J.D., Peterson, S., Lincoln, S.E. andTanksley, S.D. (1988) Resolution of Quantitative Traits into Mendelian Factors by Using a Complete Linkage Map of Restriction Fragment Length Polymorphisms. Nature, 335, 721-726. http://dx.doi.org/10.1038/335721a0
- Tanksley, S.D. and Nelson, J.C. (1996) Advanced Backcross QTL Analysis: A Method for the Simultaneous Discovery and Transfer of Valuable QTLs from Unadapted Germplasm into Elite Breeding Lines. Theoretical and Applied Genetics, 92, 191-203. http://dx.doi.org/10.1007/BF00223376
- Frary, A., Nesbitt, T.C., Grandillo, S., Knaap, E., Cong, B., Liu, J., Meller, J., Elber, R., Alpert, K.B. and Tanksley, S.D. (2000) fw2.2: A Quantitative Trait Locus Key to the Evolution of Tomato Fruit Size. Science, 289, 85-88. http://dx.doi.org/10.1126/science.289.5476.85
- Kato, K., Miura, H. and Sawada, S. (2000) Mapping QTLs Controlling Grain Yield and Its Components on Chromosome 5A of Wheat. Theoretical and Applied Genetics, 101, 1114-1121. http://dx.doi.org/10.1007/s001220051587
- Roeder, M.I.S., Huang, X.Q. and Boerner, A. (2008) Fine Mapping of the Region on Wheat Chromosome 7D Controlling Grain Weight. Functional & Integrative Genomics, 8, 79-86. http://dx.doi.org/10.1007/s10142-007-0053-8
- Yu, S.B., Li, J.X., Xu, C.G., Tan, Y.F., Gao, Y.J., Li, X.H., Zhang, Q.F. and Saghai Maroof, M.A. (1997) Importance of Epistasis as the Genetic Basis of Heterosis in an Elite Rice Hybrid. Proceedings of the National Academy of Sciences of the United States of America, 94, 9226-9231. http://dx.doi.org/10.1073/pnas.94.17.9226
- Xing, Y.Z., Tan, Y.F., Hua, J.P., Sun, X.L., Xu, C.G. and Zhang, Q.F. (2002) Characterization of the Main Effects, Epistatic Effects and Their Environmental Interactions of QTLs on the Genetic Basis of Yield Traits in Rice. Theoretical and Applied Genetics, 105, 248-257. http://dx.doi.org/10.1007/s00122-002-0952-y
- Yoon, D.B., Kang, K.H., Kim, H.J., Ju, H.G., Kwon, S.J., Suh, J.P., Jeong, O.Y. and Ahn, S.N. (2006) Mapping Quantitative Trait Loci for Yield Components and Morphological Traits in an Advanced Backcross Population between Oryzagrandiglumis and the O. sativa Japonica Cultivar Hwaseongbyeo. Theoretical and Applied Genetics, 112, 1052- 1062. http://dx.doi.org/10.1007/s00122-006-0207-4
- McCouch, S. R. and Doerge, R. W. (1995) QTL Mapping in Rice. Trends in Genetics, 11, 482-487. http://dx.doi.org/10.1016/S0168-9525(00)89157-X
- Xiao, J., Li, J., Grandillo, S., Ahn, S.N., Yuan, L., Tanksley, S.D. and McCouch, S.R. (1998) Identification of TraitImproving Quantitative Trait Loci Alleles from a Wild Rice Relative, Oryzarufipogon. Genetics, 150, 899-909.
- Thomson, M.J., Tai, T.H., McClung, A.M., Lai, X.H., Hinga, M.E., Lobos, K.B., Xu, Y., Martinez, C.P., McCouch, S.R. (2003) Mapping Quantitative Trait Loci for Yield, Yield Components and Morphological Traits in an Advanced Backcross Population between Oryzarufipogon and the Oryza Sativa Cultivar Jefferson. Theoretical and Applied Genetics, 107, 479-493. http://dx.doi.org/10.1007/s00122-003-1270-8
- Ashikari, M., Sakakibara, H., Lin, S., Yamamoto, T., Takashi, T., Nishimura, A., Angeles, E.R., Qian, Q., Kitano, H. and Matsuoka, M. (2005) Cytokinin Oxidase Regulates Rice Grain Production. Science, 309, 741-745. http://dx.doi.org/10.1126/science.1113373
- Fasoulas, A.C. and Allard, R.W. (1962) Nonallelic Gene Interactions in the Inheritance of Quantitative Characters in Barley. Genetics, 47, 899-907.
- Paterson, A., Damon, S., Hewitt, J., Zamir, D., Rabinowitch, H., Lincoln, S., Lander, E. and Tanksley, S.D. (1991) Mendelian Factors Underlying Quantitative Traits in Tomato: Comparison across Species, Generations, and Environments. Genetics, 127, 181-197.
- Zhuang, J.Y., Lin, H.X., Lu, J., Qian, H.R., Hittalmani, S., Huang, N. and Zheng, K.L. (1997) Analysis of QTL × Environment Interaction for Yield components and Plant Height in Rice. Theoretical and Applied Genetics, 779, 799-808. http://dx.doi.org/10.1007/s001220050628
- Campbell, B.T., Baenziger, P.S., Gill, K.S., Eskridge, K.M., Budak, H., Erayman, M., Dweikat, I. and Yen, Y. (2003) Identification of QTLs and Environmental Interactions Associated with Agronomic Traits on Chromosome 3A of Wheat. Crop Science, 43, 1493-1505. http://dx.doi.org/10.2135/cropsci2003.1493
- Zeng, Z.B. (1994) Precision Mapping of Quantitative Trait Loci. Genetics, 136, 1457-1468.
- Basten, C.J., Weir, B.S. and Zeng, Z.B. (2005) QTL Cartographer. Version 1.17.
- Wang, D.L., Zhu, J., Li, Z.K. and Paterson, A.H. (1999) Mapping QTLs with Epistatic Effects and QTL × Environment Interactions by Mixed Linear Model Approaches. Theoretical and Applied Genetics, 99, 1255-1264. http://dx.doi.org/10.1007/s001220051331
- Tan, L.B., Zhang, P.J., Liu, F.X., Wang, G.J., Ye, S., Zhu, Z.F., Fu, Y.C., Cai, H.W. and Sun, C.Q. (2008) Quantitative Trait Loci Underlying Domesticationand Yield-Related Traits in an Oryzasativa × Oryzarufipogon Advanced Backcross Population. Genome, 51, 692-704. http://dx.doi.org/10.1139/G08-054
- Zhang, Z.H., Li, P., Wang, L.X., Hu, Z.L., Zhu, L.H. and Zhu, Y.G. (2004) Genetic Dissection of the Relationships of Biomass Production and Partitioning with Yield and Yield Related Traits in Rice. Plant Science, 167, 1-8. http://dx.doi.org/10.1016/j.plantsci.2004.01.007
- You, A., Lu, X., Jin, H., Ren, X., Liu, K., Yang, G., Yang, H., Zhu, L. and He, G. (2006) Identification of Quantitative Trait Loci across Recombinant Inbred Lines and Testcross Populations for Traits of Agronomic Importance in Rice. Genetics, 172, 1287-1300. http://dx.doi.org/10.1534/genetics.105.047209
NOTES

*Corresponding author.