Pharmacology & Pharmacy
Vol.4 No.1(2013), Article ID:27002,6 pages DOI:10.4236/pp.2013.41006
Antioxidant Properties and Chemical Composition Relationship of Europeans and Brazilians Propolis
![]()
1Department of Molecular Sciences and Nanosystems, University Ca’ Foscari of Venice, Venice, Italy; 2Depatment of Biotechnology and Bioecology, Astrakhan State University (ASU), Astrakan, Russia; 3Institute for the Dynamics of Environmental Processes, CNR, University Ca’ Foscari of Venice, Venice, Italy; 4Department of Environmental Sciences, Informatics and Statistics, University Ca’ Foscari of Venice, Venice, Italy; 5Institute of Biosciences, São Paulo State University, Botucatu, Brazil.
Email: *roberto.stevanato@unive.it
Received October 24th, 2012; revised November 30th, 2012; accepted December 16th, 2012
Keywords: Propolis; Antioxidant Properties; Chemical Composition
ABSTRACT
The antioxidant activity of ethanol extracts of propolis, bee glue, of various climate and orographic characteristics, collected from Italy, Brazil and Russia, was evaluated measuring their inhibitory action on peroxidation of linoleic acid, radical scavenging ability towards 2,2’-diphenyl-1-picrylhydrazyl, total phenolic content and reducing capacity by enzymatic and Folin method respectively. Propolis samples were chemically characterized by HPLC-MS/MS in order to find a possible correlation between antioxidant activity and polyphenols composition and quantification. The results obtained indicate that Italian and Russian propolis samples have similar polyphenolic composition and, as a consequence, almost similar antioxidant activity, while Brazilian propolis evidence lower polyphenolic and antioxidant characteristics. Climate and orography reasons of these differences are also suggested.
1. Introduction
Propolis (bee glue, CAS No. 9009-62-5) is a resinous natural product collected by honeybees from various plant sources, characterized by antiseptic, antimycotic, bacteriostatic, astringent, spasmolytic, anti-inflammatory, anaesthetic and antioxidant properties [1-3].
The chemical composition of propolis (polyphenols, terpenoids, steroids and amino acids contents) can be very different, depending on the place of collection [4,5] and, in particular, on the composition of the plant source.
In continental Europe, Populus nigra, the black poplar, is the source of choice for bees; in Russia, especially in northern parts, is Betula verrucosa [6], while in South America is Hyptis divaricata and Baccharis dracunculifolia [7].
Particularly interesting is propolis from Brazil for the vast biodiversity of the country [8]; within the Brazilian territory, which includes temperate, subtropical and tropical zones, 12 different types of propolis have been classified, depending on their composition and botanical origin: five from the south, six from the northeast and one from the south-east named propolis “green” [7].
As a consequence, propolis samples from Europe and Brazil have different chemical composition [9]; in particular, flavonoids and phenolic acid esters are the main components of European propolis, representing about 10% - 15% of the weight [10,11], while in Brazilian propolis the major components are terpenoids and prenylated derivatives of p-coumaric acids, being flavonoids and phenolic acid esters amount < 4%, [1,12,13].
Despite the different composition, the two types of propolis have very similar pharmacological properties, so that some studies suggested that other compounds other than flavonoids, as aromatic acids contained in high amount, could be responsible for the antifungal effects [8].
On the contrary, few studies report the antioxidant activity of Brazilian propolis and only one [14] compares propolis originating from temperate and tropical zones.
It appears therefore attractive to verify if a reduced presence of flavonoids matches a lower antioxidant activity or whether, as it happens with other properties, different compounds become substitutes for flavonoids in their action against free radicals.
The purpose of this study is to compare the antioxidant activity of propolis from Europe and Brazil, to relate it to their chemical composition and to individuate the species responsible of antioxidant capacity.
From European propolis we focalized our attention on some Italian and Russian samples. These last are of particular interest because picked in sites with a vast biodiversity and because their composition and antioxidant activity are unknown in literature.
We consider only one kind of Italian propolis, because as seen in a previous work [11] they are quite similar for chemical composition, UV spectra and antioxidant activity.
For the lack of a universal and unique method to determine the antioxidant activity of a compound, we studied the inhibitory action of propolis on lipid peroxidation of linoleic acid (LA) which, in our opinion, mimes better than other methods the efficacy of an antioxidant compound to prevent oxidative damages on lipoproteins or cell membrane by ROS injures. Then the results were compared with the radical scavenging ability towards 2,2’-diphenyl-1-picrylhydrazyl (DPPH method), the reducing capacity by the Folin Ciocalteu assay and the total phenolic content using the enzymatic method [15].
2. Experimental
2.1. Material
Raw native propolis was obtained directly from beekeepers and conserved in closed vessels at 3˚C to prevent natural oxidation.
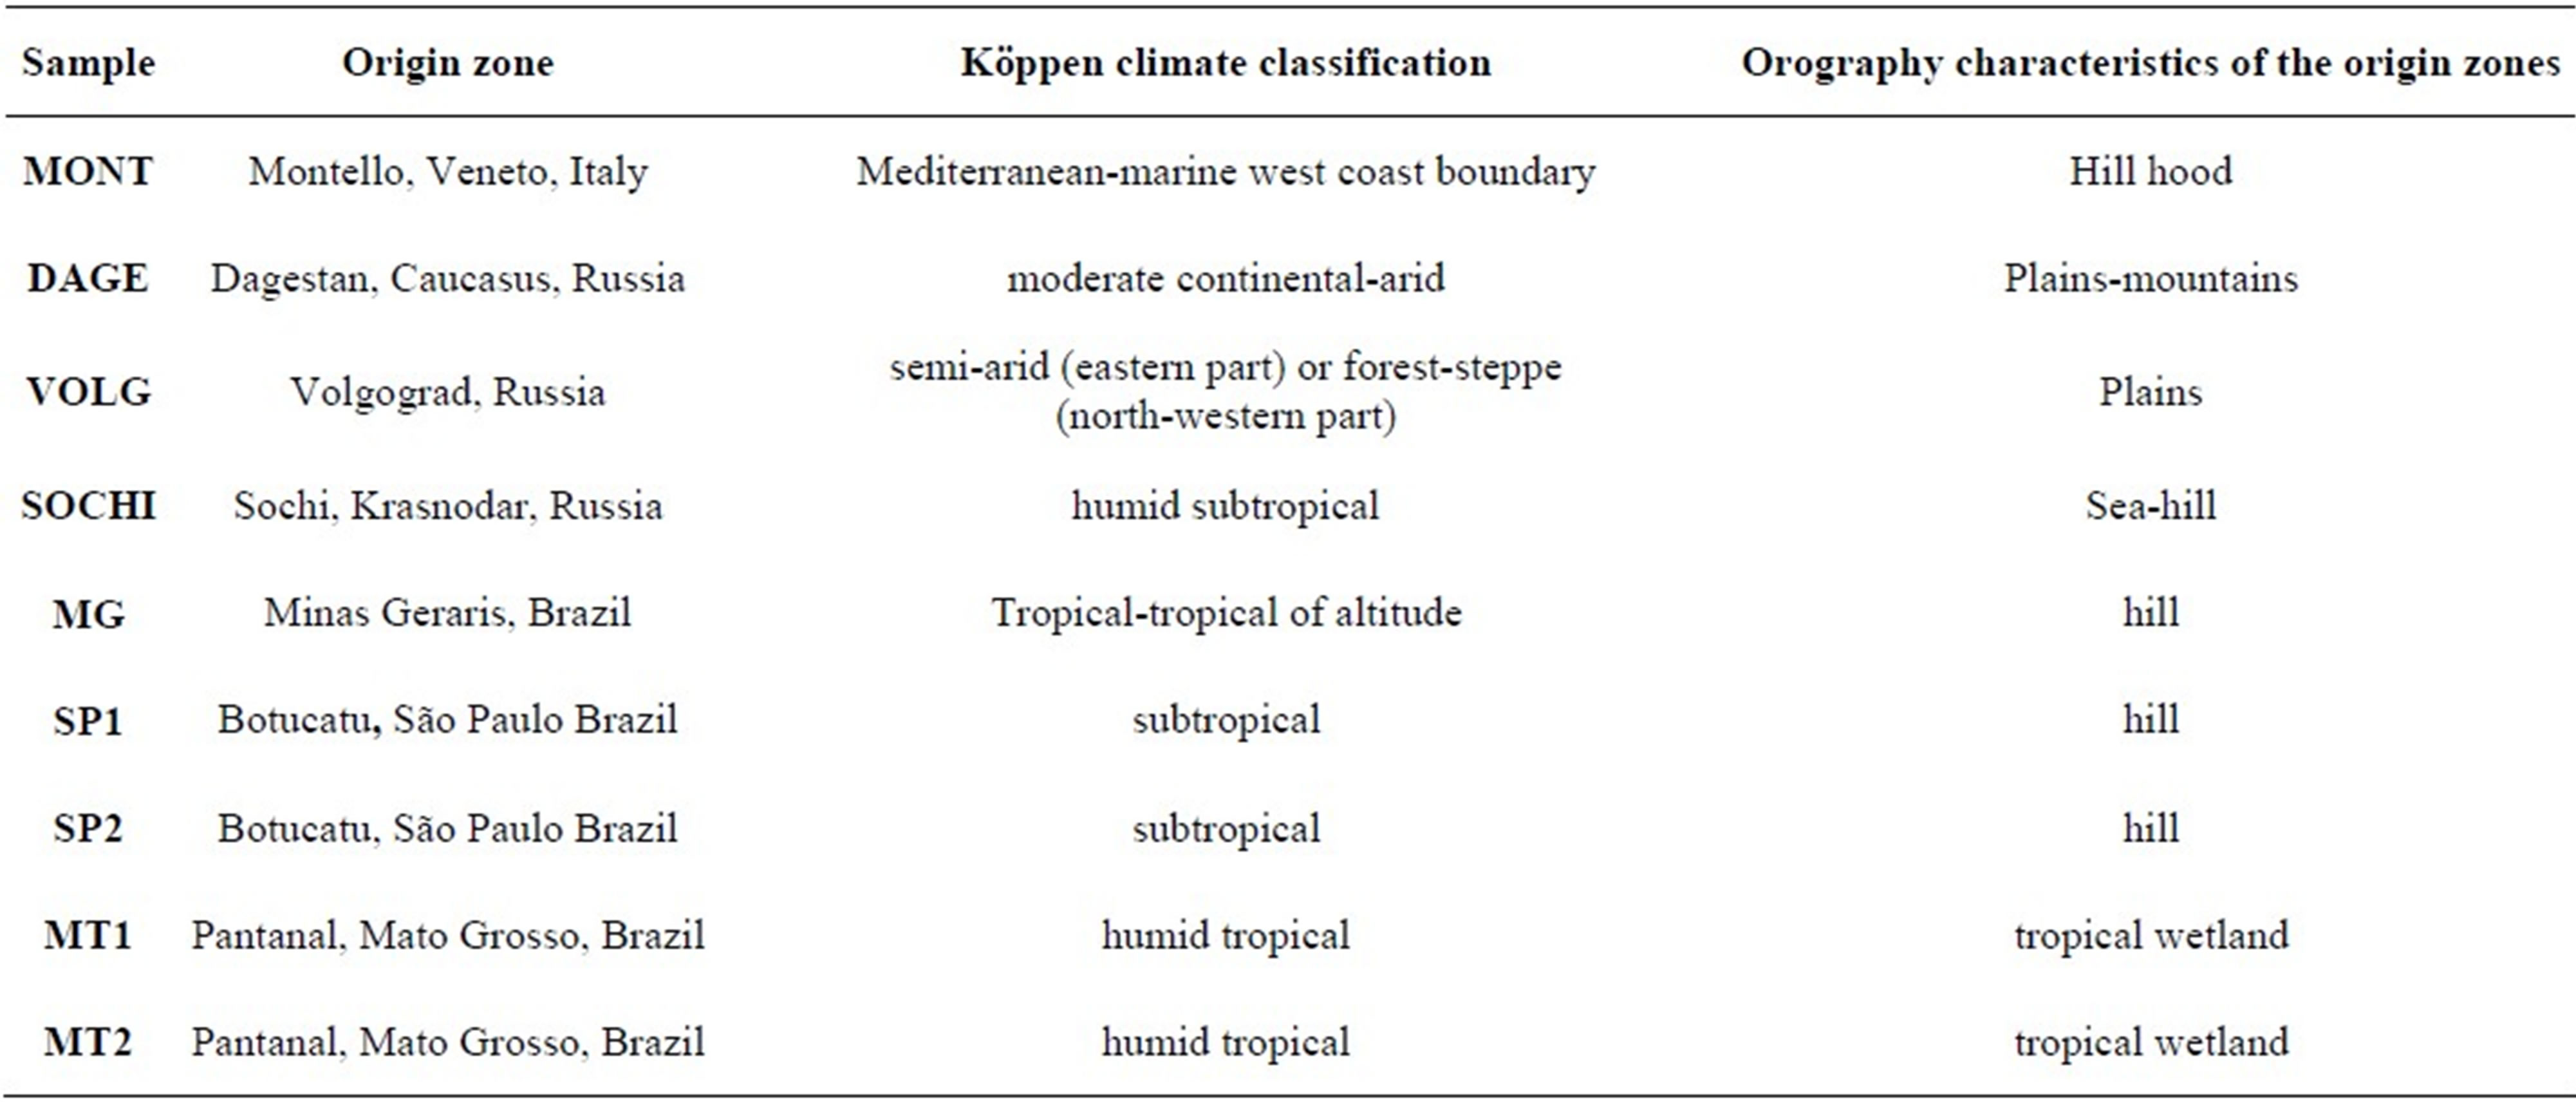
Italian propolis comes from Montello hill hood, located in the Veneto region, at the boundary between Padana plain and Alpi mountains. The three Russian propolis comes from Sochi, a city situated on the shores of the Black Sea, near the Caucasus mountains; Volgograd, a city of the European Russia, along the Volga River; Dagestan, a Republic located in the North Caucasus mountains and bordered on its eastern side by the Caspian Sea.
Brazilian propolis are collected in Pantanal, a tropical wetland in the state of Mato Grosso; Botucatu, a city in the southeastern region of Brazil located in the State of São Paulo; “green” propolis was from Minas Gerais, a state in the west of the southeastern subdivision of Brazil.
Köppen climate classification and the orography characteristics of the origin zones are reported in Table 1.
All experiments were repeated at least in triplicate and carried out in different times.
2.2. Chemicals
All chemicals were analytical grade and were supplied from Sigma Chemical Co. (USA) or Romil Ltd. for HPLC-MS/MS measurements. ABIP (2,2’-azobis[2’-(2- imodazolin-2-yl)propane] dihydrochloride) was obtained from Wako Chemicals (Germany). The aqueous solutions were prepared with quality milliQ water.
2.3. Preparation of Ethanolic Extract of Propolis
Ethanolic extract of propolis (EEP) was obtained dissolving raw propolis samples overnight under vigorous agitation at 3˚C. After filtration through a strainer to remove insoluble residual beehive products, i.e. wood fragments, bee bodies, etc., the suspension was left to sediment and the supernatant was centrifuged for 30 min at 2000 rpm. Limpid solution, without further purifications, was used for successive analyses. Solution concentration was calculated weighting dry residue after complete evaporation of all solvent until dryness.
Table 1. Köppen climate classification and Orography characteristics of the origin zones.
2.4. UV Measurements
Spectrophotometric measurements were recorded on a UV-VIS Shimadzu UV-1800 instrument equipped with a temperature controlled quartz cell. Specific absorbance  of each EEP sample was obtained according to the method of Miyataka [16].
2.5. Inhibition of Lipid Peroxidation (ILP)
The antioxidant activity of propolis to prevent linoleic acid (LA) peroxidation was studied in sodium dodecyl sulfate (SDS) micelles. As previously reported [17], the propolis antioxidant capacity was calculated as the antioxidant concentration (mg/L) that halves the rate of oxygen consumption due to the peroxidation process and it is expressed as inhibitory concentration (IC50).
2.6. DPPH (2,2-Diphenyl-1-picrylhydrazyl) Radical Scavenging Capacity Assay
This method is based on the capacity of an antioxidant to scavenge the stable free radical DPPH [18]. The procedure is reported in Stevanato [15] and the results are expressed as catechin equivalent (CE).
2.7. Folin Ciocalteu Assay and Total Phenolics Content (TPC)
The Folin Ciocalteu assay and the Total Phenolic Content determination by enzymatic method were carried out spectrophotometrically, according to the procedures previously described [15] and the results are expressed as catechin equivalent (CE).
2.8. Electrochemical Measurements
The measures of oxygen consumption were performed by a potentiostat Amel 559, equipped with an oxygen microelectrode Microelectrodes MI-730.
2.9. HPLC-MS/MS Measurements
High performance liquid chromatography with triple quadrupole mass spectrometry detection (HPLC/(-)ESI-MS/MS) was used to identify the constituents of propolis. HPLC analyses of ethanolic extracts of propolis (EEP), diluted with methanol and filtered with a 0.45 μm filter, were carried out by an Agilent 1100 HPLC system (Agilent Technologies, USA). For the chromatographic analysis, 5 μl of the sample were injected onto a C18 Synergy Hydro-RP 80A column (50 × 2 mm, 4 μm particle size) using an Aqua C18 125A pre-column (2 mm i.d. × 4 mm length). The mobile phase was acetic acid 0.1% (A) and MeOH (B). The gradient was: 10% - 90% B (2 min), 90% - 97% B (2 - 9 min), 97% - 100% B (9 - 10 min), 100% B (10 - 15 min) at a flow rate of 250 μl/min. An API 4000 triple quadrupole mass spectrometer (Applied Biosystems/MDS SCIEX, Toronto, Canada) equipped with a Turbo VTM source was used to detect polyphenols in propolis. Calibration curves of peak area versus analyte concentration were plotted for the studied polyphenols using the standard addition technique [19]. All data were acquired in negative ionization mode by multiple reaction monitoring (MRM).
3. Results and Discussion
3.1. UV Spectra and Specific Absorbance
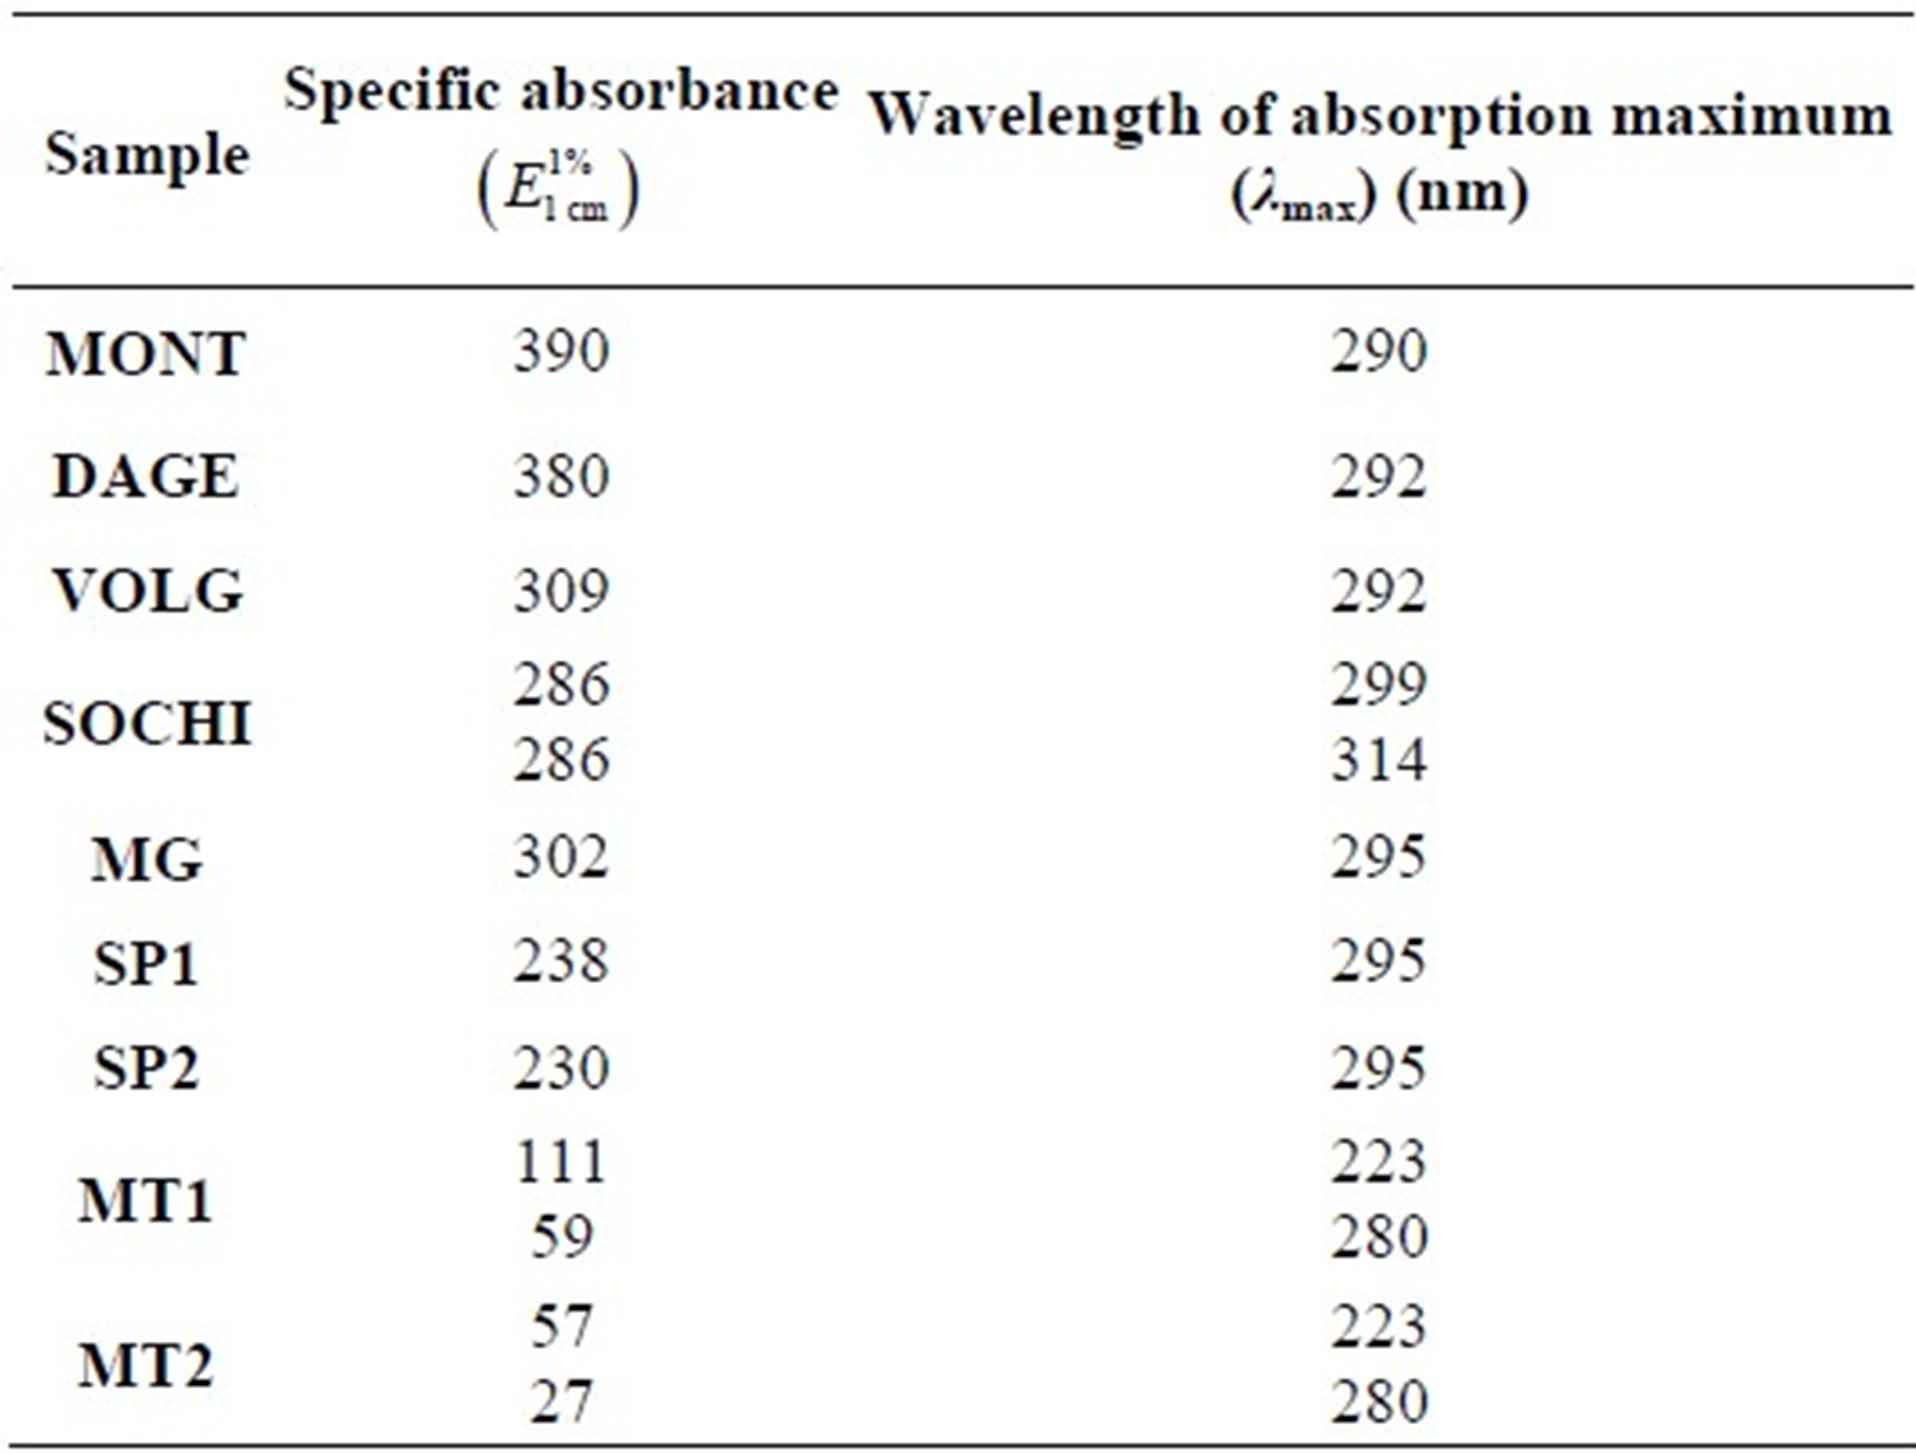
Figure 1 shows the absorbance spectra of equal concentrations of different EEP samples; in Table 2, the specific absorbances  at the wavelength of absorption maximum (λmax) are also reported.
As previously reported, Italian propolis shows a strong absorption in the region between 250 and 400 nm, with a very intense peak at 290 nm and a shoulder between 320 and 330 nm. This profile is compatible with that of the flavonoids, which generally show a first maximum between 240 and 285 nm, due to absorption of the ring A, and another maximum, of variable position, above 300 nm, depending on the substitution and conjugation of ring C [20]. The spectrum is characterized by a very high

Figure 1. Absorption spectra of EEP samples. Concentration of all samples was 30 mg/L.
Table 2. Specific absorbance  and wavelength of absorption maximum (λmax) of EEP samples.
specific absorbance, higher than that of propolis from other countries, reported here and above [14].
The UV spectra of Russian propolis are quite similar to Italian one, excluding SOCHI sample which shows two peaks with the same intensity at 299 and 314 nm, apparently similar, for profile and intensity, to the spectra of MG and SP Brazilian samples. In particular, DAGE sample has a specific absorbance close to Italian one, while VOLG appears smaller.
The UV spectra of Brazilian propolis are different: all show an absorption of ultraviolet radiation between 250 and 400 nm, but the samples MG, SP1 and SP2 have at all the wavelengths absorbance values substantially high, with a well defined peak at 295 nm and a shoulder at 315 nm; MT1 and MT2 samples, instead, have a different profile of lower intensity, with a peak around 280 nm and a shoulder at 325 nm. In the first analysis, we can therefore hypothesize that among the five samples, two different types of propolis can be individualized.
By a general comparison, it emerges that MONT and DAGE samples show similar profile and specific absorbance, while VOLG appears of lower absorbance intensity; MG and SP are comparable, but the first has higher specific absorbance; SOCHI has specific absorbance comparable to VOLG but shows two peaks of equal intensity instead of a peak and a shoulder; MT samples show different profiles and a much lower molar absorbance (about 10% of the Italian one). These lower absorbance values recorded in the range 250 - 400 nm indicate a significant lower content of flavonoids, taking into account that flavonoids absorb in this wavelength range.
3.2. Antioxidant Capacity
The graph of Figure 2, where the lipid peroxidation inhibition property of propolis samples, expressed as IC50,
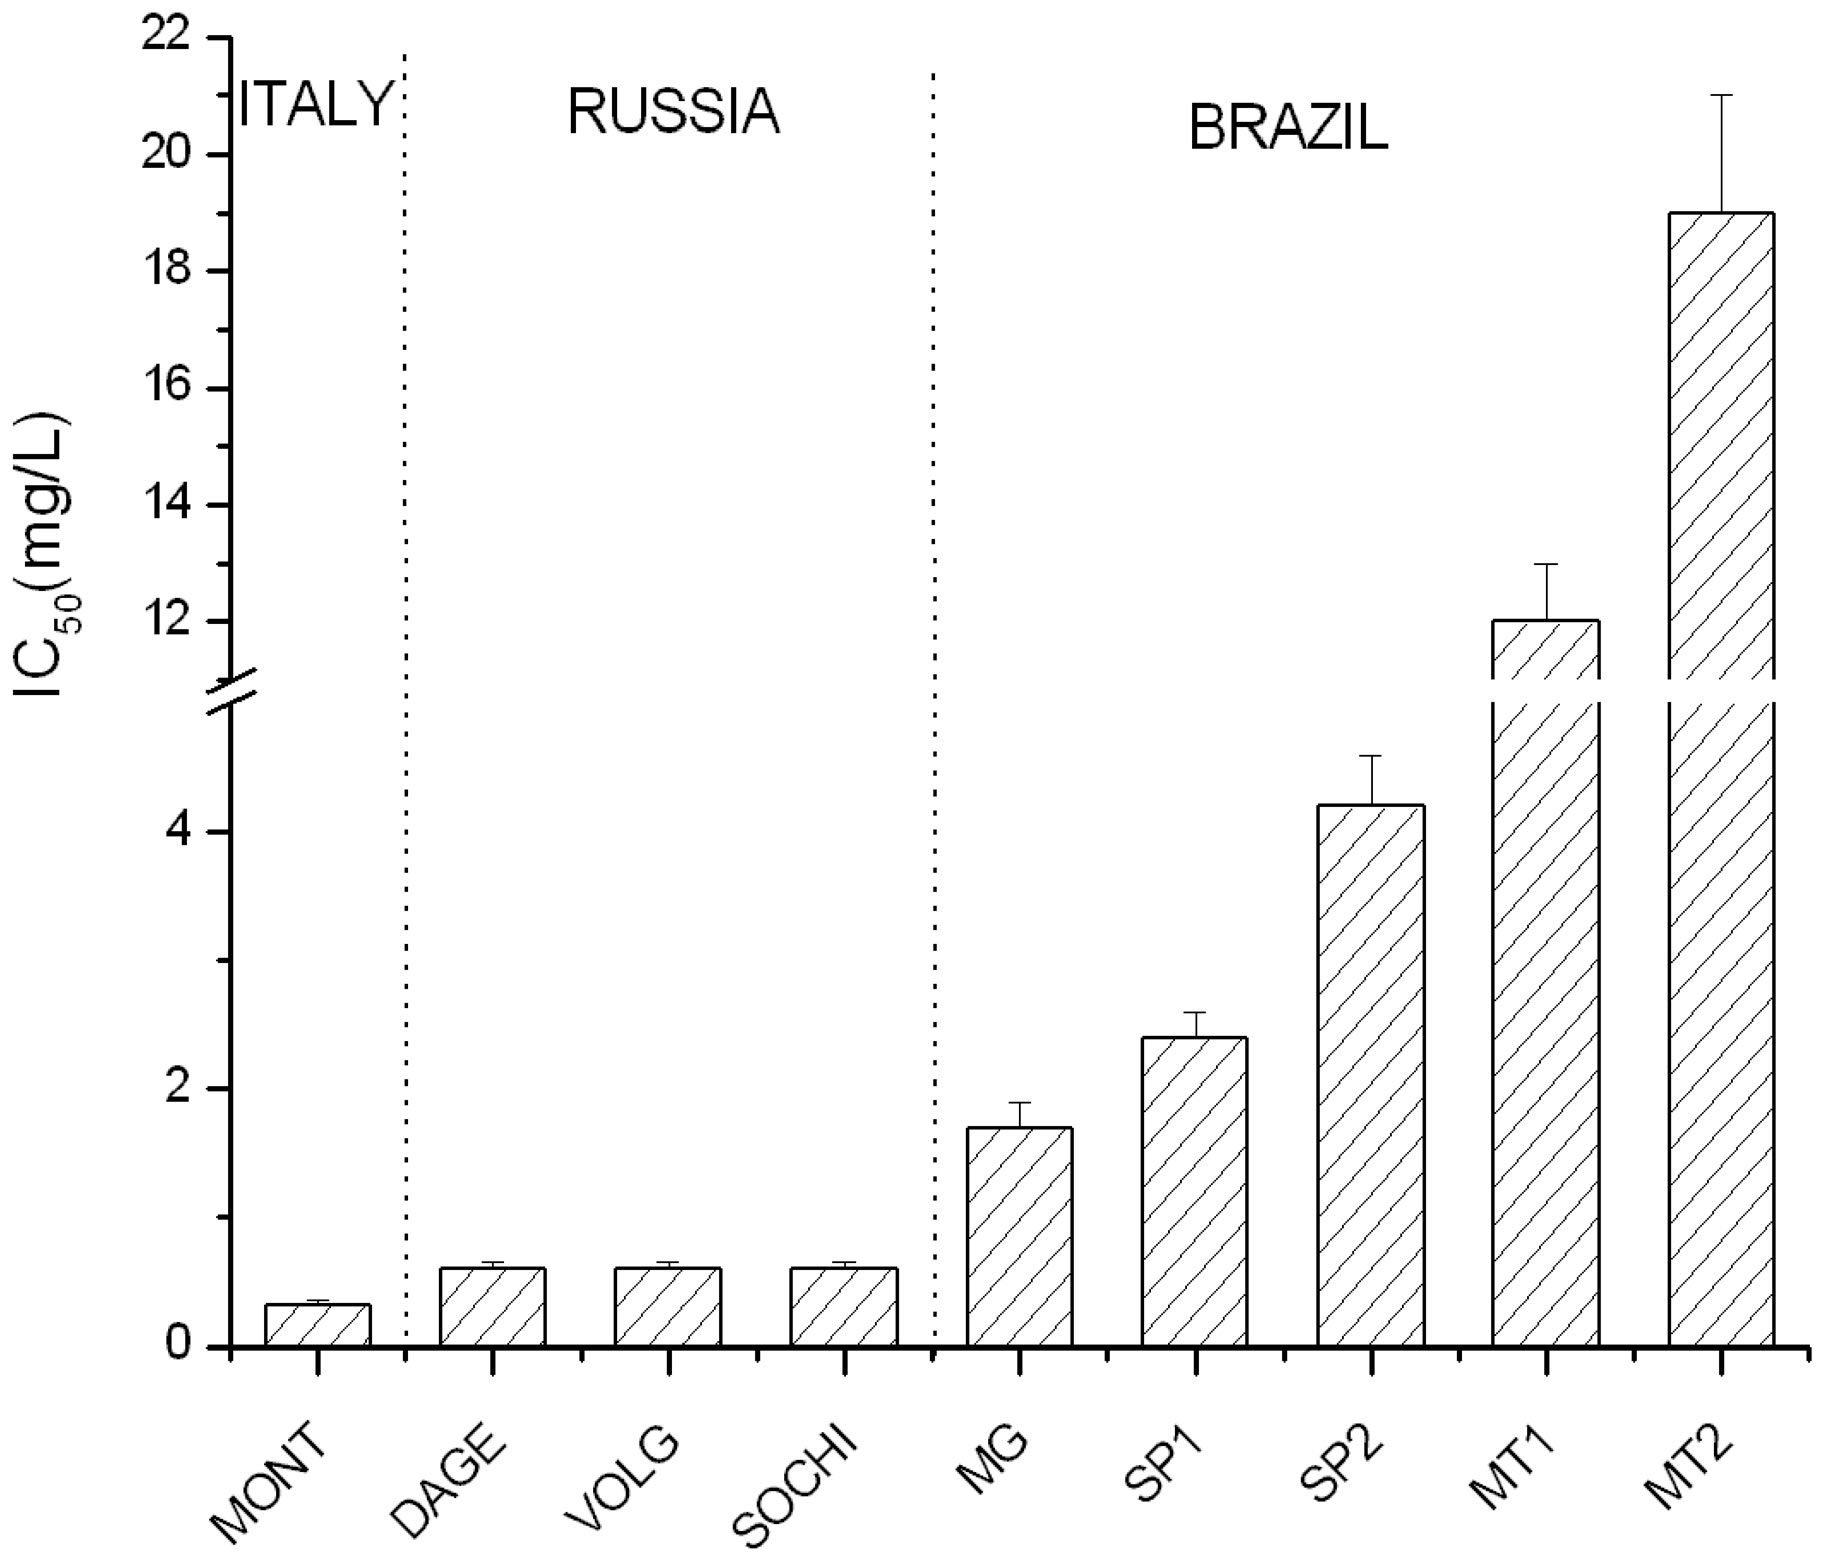
Figure 2. IC50 (50% inhibitory concentration) values of lipid peroxidation inhibition of examined EEP samples.
is reported, evidences completely different behavior between European and Brazilian propolis. In fact, Italian and Russian propolis show similar values characterized by high antioxidant capacity (IC50 < 1 mg/L) if compared to the Brazilian ones, which IC50 values (from about 2 to 20 mg/L) range between 4 to 40 times higher than the average of European samples.
In particular, while IC50 values of Italian and Russian propolis are comparable (0.3 - 0.6 mg/L), Brazilian samples display high variability: propolis from the Pantanal (MT1 and MT2) differs from the other because of its high IC50 (12 - 19 mg/L), followed by samples from São Paulo characterized by an intermediate IC50 values (2.4 - 4.2 mg/L). Among these, green propolis (MG) seems to possess a higher antioxidant activity (1.7 mg/L), but not so different from SP samples and, in any case, about four times lower than European propolis.
These results are in agreement with specific absorbance data, according to considerations previously reported [11]: a propolis of greater specific absorbance matches a greater antioxidant activity; as a consequence, ![]() can be considered a preliminary method to test the antioxidant activity of EEP.
can be considered a preliminary method to test the antioxidant activity of EEP.
From Figure 3, where the results of Folin, enzymatic and DPPH assays are reported, it appears that data obtained with DPPH and enzymatic method are comparable and in agreement with lipid peroxidation results and substantiate the different antioxidant activity between European and Brazilian propolis. On the contrary, no significant difference between European and Brazilian samples is observed using Folin assay, confirming the a-specificity of this method [21].
3.3. HPLC/MS Measurements
The concentration of main polyphenolic components of

Figure 3. CE (catechin equivalent) values of examined EEP samples obtained by DPPH, enzymatic (TPC) and Folin assays.
EEP samples obtained with HPLC/MS spectrometry is reported in Figure 4. The graph shows a marked difference between the polyphenols concentration of European and Brazilian propolis: the average concentration of polyphenols of Italian and Russian propolis is comparable (with the exception of SOCHI sample), while that of the Brazilian one is at least one magnitude order times lower (see the different y-axis scale).
In the Italian propolis, chrysin and pinocembrin are present in high concentration (≥40 mg/g propolis), followed by galangin, CAPE (caffeic acid phenethyl ester), caffeic acid, and DMAC (1,1-dimethylallylcaffeate), all ranging from 7 to 18 mg/g propolis approximately, and with very low amounts, from 1 to 3 mg/g propolis, of remaining polyphenols.
In the Russian propolis, DAGE sample shows highest polyphenols concentration, followed by VOLG, while SOCHI sample shows concentrations at least a magnitude order lower. In DAGE sample, galangin and pinocembrin concentrations appear similar (»60 mg/g propolis), such as DMAC and chrysin (»40 mg/g propolis), while caffeic acid concentration is similar to that of Montello sample.
Volgrad and Montello samples show comparable chemical composition. As previously found [11], chrysin and pinocembrin are characterized by low antioxidant activeity, so the antioxidant activity of European propolis is due above all to galangin, CAPE, caffeic acid and DMAC.
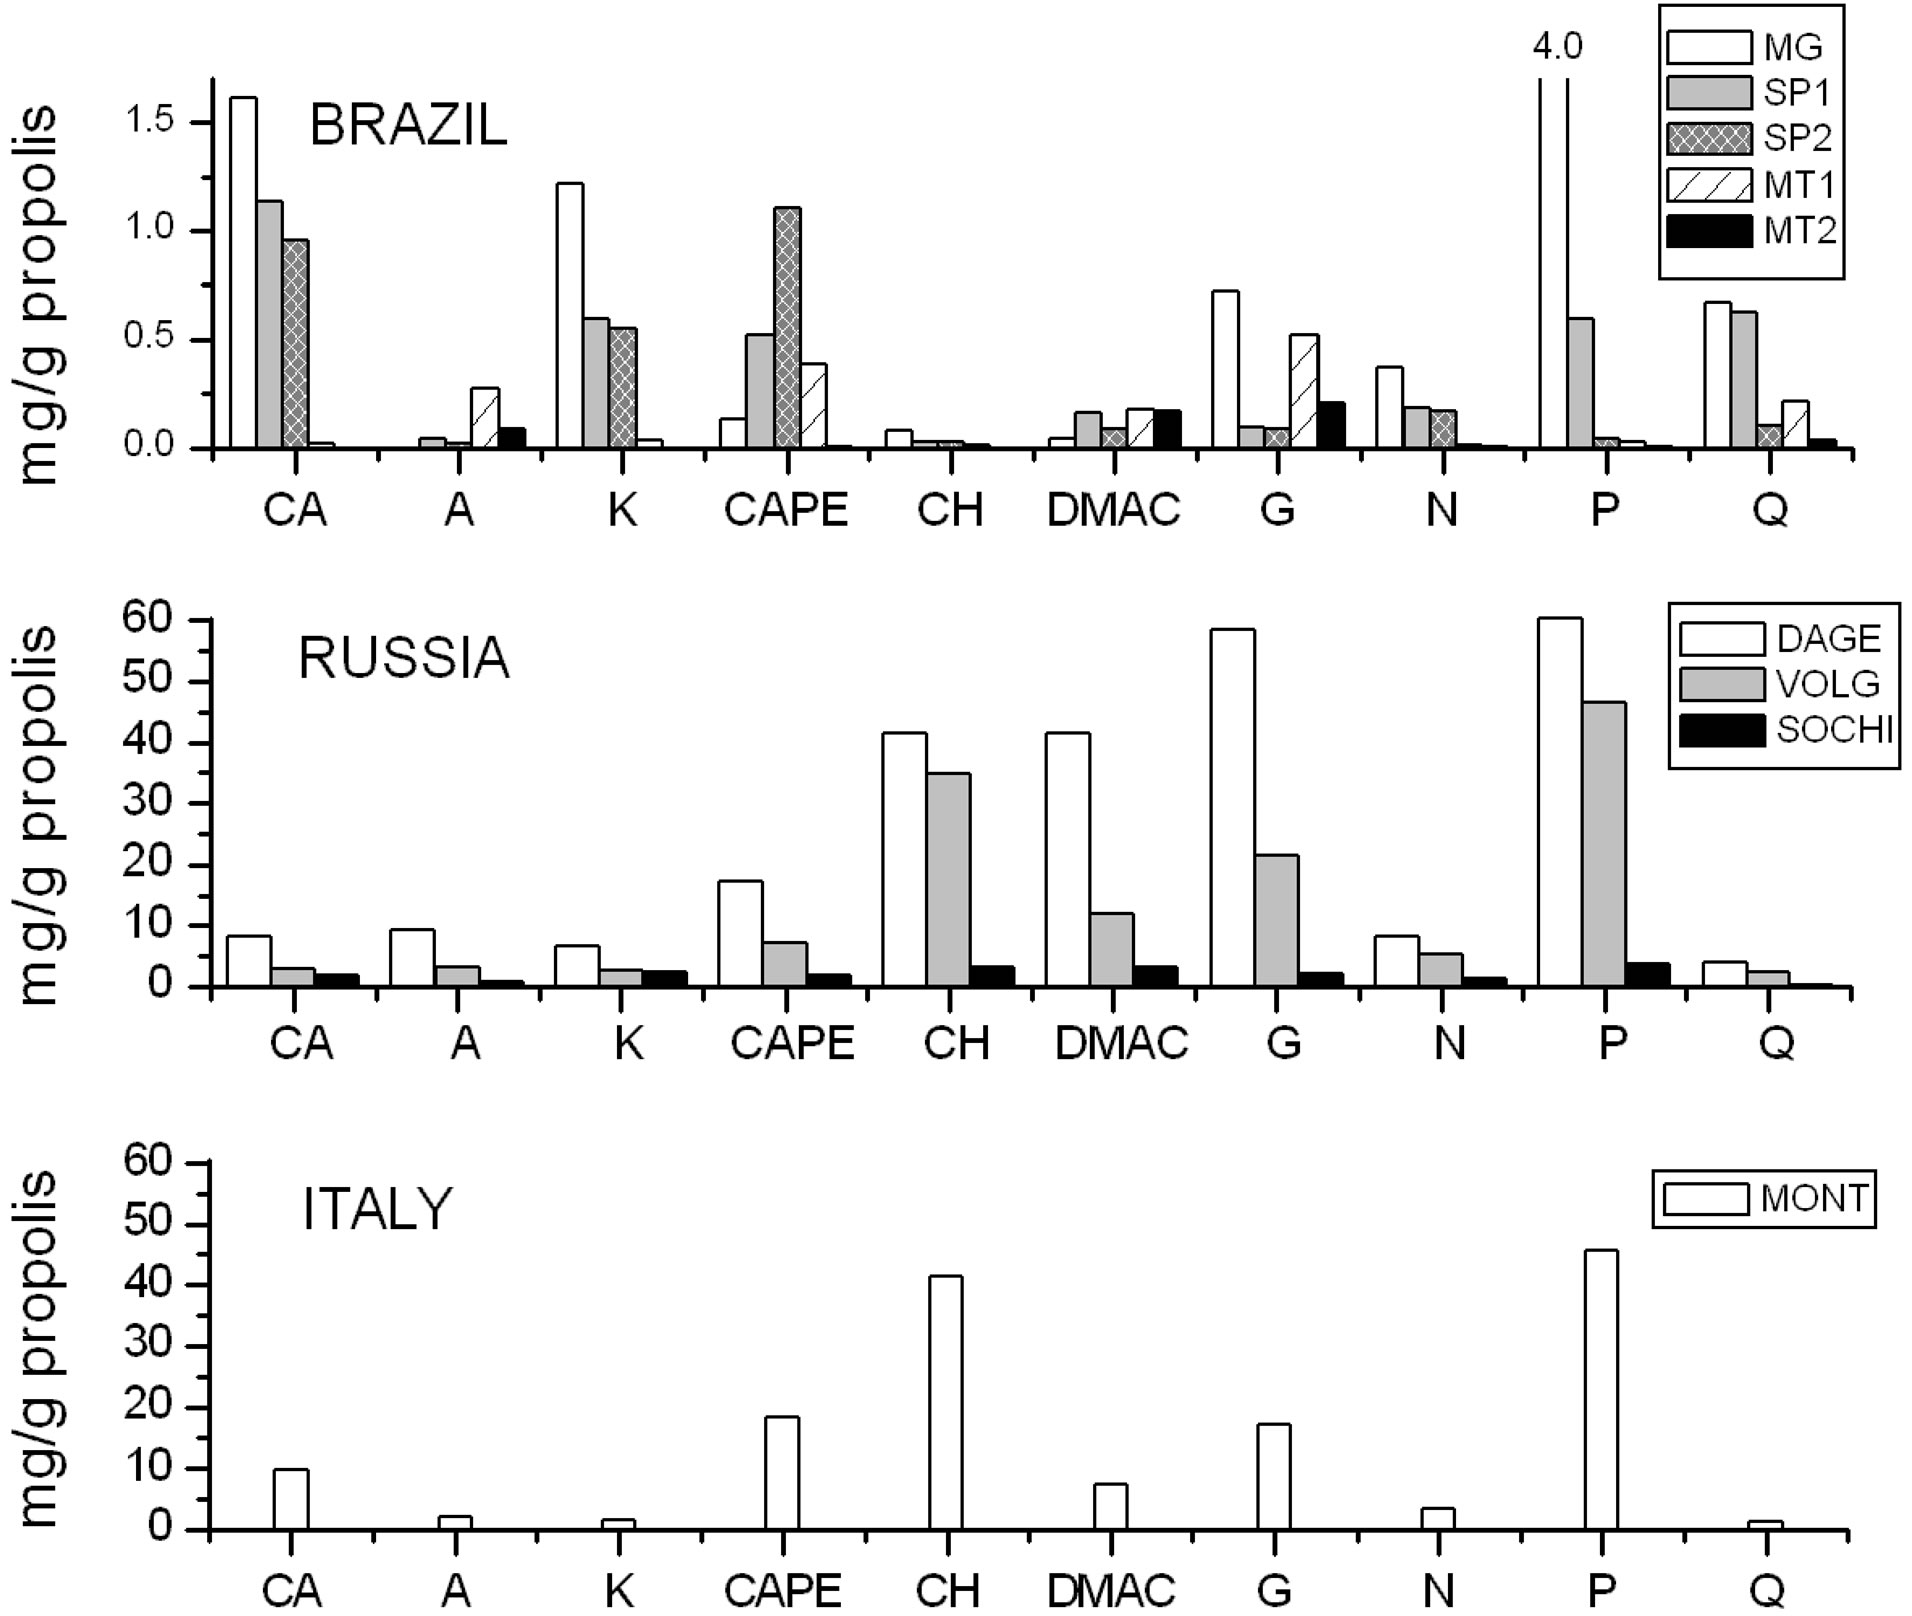
Figure 4. Concentration of main polyphenolic compounds of EEP samples obtained with HPLC/MS. CA: caffeic acid, A: apigenin, K: kaempferol, CAPE: caffeic acid phenylethyl ester, CH: crysin, DMAC: 1,1-dimethylallylcaffeate, G: galangin, N: naringenin, P: pinocembrin, Q: quercetin.
On the basis of their chemical composition, the Brazilian propolis can be divided ideally into three classes which correspond, as expected, to their origin zone.
The propolis containing the largest amount of total polyphenols comes from Minas Gerais, followed by São Paulo’s samples, while Mato Grosso samples show very low total polyphenols concentrations.
With regard to the individual polyphenols found, singularly Minas Gerais sample shows a peak of pinocembrin (»4 mg/g propolis) and significant amounts of caffeic acid, kaempferol, galangin and quercetin (0.7 - 1.6 mg/g propolis); the São Paulo’s samples contain mainly caffeic acid (»1 mg/g propolis), kaempferol and CAPE (»0.6 mg/g propolis), with, in the case of the SP1sample, also non-negligible amount of pinocembrin and quercetin (»0.6 mg/g propolis) have been found. The Mato Grosso samples contain mainly apigenin, galangin and DMAC (0.2 - 0.5 mg/g propolis) and in the case of MT1, a significant amount of CAPE and quercetin (0.2 - 0.5 mg/g propolis).
These samples differ from each other not only for the total amount of polyphenols content, but also for the relationships between the individual related polyphenols, contrary to what found for the Italian propolis [11]. These difference are linked to the very high biodiversity of Brazilian territory, where different types of plants containing different chemical compounds are present.
With regard to the European Propolis, conversely, since the chemical composition of Dagestan and Volgograd is comparable to that of Montello, we can assume that in these Russian area the main plant source is Populus nigra and not Betula verrucosa as reported for North Russia, while a different source can be hypothesized for propolis from Sochi, that shows chemical composition and UV-VIS spectrum more similar to that of São Paulo. This can be explained with the subtropical climate of Sochi, more similar to that of São Paulo rather than to that other part of Russia. As a consequence, the plant sources of Sochi’s propolis could be more similar to that of São Paulo. However Sochi sample shows antioxidant activity higher than that of all Brazilian propolis and comparable to that of other European propolis; in this case, perhaps, other compounds, different from analyzed polyphenols, could be responsible of its antioxidant activity.
In the case of other samples, conversely, there is a good agreement between concentrations of the various polyphenols found with HPLC-MS/MS analysis and results of antioxidant property and specific absorbance: to a higher content of polyphenols corresponds a higher absorbance value and a higher antioxidant power. This means that for all samples, with the only exception of that from Sochi, the antioxidant activity is due to analyzed polyphenols. At last, Sochi sample needs more thorough investigation in order to clarify the chemical composition reasons of its high antioxidant activity.
REFERENCES
- M. C. Marcucci and V. Bankova, “Chemical Composition, Plant Origin and Biological Activity of Brazilian Propolis,” Current Topics in Phytochemistry, Vol. 2, 1999, pp. 115-123.
- G. A. Burdock, “Review of the Biological Properties and Toxicity of Bee Propolis,” Food and Chemical Toxicology, Vol. 36, No. 4, 1998, pp. 347-363. doi:10.1016/S0278-6915(97)00145-2
- A. H. Banskota, Y. Tezuka and S. Kadota, “Recent Progress in Pharmacological Research of Propolis,” Phytotherapy Research, Vol. 15, No. 7, 2001, pp. 561-571. doi:10.1002/ptr.1029
- E. L. Ghisalberti, P. R. Jefferies, R. Lanteri and J. Matisons, “Constituents of Propolis,” Experientia, Vol. 34, No. 2, 1978, pp. 157-158. doi:10.1007/BF01944648
- V. Bankova, A. Dyulgerov, S. Popov, L. Evstatieva, L. Kuleva, O. Pureb and Z. Zamjansan, “Propolis Produced in Bulgaria and Mongolia: Phenolic Compounds and Plant Origin,” Apidologie, Vol. 23, No. 1, 1992, pp. 79-85. doi:10.1051/apido:19920109
- S. A. Popravko and M. V. Sokolov, “Plant Sources of Propolis,” Pchelovodstvo, Vol. 2, 1980, pp. 28-29.
- Y. K. Park, S. M. Alencar, C. L. Aguiar, “Botanical Origin and Chemical Composition of Brazilian Propolis,” Journal of Agricolture and Food Chemistry, Vol. 50, No. 9, 2002, pp. 2502-2506. doi:10.1021/jf011432b
- K. Salomão, A. P. Dantas, C. M. Borba, L. C. Campos, D. G. Machado, F. R. Aquino Neto and S. L. De Castro, “Chemical Composition and Microbicidal Activity of Extracts from Brazilian and Bulgarian Propolis,” Letters of Applied Microbiology, Vol. 38, No. 2, 2004, pp. 87-92. doi:10.1111/j.1472-765X.2003.01458.x
- M. C. Marcucci, “Propolis: Chemical Composition, Biological Properties and Therapeutic Activity,” Apidologie, Vol. 26, No. 2, 1995, pp. 83-99. doi:10.1051/apido:19950202
- V. S. Bankova, S. L. D. Castro and M. C. Marcucci, “Propolis: Recent Advances in Chemistry and Plant Origin,” Apidologie, Vol. 31, No. 1, 2000, pp. 3-15. doi:10.1051/apido:2000102
- E. Gregoris and R. Stevanato, “Correlations between Polyphenolic Composition and Antioxidant Activity of Venetian Propolis,” Food Chemical Toxicology, Vol. 48, No. 1, 2010, pp. 76-82. doi:10.1016/j.fct.2009.09.018
- S. Tazawa, T. Warashina, T. Noro and T. Miyase, “Studies on the Constituents of Brazilian Propolis,” Chemical & Pharmaceutical Bullettin, Vol. 46, 1998, pp. 1477- 1479. doi:10.1248/cpb.46.1477
- S. Tazawa, T. Warashina and T. Noro, “Studies on the Constituents of Brazilian Propolis II,” Chemical & Pharmaceutical Bullettin, Vol. 47, No. 10, 1999, pp. 1388-1392.
- S. Kumazawa, T. Hamasaka and T. Nakayama, “Antioxidant Activity of Propolis of Various Geographic Origins,” Food Chemistry, Vol. 84, No. 3, 2004, pp. 329- 339. doi:10.1016/S0308-8146(03)00216-4
- R. Stevanto, S. Fabris and F. Momo, “New Enzymatic Method for the Determination of Total Phenolic Content in Tea and Wine,” Journal of Agricolture and Food Chemistry, Vol. 52, No. 20, 2004, pp. 6287-6293. doi:10.1021/jf049898s
- H. Miyataka, M. Nishiki, H. Matsumoto, T. Fujimoto, M. Matsuka and T. Satoh, “Evaluation of Propolis. I. Evaluation of Brazilian and Chinese Propolis by Enzymatic and Physico-Chemical Methods,” Biological & Pharmaceutical Bullettin, Vol. 20, No. 5, 1997, pp. 496-501.
- S. Fabris, F. Momo, G. Ravagnan and R. Stevanato, “Antioxidant Properties of Resveratrol and Piceid on Lipid Peroxidation in Micelles and Monolamellar Liposomes,” Biophysical Chemistry, Vol. 135, No. 1, 2008, pp. 76-83. doi:10.1016/j.bpc.2008.03.005
- M. S. Blois, “Antioxidant Determinations by the Use of a Stable Free Radical,” Nature, Vol. 181, No. 4617, 1958, pp. 1199-1200. doi:10.1038/1811199a0
- K. Danzer and L. A. Currie, “Guidelines for Calibration in Analytical Chemistry,” Pure & Applied Chemistry, Vol. 70, No. 4, 1998, pp. 993-1014. doi:10.1351/pac199870040993
- E. De Rijke, P. Out, W. M. A. Niessen, F. Ariese, C. Gooijer and U. A. T. Brinkman, “Analytical Separation and Detection Methods for Flavonoids,” Journal of Chromatography A, Vol. 1112, No. 1-2, 2006, pp. 31-63. doi:10.1016/j.chroma.2006.01.019
- R. Stevanato, S. Fabris, M. Bertelle, E. Gregoris and F. Momo, “Phenolic Content and Antioxidant Properties of Fermenting Musts and Fruit and Vegetable Fresh Juices,” Acta Alimentaria, Vol. 38, No. 2, 2009, pp. 193-203. doi:10.1556/AAlim.2008.0031
NOTES
*Corresponding author.