Journal of Financial Risk Management
Vol.06 No.01(2017), Article ID:74711,13 pages
10.4236/jfrm.2017.61006
Does the VaR Measurement Using Monte-Carlo Simulation Work in China?―Evidence from Chinese Listed Banks
Dehong Wang1*, Jianbo Song2*#, Yongzhao Lin1*
1International Business School, Beijing Foreign Studies University, Beijing, China
2School of Business, Renmin University of China, Beijing, China

Copyright © 2017 by authors and Scientific Research Publishing Inc.
This work is licensed under the Creative Commons Attribution International License (CC BY 4.0).
http://creativecommons.org/licenses/by/4.0/


Received: January 18, 2017; Accepted: March 12, 2017; Published: March 15, 2017
ABSTRACT
There are usually great demands for risk control in the banking industry. Value at risk (VaR) is an important risk measurement in the Basel Accords, and Monte-Carlo simulation is a common method for VaR measurement. We conduct a series of Monte-Carlo simulation for VaR measurement based on the banks listed in the China stock market. Our study thinks that it is reliable to use Monte-Carlo simulation to measure VaR in Chinese banks. Therefore, we think that such VaR measurement works in China.
Keywords:
Value at Risk (VaR), Monte-Carlo Simulation, Chinese Banks

1. Introduction
A famous American movie in 2015, The Big Short, refreshes people’s miserable memories to the 2008 global financial crisis. iFeng.com1 says in 2016 that another global financial crisis may come again when commenting on the movie. The website lists American financial data and compares with those in 2008 crisis to demonstrate its comments. Table 1 shows the details of the comparison.
The movie arouses world-wide concerns again to the risk control in the banking industry. VaR, or value at risk, is an important risk indicator for the banking industry in the international risk management agreement, the Basil Accords. The Monte-Carlo simulation is one of the major algorithms in calculating VaR. China has accepted Basil Accord I in 2004, and started to accept Basil Accord II

Table 1. US financial data comparison: 2008 crisis and 2016.
Data source: http://finance.ifeng.com/a/20160320/14278609_0.shtml.
in 2007. China also promotes a great plan to accept Basil Accord III in 2018. However, there is an issue about China from the beginning: Basil Accords is designed for free market economies. However, China is not a free market economy yet. Is VaR and the corresponding Monte-Carlo simulation method suitable for China? In other words, does the VaR measurement using Monte-Carlo simulation work in China banking industry?
In order to answer this question, we test the monthly stock price risk of all the 16 listed banks from the year 2011 to 2015 using the VaR measurement based on Monte Carlo simulation. Our research finds that such VaR measurement is reliable in general. There are a few failures of VaR measurement in our study, especially in those years with significant market recessions. However, these VaR measurement failures are still acceptable in terms of yearly basis. Therefore, the VaR measurement based on Monte-Carlo simulation works in the Chinese banking industry.
We organize this paper in six sections: Section 2 for literature review, Section 3 for research methodology, Section 4 for sample description, Section 5 for Monte-Carlo simulation and test analysis, Section 6 concludes this paper.
2. Literature Review
There are three popular methods to calculate VaR, and they are the parameter method, historic simulation, and Monte-Carlo simulation. In the parameter method, the calculation of VaR bases on an assumption that the possible loss complies with a specified distribution, e.g. a normal distribution. However, Zangari (1996a, 1996b) points out that financial statistics do not follow a normal way in terms of the skewness with a fat tail. Therefore, the calculation based on the normal distribution assumption may underestimate the risk. Hull & White (1998) and Guermat & Harris (2001) use non-normal distributions and resolve the problem of fat tail.
The historic simulation and Monte-Carlo simulation are nonparametric approaches. One of the major advantages of using nonparametric methods are that they can avoid the misspecification of probability density functions of risk factors in an era of frequent financial disturbance (Yun and Powell, 2012) .
The historic simulation method assumes that the future loss goes in the similar pattern to its past. It does not request the distribution of loss in a normal way. Therefore, it bypasses the problem of fat tail (Jorion, 1997; Dowd, 1998) . However, another concern may arise. Stock prices in the nearer past, if compared with those in far history, usually have larger influences on how it performs today (Engle, 1982). However, the historic simulation method does not take time into consideration, which results in biased estimation.
The Monte-Carlo simulation method has the similar nonparametric characteristics with the historic simulation method, but it abandons the possibility of more extreme situation such as unexpected economic recession or booming. According to Jorion (1997) and Dowd (1998) , although Mont-Carlo simulation takes the nonlinear price risk and volatility risk into consideration, it has a limitation that the accuracy and reliability of the result heavily rely on the number of times in the simulation. The more number of times the simulation performs, the higher accuracy and reliability it achieves.
The Monte-Carlo simulation method also needs an assumption on the multivariate statistical distribution of price changes of the asset discussed, in this case the stock prices. This assumption comprises three factors?the expected change in value, the degree of uncertainty, and the type of distribution (Vlaar, 2000) .
Kupiec (1995) develops an approach to use the frequency of failures in risk management. This approach provides an easy way to evaluate the accuracy of VaR estimations. In this approach, a failure incurs when the actual loss exceed estimated VaR; a success happens when the actual loss is below VaR. In this way, we can compare the occurrence of success versus failures in large number of Monte-Carlo simulations. Then we can examine if the VaR measurement using Monte-Carlo simulation works.
Based on the above literatures, we use the Monte-Carlo simulation method in order to avoid the drawbacks in the parameter method and the historic simulation method. In this study, we also conduct large number of times of simulations to overcome the limitation of the Monte-Carlo method.
3. Research Methodology
In this section, we construct the research methods and processes for the VaR measurement based on Monte-Carlo simulation.
Traditionally, risk is measured by the standard variance that suggests the instability. However, human beings are by nature risk-averse. Given a certain amount of gain or loss, people react more to loss than the gain. Loss brings larger suffering than the satisfaction that gain gives. From this perspective, VaR serves well for this concern because it defines risk as the possible worst loss instead of the variance.
In the calculation of VaR, a distribution of possible loss is firstly attained. This distribution is assumed to be the probable loss in the future. From the distribution, one comes out the possible worse loss in an investment given a certain level of significance (e.g. 5%). This possibly worse loss is the value at risk (VaR) of the investment. The mathematical expression is Equation (1) as below (Wang et al, 2000) :
(1)
In the equation, the variable loss means the losses in the holding period of an asset. The variable VaR is the value at risk under the confidence level of. The concept of loss in the definition of VaR should be taken as negative return2 to daily context. The calculation of VaR becomes easy when we attain the distribution of possible losses. Therefore, the most important preparatory work is to attain a distribution of loss. There are several methods for this purpose, the parameter method, historic method and Monte-Carlo simulation method. As Monte-Carlo simulation is more objective, we use Monte-Carlo simulation to evaluate its suitability or reliability in the Chinese banking industry. We expect to examine the reliability of the VaR measurement based on Monte-Carlo simulation.
We use two methods to evaluate the reliability: first, examining the frequency of VaR prediction failures. Then we can tell the percentage of VaR prediction failures. Second, checking the significance of the difference between a VaR prediction and the actual number. We predict the month-end stock price based on that at the beginning of a month using the VaR measurement based on Monte Carlo simulation. Then we can find out if the VaR measurement works.
Suppose that a stock price is S0 at the starting point, we simulate how this price changes in the following 20 transactional days (the average transactional days in a month in the China stock market, after removing weekends and public holidays). We use the Geometric Brownian Motion (GBM) in the underlying process. GBM is mostly described by a Stochastic Differential Model (SDE), which connects the prices of two adjacent time points. However, most SDEs do not have an unambiguous solution, in other words, they cannot offer an explicit relation between two adjacent stock prices. Therefore, we resort to the most frequently used SDE, which is Equation (2) as below:
(2)
The variable St indicates stock price in the time point of t, and indicates the predicted stock price after a time interval of behind the point t. refers to the natural growth of stock price under the rate of risk-free return. suggests the volatility of the stock. is a random number derived from a normal distribution with the expectation of 0 and the variance of 1.
The exp expression of Equation (2) is a combination of various situations. The first part describes the “ideal growth” situation of stock prices as if
there were no risk and volatility. The second part is the “reverse growth” situation since the factor indicates the volatility of stock price.
The combination of the two parts depicts how a stock price is “ought” to be in the future. The last but most important part is that indicates the random Brownian movement. The random term is positively relevant to the volatility . The time interval that means the abnormal situation is more likely to occur when the stock price is more volatile in a longer period of time. The part multiplied by complies with a normal distribution, which helps determine the final magnitude of volatility and the direction (positive or negative direction) of the “random movement”. Furthermore, the overall abnormality can be in either positive or negative form that depicts unexpected economic situations (recession or booming).
4. Sample Data
We use all the 16 banks listed in China stock market from RESSET financial database for the VaR measurement based on Monte-Carlo simulation. These banks are Bank of Beijing, ICBC Bank (Industrial and Commercial Bank of China), Everbright Bank, Huaxia Bank, CCB Bank (China Construction Bank), BOCOM (Bank of Communication), Minsheng Bank, Bank of Nanjing, Bank of Ningbo, ABC Bank (Agricultural Bank of China), Ping’an Bank, SPD Bank (Shanghai Pudong Development Bank), CIB Bank (Industrial Bank, abbreviated as CIB for historical reasons), CMB Bank (China Merchant Bank), Bank of China, CITIC Bank (Citic Industrial Bank). Data items include daily stock price, risk-free return, and daily volatility of a stock. The time period of the sample is from Jan. 2011 to Dec. 2015, totaling 60 months. We take a month (usually 20 transactional days) as the unit of time period for the Monte-Carlo simulation. In other words, we pick up the stock price of a bank at the beginning of a month, and then follow a GBM for 20 steps to reach the possible stock price at the end of the month. The difference between stock prices at the end and beginning of a month makes the return to an investment. Then we have simulated or forecasted return using predicted month-end stock price and actual return using actual month- end price.
We assume that the and of the simulation are the values at the beginning of a month, and they keep the same during the entire month. This is not due to technical barricades that we cannot change it in accordance with the date. Instead, we assume that the Monte-Carlo simulation runs at the beginning of every month and tries to predict the possible return and the value at risk at the end of the month. In other words, our role is just like the risk controller of a bank in reality. We compare the predicted return to the actual return to check the accuracy and reliability of the simulation.
At the end of every month, we repeat the process for 70 times3 for each bank, and attain 70 simulation results of stock prices for each bank of each month. Therefore, we can obtain 70 possible monthly returns from Monte-Carlo simulation for each bank of each month in the sampling period for further analysis.
For every bank of every month during the 5 sampling years, the 70 possible returns constitute a distribution that we are able to calculate the value at risk at the significance level of 95% (70 × 5% = 3.5). In this way, we have a value at risk for each bank of every month. We consider these values as the reference to the risk measurement at the beginning of a month for each bank because of the data availability at that time. In the meantime, we attain the real monthly returns to the same bank and the same month, and compare the actual returns the simulated VaRs to check the significance of their differences.
5. Simulation and Analysis
In this section, we conduct the Monte-Carlo simulation first, then compare the differences between the simulated / predicted returns to the actual ones.
5.1. Simulation Results
We repeat the Monte-Carlo simulation for altogether 67,200 times (16 banks × 12 months × 5 years × 70 times per bank per month). Although we are not able to show all the results of the simulations, we can demonstrate one example of them as in Figure 1 and Figure 2.
Figure 1 shows that the stock price of Ping’an Bank is 16 (RMB) on Jan 4th 2011 (the first transactional day in China stock market in Jan, 2011) and the possible trend of the stock price in the following 20 transactional days. We repeat the simulation for 70 times, and there are 70 lines indicating 70 possible tendencies in the figure. If simulating much more than 70 times, the lines of trends in this figure become difficult for human eyes to identify a single line. However, if simulating much less than 70 times, the distribution of the lines in the figure becomes very random and hard to show meaningful trends of stock prices. The figure shows two features of the distribution: firstly, on a specific date, the greater the simulated price deviates from the original one, the lines be-
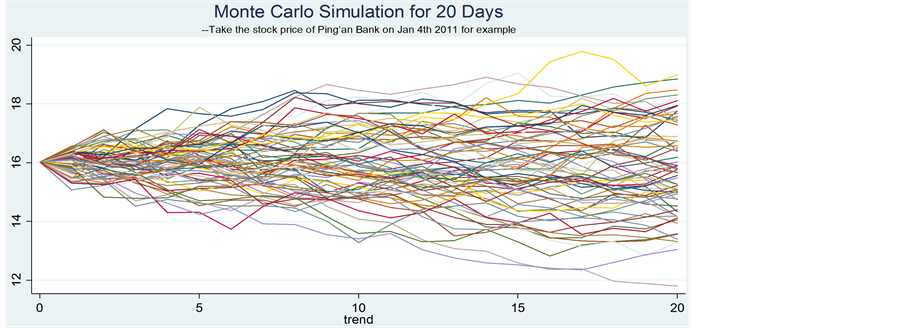
Figure 1. A 20-day Monte-Carlo simulation for stock price prediction: The example of Ping’an Bank, simulation started from Jan 4, 2011.

Figure 2. Distribution of simulated stock returns (vs. normal distribution curve): Ping’an Bank on Jan, 2011.
come less dense, or the less likely such price incurs. Secondly, the longer the dates are away from the starting date, the distribution of the lines becomes less dense, or becomes more random. It usually means to need much more number of simulations to predict the stock prices in the longer period of time.
Figure 2 shows the exact distribution of these trends, and we also draw a fitted normal distribution in the figure for comparing purpose. The figure tells that the distribution of the simulated stock prices is already close to a normal distribution.
5.2. Distributions of VaR, Actual Return, and Their Gap
Figure 3 shows the monthly VaRs of every bank in the 5-year sampling period. Most of them fall between -20% and zero. They stay quite stable in the first 4 years, but in the last year (2015), these VaRs decline below −0.2 or −20%, reflecting the possible deteriorating tendency and coming risk of banking industry.
Figure 4 shows the distribution of the actual returns, which fluctuates around zero in most of the time, except the year of 2013 when negative returns appear for most of the banks for several months. The country-wide economic recession may indicate that during this year, in which the VaR seems failing to measure the risk of some months in the year.
Figure 5 demonstrates the gap between the calculated VaR at the beginning of a month and the corresponding actual return of that month. We use the VaR as a reference to risk management in advance and predict the possibly worst result from Monte-Carlo simulation. It is thus important to the performance of VaR as a financial indicator to measure the possibly worst loss. We consider that the VaR works if the gap between actual return and VaR are positive significantly. From the figure, we find that in most of the sampling periods, the gap curves lie above the x-axis, or above zero in value. Therefore, we could come to a visual conclusion that generally the VaR measurement is reliable. However, we still need a t-test to examine the significance of the conclusion statistically.

Figure 3. The distribution of VaR changes of the 16 listed banks from 2011 to 2015.

Figure 4. Distribution of the actual returns of the 16 banks from 2011 to 2015.

Figure 5. Distribution of the gap between VaR and actual returns for the 16 banks from 2011 to 2015.
5.3. Does VaR Work?
The concept of VaR is based on a statistical distribution with a certain level of significance. Therefore, there are still definite possibilities that VaR fails to predict the real situation. A consequent question is how efficient VaR works in predicting risk. We answer to this question by a t-test of the gap between VaR and the actual return to stock prices. We demonstrate the result from two ways: the frequency of VaR failures, and the t-test results from the gap between the predicted and actual value.
5.3.1. Frequency of Failures
Table 2 shows the occurrence of VaR failures based on Monte-Carlo simulation among the 5-year sampling period for the 16 banks. The table shows that nearly half of the failures are in June 2013. The reason is that China capital market suffered from a drastic stock recession in that month. The Shanghai Security Composite Index (SSCI) falls to 1849 points (one of the lowest positions in history) on June 25, 2013, which is drastic and rare in the history of China stock market.
These VaR failures reveal that, when the market is in a normal situation rather than in an extreme status, VaR is generally reliable as the reference to risk measurement. However, we do not think that the extreme market situation is the concern of VaR. The mechanism of unexpected recession in a stock market is intricate, and it is not likely for Monte-Carlo simulation to predict. In this perspective, it’s not a hasty conclusion that the Monte-Carlo simulation based VaR prediction is reliable in normal market situations.
Table 3 shows the distribution VaR failures of all the 16 banks. In all the 5- year sampling period, most banks encounter about 2 - 3 such failures of the maximum not more than 4. Therefore, we think VaR works in the sampling period from the perspectives of an individual bank and a yearly basis. However, we still need a t-test to verify the significance statistically.
5.3.2. T-Test of the Gap between VaR and Actual Loss
Table 4 depicts the results of the t-test on the gap between VaR and actual loss. If the gap is significantly larger than zero, VaR works for predicting the worst case of losses.
Table 4 shows the t-test results based on a year and an individual bank. The gap between VaR and actual loss is significantly greater than zero, or positive.
Table 2. Distribution of VaR failures in terms of months.
Note: Most banks have 0-3 times of VaR failures for the 12-month prediction except for June and December, 2013. On June 2013, the number of VaR failures is 15, 40.5% of total 37 ones; on December 2013, it is 5, 13.5%. On year 2013, it is 22, 59.4%.
Table 3. Distribution of VaR failures in terms of banks and years.
Note: Most banks have 0 - 2 times of VaR failures for the 12-month prediction of a specific year. In terms of the sampling period, four banks have the lowest number of VaR failures, 1 time only; two banks have the highest number of VaR failures, 4 times.
Table 4. The t-test results on the gap between VaR and actual loss.
Note: ***stands for significance level at 1%, **at 5%, and *at 10%.
Therefore, the Monte-Carlo simulation based VaR measurement does work reliably for the prediction of stock prices in all the listed 16 Chinese banks. However, one may have another concern: are these results heavily relying on the repetition number of the Monte-Carlo simulation?
5.4. Robustness Test-Concern of Repetition Scale
We change the repetition number of Monte-Carlo simulation and examine the implication to the performance of VaR.
The concern may come from the number of simulation (limited to only 70 times in the previous tests). This may result in a biased distribution of the simulation results. In order to reinforce the results, we enlarge the number of Monte- Carlo simulation from 70 to 1,000 times, and conduct the whole process again. Table 5 and Table 6 describe the changes of the results in comparison to Table 2 and Table 3. Table 5 is on the basis of year-month combinations, and Table 6 is of bank-year ones. Table 5 removes the parts that have no changes in the entire column. The blank areas in Table 5 and Table 6 show no changes of the combination compared to Table 2 and Table 3 respectively.
From these tables, the occurrence of VaR failures does not vary drastically compared to Table 2 and Table 3. Most have no changes (blank cells in the tables as well as those combinations not shown in Table 5). Changed parts are only plus or minus 1 or 2. Therefore, the conclusion still holds for the performance of VaR prediction in the previous section. This test makes our conclusion robust on the reliability of VaR.
6. Conclusion
We study the reliability of VaR based on Monte-Carlo simulation using all the listed 16 Chinese listed banks of the year 2011-2015. The result reveals that VaR based on Monte-Carlo method works in Chinese banking industry especially when there is no drastic unexpected recession in the market. Even in the year with great market recession, the performance of VaR is still acceptable from the perspective of the whole year. Therefore, we believe that the VaR based on Monte-Carlo simulation works in China banking industries.
Table 5. Change in distribution of occurrence of VaR failures on a year-month basis (1000 vs. 70 simulations in Table 2).
Note: −1 (+1) indicates that the occurrences of VaR failures by 1000 simulations less that of 70 simulations in Table 2 is −1 (+1) on a year-month basis.
Table 6. Change in distribution of occurrence of VaR failures on a bank-year basis (1000 vs. 70 simulations in Table 3).
Note: −1 (+1) indicates that the occurrences of VaR failures by 1000 simulations less that of 70 simulations in Table 3 is −1 (+1) on a bank-year basis.
Although there are significant advantages for the VaR measurement using Monte-Carlo simulation, the method still has some challenges. Staum (2009) summarizes two main challenges from the computational perspective. Firstly, this VaR measurement method focuses on the left tail of the distribution. It is worthwhile to pursue variance reduction. Secondly, it may lead to a computationally expensive nested simulation, and it is worthwhile to explore approaches to make the simulation computation more efficient.
From beyond the computational perspective, there are another two shortcomings when using Monte-Carlo simulation to measure VaR. Firstly, Monte- Carlo simulation seems not working well under extreme economic environment like a recession in stock market (more failures in forecasting). Secondly, Monte- Carlo simulation seems unable to factor the behavioral irrationality of market participants.
Monte-Carlo simulation in risk management is an active area of research. Many researchers have been striving for improving the approaches of using Monte-Carlo simulation to measure VaR. We believe that these improvements would make the approach work better for VaR measurement.
Fund
These authors thank for the funding support from the Science Research Foundation of Renmin University of China, Project No. 15XNI010.
Cite this paper
Wang, D. H., Song, J. B., & Lin, Y. Z. (2017). Does the VaR Measurement Using Monte-Carlo Simulation Work in China?―Evidence from Chinese Listed Banks. Journal of Financial Risk Management, 6, 66-78. https://doi.org/10.4236/jfrm.2017.61006
References
- 1. Dowd, K. (1998). Beyond Value at Risk. Journal of Derivatives, 1, 55-66. [Paper reference 2]
- 2. Guermat, C., & Harris, R. D. F. (2001). Robust Conditional Variance Estimation and Value at Risk. Journal of Risk, 4, 25-41. https://doi.org/10.21314/JOR.2002.060 [Paper reference 1]
- 3. Hull, J., & White, A. (1998). Value at Risk When Daily Changes in Market Variables Are Not Normally Distributed. Journal of Derivative, 5, 9-19. https://doi.org/10.3905/jod.1998.407998 [Paper reference 1]
- 4. Jorion, P. (1995). Predicting Volatility in the Foreign Exchange Market. Journal of Finance, 50, 507-528. https://doi.org/10.1111/j.1540-6261.1995.tb04793.x [Paper reference 2]
- 5. Kupiec, P. H. (1995). Techniques for Verifying the Accuracy of Risk Measurement Models. Journal of Derivatives, 3, 73-84. https://doi.org/10.3905/jod.1995.407942 [Paper reference 1]
- 6. Staum, J. (2009). Monte Carlo Computation in Finance. In R. E. Caflisc (Ed.), Monte Carlo and Quasi-Monte Carlo Methods 2008 (pp. 19-42). Berlin: Springer. https://doi.org/10.1007/978-3-642-04107-5_2 [Paper reference 1]
- 7. Vlaar, P. J. G. (2000). Value at Risk Models for Dutch Bond Portfolios. Journal of Banking and Finance, 24, 1131-1154. https://doi.org/10.1016/S0378-4266(99)00068-0 [Paper reference 1]
- 8. Wang, C. F., Wan, H. H., & Li, G. (2000). Estimation of Value-at-Risk Using MCMC. Journal of Management Sciences in China, 3, 54-61. [Paper reference 1]
- 9. Yun, H. C., & Powell, R. J. (2012). Anybody Can Do Value at Risk: A Teaching Study Using Parametric Computation and Monte Carlo Simulation. Australasian Accounting Business & Finance Journal, 6, 101-118. [Paper reference 1]
- 10. Zangari, P. (1996a). An Improved Methodology for Measuring VaR. Risk Metrics Monitor, No. 2, 7-25. [Paper reference 1]
- 11. Zangari, P. (1996b). A Value at Risk Analysis of Currency Exposures. Risk Metrics Monitor, No. 2, 26-33.
NOTES
*These authors contributed equally to this work and should be considered as co-first authors.
1http://finance.ifeng.com/a/20160320/14278609_0.shtml
2According to this context, a loss is actually a negative return. Therefore, we do not clarify the words return or loss hereafter.
3One may concern that whether 70 times is enough for the simulation or not. Actually, as long as the number of simulations is large enough, the results are similar. We also show the results of 1000 times simulation later as a robustness verification.