American Journal of Climate Change
Vol.04 No.04(2015), Article ID:59345,11 pages
10.4236/ajcc.2015.44029
In-Field Management Practices for Mitigating Soil CO2 and CH4 Fluxes under Corn (Zea mays) Production System in Middle Tennessee
Sam Dennis1*, Qi Deng1, Dafeng Hui1, Junming Wang2, Stephen Iwuozo1, Chih-Li Yu1, Chandra Reddy1
1College of Agriculture, Human and Natural Sciences, Tennessee State University, Nashville, TN, USA
2Climate and Atmospheric Science Section, Illinois State Water Survey, Prairie Research Institute, University of Illinois at Urbana-Champaign, Champaign, IL, USA
Email: *sdennis@tnstate.edu
Copyright © 2015 by authors and Scientific Research Publishing Inc.
This work is licensed under the Creative Commons Attribution International License (CC BY).
http://creativecommons.org/licenses/by/4.0/


Received 19 May 2015; accepted 28 August 2015; published 1 September 2015
ABSTRACT
The United States continues to be the largest corn producer in the world. How to maximize corn yield and at the same time reduce greenhouse gas emissions, is becoming a challenging effort for growers and researchers. As a result, our understanding of the responses of soil CO2 and CH4 fluxes to agricultural practices in cornfields is still limited. We conducted a 3-yr cornfield experiment to study the responses of soil CO2 and CH4 fluxes to various agricultural practices in middle Tennessee. The agricultural practices included no-tillage + regular applications of urea ammonium nitrate (NT-URAN); no-tillage + regular applications of URAN + denitrification inhibitor (NT-inhi- bitor); no-tillage + regular applications of URAN + biochar (NT-biochar); no-tillage + 20% applications of URAN + chicken litter (NT-litter); no-tillage + split applications of URAN (NT-split); and conventional tillage + regular applications of URAN as a control (CT-URAN). A randomized complete block design was used with six replications. The same amount of fertilizer equivalent to 217 kg・N・ha−1 was applied to all of the experimental plots. The results showed that improved fertilizer and soil management, except the NT-biochar treatment significantly increased soil CO2 flux as compared to the conventional tillage (CT-URAN, 487.05 mg CO2 m−2∙h−1). Soil CO2 flux increased exponentially with soil temperature (T < 30˚C), and linearly with soil moisture (T ≥ 30˚C) in all treatments. Across all treatments, soil CO2 flux tended to be positively related to corn yield and/or soil moisture. Soil CH4 flux increased linearly with soil moisture in all treatments. Improved fertilizer and soil management did not alter soil CH4 flux, but significantly affected its moisture sensitivity. Our results indicated that agricultural practices enhancing corn yield may also result in a net increase in carbon emissions from soil, hence reducing the potential of carbon sequestration in croplands.
Keywords:
Tillage, Fertilizer Management, Soil CO2 Flux, Soil CH4 Flux, Greenhouse Gases

1. Introduction
The potential increase in the concentrations of greenhouse gases (GHGs) in the atmosphere due to anthropogenic activities has been linked to the observed climate change [1] . Carbon dioxide (CO2) is the most important GHG, contributing 60% to the anthropogenic GHG effect [2] . Agricultural lands cover 37% of the Earth’s land surface, and hold large reserves of carbon (C) in soil organic matter [1] . Historically, agriculture soils have lost more than 50 Pg C, mostly in the form of CO2 emitting back into the atmosphere [3] . The issue of how to reduce soil C emissions in croplands while maintaining high crop yields has become an important task [4] [5] . In recent years many agricultural practices, such as no-tillage, alternative use of fertilizer sources or methods (e.g., manure, split applications), and soil management (e.g., use of denitrification inhibitor or biochar), have been proposed as effective ways to enhance crop production and hence sequester atmospheric CO
However, whether C accumulation is in croplands or not, it depends largely on the trade-offs between the biomass C input and soil organic C decomposition [7] . Increase of crop growth that may result in high yield may also increase soil CO2 flux from croplands, and as a result may weaken the potential of soil C sequestration [8] [9] . Soil CO2 flux involves complex biological processes that are controlled by many environmental factors such as soil temperature and soil moisture [10] -[12] . Shifts of soil properties or microclimate following agricultural practices may influence CO2 flux [13] -[15] . There are minimal supporting data on which agricultural practices are more effective in reducing soil CO2 flux, especially with an increase in crop yields. Thus, a better understanding on the impacts of various agricultural practices on soil CO2 flux is critical for sustainable agriculture and future climate change [1] .
Methane (CH4) is another important GHG that contributes 15% to the anthropogenic GHG effect and has about 21 times the global warming potential of CO2 [2] . Agriculture is believed to be responsible for about 50% of global CH4 emission induced by human activity [16] . Methane is produced when organic C decomposition in oxygen-deprived conditions, notably from crop grown under flooded conditions [17] . The processes of CH4 flux, including production, oxidation, and transport into the atmosphere are influenced by agricultural practices [18] - [21] . For instance, no-tillage reduces CH4 emissions from paddy soils because soil conditions under no-tillage are more oxidative than those of conventional tillage [19] [20] . Applications of swine manure in a continuous corn cropping system result in net CH4 emission, whereas similar plots receiving urea fertilizer are sinks of CH
As previously stated the United States is the largest corn producer in the world and produces about 32% of the world’s corn crop [22] . Demand for corn in the world is high due to the population increase and the rapidly rising feedstock demand as well as its use for biofuel production [23] . In order to satisfy this demand while maintaining low C emission, the effects of different agricultural management practices such as the use of no-tillage and alternative fertilizer sources or methods (e.g. manure and split applications), and soil (e.g. inhibitor and biochar applications) management on soil CO2 and CH4 fluxes in cornfields need to be investigated.
We conducted a 3-yr field scale experiment in middle Tennessee to examine the responses of soil CO2 and CH4 fluxes in corn plots to different agricultural practices. In order to mimic the current practice by farmers in middle Tennessee, we considered the treatment of conventional tillage + regular applications of urea ammonium nitrate as a control. The no-tillage and alternative fertilizer sources or methods (manure and split applications) and soil (inhibitor and biochar applications) management were considered as the other five treatments. All treatments received the same equivalent unit of nitrogen (
2. Materials and Methods
This study was conducted at the Tennessee State University Agricultural Research Center (Latitude 36.12'N, Longitude 86.98'W, elevation
 -N and
 -N in the upper 0 - 30 cm soil depth were 10.15 and

Figure 1. A map of the Tennessee state university agricultural research center.
A total of 36 plots (5.5 ×
In order to measure the fluxes of CO2 and CH4, gas samples were collected after rainfall event(s) or fertilizer applications or every two weeks during the growing season over three years using static chambers. The construction of the static chambers and the gas sampling are described in details in Deng et al. (2015) [24] . All gas samples were stored in sealed vacuum vials and then they were sent for analysis via overnight mail to the University of California, Davis, California. Analysis was completed within 96 h of collection for CO2 and CH4 concentrations using gas chromatography (Model GC-2014, Shimadzu Scientific Instruments, Columbia, MD) equipped with a 63Ni electron capture detector. Instantaneous rates of soil CO2 and CH4 fluxes were calculated based on the rate of change in CO2 and CH4 concentration within the chamber; this was estimated as the slope of linear regression between concentration and time [25] . During each sampling, soil temperature was taken in-situ in each plot at
Repeated-measures Analysis of Variance (ANOVA) was used to determine the statistical significance of treatment, sampling year and their interactive effects on soil temperature, soil moisture, soil CO2 and CH4 fluxes in the corn field. Multiple comparisons (Least Significant Difference, LSD method) were conducted if significant effects of treatment, or sampling time were found. The relationships of soil CO2 or CH4 flux rates with soil temperature or moisture in each treatment were examined using model fitting. The t-test was used to determine the difference in the temperature sensitivity of CO2 flux and the moisture sensitivity of CH4 flux between the treatments. Simple regressions were also performed to correlate the soil CO2 and CH4 fluxes with corn yield, soil temperature or soil moisture across all the plots. All data analyses were carried out with the SPSS software Version 13.0 (SPSS Inc., Chicago, IL).
3. Results
3.1. Microclimates
The seasonal patterns of soil temperature and moisture were consistent with those of air temperature and rainfall. Across all treatments, seasonal soil temperature ranged from 18.2˚C to 35.4˚C, and seasonal soil moisture ranged from 5.8% to 24.4% Vol. Treatments did not significantly alter soil temperature (Figure 2(a)), but significantly affected soil moisture (Table 1; Figure 2(b)). Soil moistures in the CT-URAN and NT-biochar treatments were significantly lower than those in other treatments (Figure 2(b)). Soil moistures were 18.0%, 17.9%, 17.0%, 18.1%, 18.1% and 16.2% Vol. in the NT-URAN, NT-inhibitor, NT-biochar, NT-litter, NT-split and CT- URAN treatments, respectively (Figure 2(b)).

Table 1. Significance of the effects of treatment, sampling year and their interactions on soil temperature, soil moisture, soil CO2 and CH4 fluxes based on repeated measures ANOVA. Numbers are F-values. Asterisks indicate the level of significance (*p < 0.05, **p < 0.01).

Figure 2. Average values of soil temperature (a), soil moisture (b), soil CO2 and CH4 fluxes (c) (d) under different fertilizer and soil management within the experimental period in the corn fields. Different letters over the bars indicate statistically significant differences at α = 0.05.
3.2. Soil CO2 Flux
Soil CO2 flux in all treatments increased exponentially with soil temperature when soil temperature was below 30˚C (Figure 3(a) and Figure 4), and increased linearly with soil moisture when soil temperature was above 30˚C (Figure 3(b)). Soil CO2 flux was significantly affected by the improved fertilizer and soil management (Table 1). General, the NT-litter treatment had the highest average values of soil CO2 flux (647 mg CO2 m−2∙h−1), followed by the NT-split (601 mg CO2 m−2∙h−1), NT-inhibitor (589 mg CO2 m−2∙h−1), NT-URAN (584 mg CO2 m−2∙h−1), NT-biochar (520 mg CO2 m−2∙h−1) treatments, and the CT-URAN (487 mg CO2 m−2∙h−1) treatments (Figure 2(c)). Changes in soil CO2 flux was positively related to soil moisture and corn yield, respectively, across all the experimental plots (Figure 5). The soil temperature sensitivity (Q10) of soil CO2 flux was also significantly affected by the treatments, and was estimated as 2.3, 3.3, 2.0, 3.0, 2.9 and

Figure 3. Relationships of soil CO2 flux with soil temperature (a) and soil moisture (b), respectively across all treatments in the cornfields.

Figure 4. Relationships of soil CO2 flux and soil temperature (<30˚C) using an exponential equation under different fertilizer and soil management (a)-(f) represent the NT-URAN, UT-inhibitor, NT-biochar, NT-litter, NT-split, CT-URAN treatments in the cornfields. The black points represent the soil CO2 flux measured at soil temperature above 30˚C. The equations are listed in Table 2.
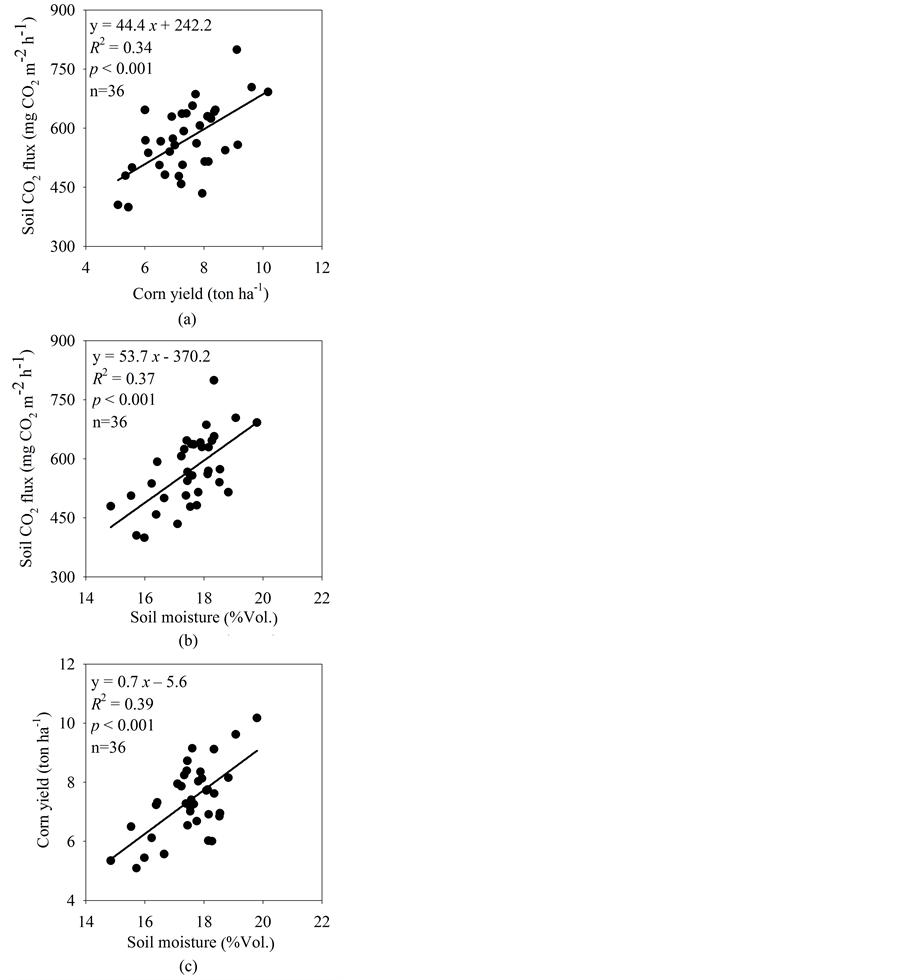
Figure 5. Relationships among soil CO2 flux, corn yield and soil moisture across all the plots in the cornfields.
3.3. Soil CH4 Flux
Overall, the corn soil in this study was a sink for CH4 flux in all treatments (Figure 2(d)). The seasonal variations of soil CH4 flux were not correlated with soil temperature, but increased linearly with soil moisture in all treatments (Table 3; Figure 6). Soil CH4 flux did not significantly vary among the treatments (Figure 2(d)). Soil CH4 fluxes were 0.006, 0.006, 0.007, 0.005, 0.007 and 0.007 mg CH4 m−2∙h−1 in the NT-URAN, NT-inhi- bitor, NT-biochar, NT-litter, NT-split and CT-URAN treatments, respectively (Figure 2(d)). However, the moisture sensitivity (c value) of soil CH4 flux was significantly affected by the treatments, and was estimated as 0.0010, 0.0012, 0.0007, 0.0017, 0.0009 and
Table 2. Relationships of soil CO2 flux (SR, mg CO2 m−2∙h−1) with soil temperature (ST, ˚C) when soil temperature is below 30˚C using an exponential equation [SR = R0 × exp (b × ST), where parameter R0 is basal soil CO2 emission when ST = 0, and b is related to soil temperature sensitivity] under different fertilizer and soil management in the cornfields in middle Tennessee. NT-URAN = no-tillage + regular applications of URAN; NT-inhibitor = no-tillage + regular applications of URAN + nitrification inhibitor; NT-biochar = no-tillage + regular applications of URAN + biochar; NT-litter = no-tillage + chicken litter; NT-split = no-tillage + split applications of URAN; and CT-URAN = conventional tillage + regular applications of URAN. * and ** indicate significant at α = 0.05, and 0.01 levels, respectively. Different capital letters in the same column indicate statistical significance at α = 0.05.
Table 3. Relationships of soil CH4 flux rate (CH, mg CH4 m−2∙h−1) and soil moisture (SM, %Vol.) using an exponential equation [CH = a + c × SM), where parameter a is basal soil CH4 flux rate when SM = 0, and c is related to soil water sensitivity] (parameter estimate ± standard error) under different fertilizer and soil management in the cornfields in middle Tennessee. NT-URAN = no-tillage + regular applications of URAN; NT-inhibitor = no-tillage + regular applications of URAN + nitrification inhibitor; NT-biochar = no-tillage + regular applications of URAN + biochar; NT-litter = no-tillage + chicken litter; NT-split = no-tillage + split applications of URAN; and CT-URAN = conventional tillage + regular applications of URAN. * and ** indicate significant at α = 0.05, and 0.01 levels, respectively. Different capital letters in the same column indicate statistical significance at α = 0.05.
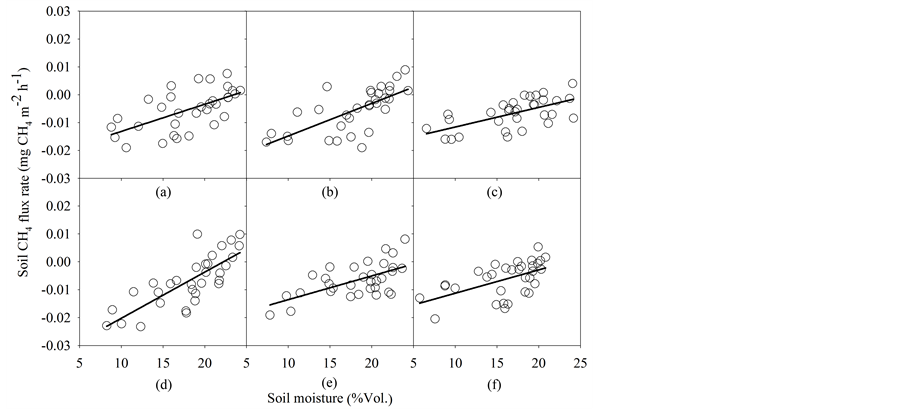
Figure 6. Relationships of soil CH4 flux and soil moisture under different fertilizer and soil management (a)-(f) represent the NT-URAN, UT-inhibitor, NT-biochar, NT-litter, NT-split, CT-URAN treatments) in the cornfields. The equations are listed in Table 3.
4. Discussion
4.1. Soil CO2 Flux under Different Fertilizer and Soil Management
The production of CO
Our results demonstrated that the use of improved fertilizer and soil management could significantly increase soil CO2 flux compared to the conventional tillage (CT-urea) (Figure 3(c)). Despite the large difference in soil CO2 flux among the treatments, the average CO2 fluxes (487 - 647 mg CO2 m−2∙h−1, Figure 2(c)) in the growing season in our study were within typical ranges for corn soils [7] [14] [28] . The increase in soil CO2 flux could be attributed to greater corn yield (corn growth) that might directly influence root respiration and/or indirectly provide substrate for microbial respiration, thus the positive linear relationships between soil CO2 flux and corn yield was observed in this study (Figure 5). The results reported here-in were similar with the studies in other ecosystems, for instance, Raich and Tufeckcioglu (2000) [29] conducted an extensive literature review and found that soil CO2 flux were positively correlated to litter fall in forests and annual net primary production in grasslands. Several experimental studies conducted in the southeastern United States also found that soil CO2 flux varied significantly between tillage and no-tillage or among crop types because of shift of crop production [8] [9] [13] . In addition, cropland often had relatively lower soil organic C like that observed in this study (2.37 g∙kg−1), thus soil CO2 flux in these croplands should be more subject to substrate limitation than those in forests and grasslands.
The improved fertilizer and soil management may also influence soil CO2 flux by modifying soil microclimate, for instant, soil temperature and moisture [8] [13] . Soil temperature did not significantly change among the treatments, thus soil temperature should not be directly responsible for the variation in soil CO2 flux. However, we found that the temperature sensitivity of soil CO2 flux varied significantly among the treatments (Table 2). Moreover, the temperature sensitivity tended to be positively related to corn yield across all treatments (Table 2; [24] ). This further supports our conclusion that improved fertilizer and soil management increased soil CO2 flux primarily by increasing corn growth.
Unlike soil temperature, we found that soil moisture was significantly affected by the treatments (Figure 3(a)). Moreover, soil CO2 flux tends to be positively related to soil moisture and corn yield across all the treatments (Figure 5(a) and Figure 5(b)). This is a little surprising, as we found that soil moisture only controlled soil CO2 flux when soil temperature was above a certain threshold (Figure 3). Because of the fact that crop yield benefited from water conservation [6] , a positive relationship between corn yield and soil moisture across all experiment plots was also observed (Figure 5(c)). It is therefore difficult though to distinguish whether the change of soil CO2 flux was a direct effect of soil moisture change, or an indirect effect through the increase of corn yield, or both.
4.2. Soil CH4 Flux under Different Fertilizer and Soil Management
Our results demonstrated that the soils in our cornfields were a net sink for CH4 (Figure 2(d)). The generally low values and net uptake of CH4 presented in our study were consistent with those reported for other cornfields [7] [14] [21] . Soil CH4 is often formed under anaerobic conditions by methanogens [18] . It is therefore reasonable especially considering the fact that we often face short-term droughts in the summer months like the one observed in June 2012 when only
4.3. Implications for Policies to Mitigate Climate Change
Given the increasingly growing attention to global climate change our results have potential to drive policies that will enhance the mitigation of greenhouse gases in croplands. Especially gases emitted from agronomic crops such as corn; as uncertainty remain regarding greenhouse gas emissions from croplands under different agricultural practices.
While many agricultural practices, such as no-tillage, alternative use of fertilizer sources or methods (e.g., manure, split applications), and soil management (e.g., use of denitrification inhibitor or biochar), has been proposed as effective ways to enhance crop production and hence sequester atmospheric CO2 in soils [6] , our results indicated an increasing CO2 flux from soil as well as the enhancement in crop yield under different agricultural practices. A phenomenon of this nature provides government and policy makers with tools to make informed decisions on how to maximize crop production and climate change mitigation.
Increased atmospheric concentration of CO2 is expected to increase global surface temperatures and alter precipitation regimes. Many climate change predictions suggest that warming, extreme rainfall events and droughts will become more common [1] . Our result also highlighted the relative importance of soil temperature and moisture in determining the seasonal variations of soil C fluxes. Consequently, increase in air temperature and changes in precipitation pattern may alter the responses of soil C fluxes to agricultural practices or management. By employing improved management techniques, prime agricultural lands have the potential to not only sequester carbon but also mitigate CO2, CH4, and N2O emissions, thereby reducing agriculture’s greenhouse gas footprint. In retrospect, approximately 9% of all greenhouse gases emissions originating in the United States come from agricultural activities [31] .
5. Conclusion
Our findings demonstrated that improved fertilizer and soil management could significantly increase soil CO2 flux in cornfields in the southeastern US, but did not change CH4 flux probably due to relatively good condition of air diffusion. Changes in soil CO2 flux among the treatments were positively correlated to corn yield and/or soil moisture. The rate of soil CO2 flux varied with soil temperature and soil moisture in all treatments, while the CH4 flux rate tended to be positively related to soil moisture only. Both temperature sensitivity of soil CO2 flux and moisture sensitivity of soil CH4 flux were affected by either alternative fertilizer sources or soil management. This tends to indicate that agricultural practice that enhances corn yield could also increase C emissions from soil, and hence reduce the potential of C sequestration in cornfields in the southeastern US.
Acknowledgements
We gratefully acknowledge financial support for this research from USDA-NIFA-Capacity Building Grant and USDA-NIFA Evans-Allen grant. We also thank Dr. Roger Sauve, Jeff Neufer, Tigist Jima, Emeka Nwaneri, Daniel Doss, and Eddie Williams for their assistance in field plot preparation, planting, and field data measurements, and Richard Link and Ravneet Kaur for their assistance in the experimental site map. Opinions expressed are those of the authors and not necessarily those of Tennessee State University, the Illinois State Water Survey, the Prairie Research Institute, or the University of Illinois. The authors have no conflict of interest to declare.
Cite this paper
SamDennis,QiDeng,DafengHui,StephenIwuozo,Chih-LiYu,ChandraReddy,JunmingWang, (2015) In-Field Management Practices for Mitigating Soil CO2 and CH4 Fluxes under Corn (Zea mays) Production System in Middle Tennessee. American Journal of Climate Change,04,367-378. doi: 10.4236/ajcc.2015.44029
References
- 1. Intergovernmental Panel on Climate Change (IPCC): Climate Change 2007 (2007) The Physical Science Basis. In: Solomon, S., Qin, D., Manning, M., et al., Eds., Contribution of Working Group I to the Fourth Assessment Report of the Intergovernmental Panel on Climate Change, Cambridge University Press, Cambridge, New York, 996.
- 2. OECD (2000) Environmental Indicators for Agriculture Methods and Results. Executive Summary, Paris.
- 3. Paustian, K., Cole, C.V., Sauerbeck, D. and Sampson, N. (1998) CO2 Mitigation by Agriculture: An Overview. Climate Change, 40, 135-162.
http://dx.doi.org/10.1023/A:1005347017157 - 4. Sistani, K.R., Jn-Baptiste, M., Lovanh, N. and Cook, K.L. (2011) Atmospheric Emissions of Nitrous Oxide, Methane, and Carbon Dioxide from Different Nitrogen Fertilizers. Journal of Environmental Quality, 40, 1797-1805.
http://dx.doi.org/10.2134/jeq2011.0197 - 5. Kumar, S., Nakajima, T., Kadono, A., Lal, R. and Fausey, N. (2014) Long-Term Tillage and Drainage Influences on Greenhouse Gas Fluxes from a Poorly Drained Soil of Central Ohio. Journal of Soil and Water Conservation, 69, 553-563.
http://dx.doi.org/10.2489/jswc.69.6.553 - 6. Franzluebbers, A.J. (2005) Soil Organic Carbon Sequestration and Agricultural Greenhouse Gas Emissions in the Southeastern USA. Soil & Tillage Research, 83, 120-147.
http://dx.doi.org/10.1016/j.still.2005.02.012 - 7. Omonode, R.A., Vyn, T.J., Smith, D.R., Hegymegi, P. and Gál, A. (2007) Soil Carbon Dioxide and Methane Fluxes from Long-Term Tillage Systems in Continuous Corn and Corn-Soybean Rotations. Soil & Tillage Research, 95, 182-195.
http://dx.doi.org/10.1016/j.still.2006.12.004 - 8. Hendrix, P.F., Han, C.-R. and Groffman, P.M. (1988) Soil Respiration in Conventional and No-Tillage Agroecosystems under Different Winter Cover Crop Rotations. Soil & Tillage Research, 12, 135-148.
http://dx.doi.org/10.1016/0167-1987(88)90037-2 - 9. Franzluebbers, A.J., Hons, F.M. and Zuberer, D.A. (1995) Tillage and Crop Effects on Seasonal Dynamics of Soil CO2 Evolution, Water Content, Temperature, and Bulk Density. Applied Soil Ecology, 2, 95-109.
http://dx.doi.org/10.1016/0929-1393(94)00044-8 - 10. Luo, Y., Wan, S., Hui, D. and Wallace, L.L. (2001) Acclimatization of Soil Respiration to Warming in a Tall Grass Prairie. Nature, 413, 622-625.
http://dx.doi.org/10.1038/35098065 - 11. Hui, D.F. and Luo, Y.Q. (2004) Evaluation of Soil CO2 Production and Transport in Duke Forest Using a Process-Based Modeling Approach. Global Biogeochemtry Cycles, 18, Article ID: GB4029.
- 12. Deng, Q., Zhou, G.Y., Liu, J.X., Liu, S.Z., Duan, H.L. and Zhang, D.Q. (2010) Responses of Soil Respiration to Elevated Carbon Dioxide and Nitrogen Addition in Young Subtropical Forest Ecosystems in China. Biogeosciences, 7, 315-328.
http://dx.doi.org/10.5194/bg-7-315-2010 - 13. Franzluebbers, A.J., Hons, F.M. and Zuberer, D.A. (1995) Tillage Induced Seasonal Changes in Soil Physical Properties Affecting Soil CO2 Evolution under Intensive Cropping. Soil & Tillage Research, 34, 41-60.
http://dx.doi.org/10.1016/0167-1987(94)00450-S - 14. Nyakatawa, E.Z., Mays, D.A., Way, T.R., Watts, D.B., Torbert, H.A. and Smith, D.R. (2011) Tillage and Fertilizer Management Effects on Soil-Atmospheric Exchanges of Methane and Nitrous Oxide in a Corn Production System. Applied and Environmental Soil Science, 2011, 1-12.
http://dx.doi.org/10.1155/2011/475370 - 15. Jiang, J.S., Guo, S.L., Zhang, Y.J., Liu, Q.F., Wang, R., Wang, Z.Q., Li, N.N. and Li, R.J. (2015) Changes in Temperature Sensitivity of Soil Respiration in the Phases of a Three-Year Crop Rotation System. Soil & Tillage Research, 150, 139-146.
http://dx.doi.org/10.1016/j.still.2015.02.002 - 16. Clerbaux, C., Hadji-Lazaro, J., Turquety, S., Megie, G. and Coheur, P.-F. (2003) Trace Gas Measurements from Infrared Satellite for Chemistry and Climate Applications. Atmospheric Chemistry and Physics, 3, 1495-1508.
http://dx.doi.org/10.5194/acp-3-1495-2003 - 17. Mosier, A.R., Valentine, D.W., Parton, W.J., Ojima, D.S., Schimel, D.S., Bronson, K.F. and Delgado, J.A. (1996) CH4 and N2O Fluxes in the Colorado Shortgrass Steppe: 1. Impact of Landscape and Nitrogen Addition. Global Biochemtry Cycles, 10, 387-399.
http://dx.doi.org/10.1029/96GB01454 - 18. Rondon, M., Ramirez, J. and Lehmann, J. (2005) Charcoal Additions Reduce Net Emissions of Greenhouse Gases to the Atmosphere. Proceedings of the 3rd USDA Symposium on Greenhouse Gases and Carbon Sequestration, Baltimore, 21-24 March 2005.
- 19. Harada, H., Kobayashi, H. and Shindo, H. (2007) Reduction in Greenhouse Gas Emissions by No-Tilling Rice Cultivation in Hachirogata Polder, Northern Japan: Life-Cycle Inventory Analysis. Soil Science & Plant Nutrition, 53, 668-677.
http://dx.doi.org/10.1111/j.1747-0765.2007.00174.x - 20. Liang, W., Shi, Y., Zhang, H., Yue, J. and Huang, G.H. (2007) Greenhouse Gas Emissions from Northeast China Rice Fields in Fallow Season. Pedosphere, 17, 630-638.
http://dx.doi.org/10.1016/S1002-0160(07)60075-7 - 21. Hernandez-Ramirez, G., Brouder, S.M., Smith, D.R. and van Scoyoc, G.E. (2009) Greenhouse Gas Fluxes in an Eastern Corn Belt Soil: Weather, Nitrogen Source, and Rotation. Journal of Environmental Quality, 38, 841-854.
http://dx.doi.org/10.2134/jeq2007.0565 - 22. National Corn Grower’s Association, NCGA (2013) Report.
http://www.ncga.com/upload/files/documents/pdf/WOC%202013.pdf - 23. Cassman, K.G., Dobermann, A.D., Walters, D.T. and Yang, H. (2003) Meeting Cereal Demand While Protecting Natural Resources and Improving Environmental Quality. Annual Review of Environment and Resources, 28, 315-358.
http://dx.doi.org/10.1146/annurev.energy.28.040202.122858 - 24. Deng, Q., Hui, D.F., Wang J.M., Iwuozo, S., Yu, C.L., Jima, T., Smart, D., Reddy, C. and Dennis, S. (2015) Corn Yield and Soil Nitrous Oxide Emission under Different Fertilizer and Soil Management: A Three-Year Field Experiment in Middle Tennessee. PLoS ONE, 10, e0125406.
http://dx.doi.org/10.1371/journal.pone.0125406 - 25. Smart, D.R., del Mar Alsina, M., Wolff, M.W., Matiasek, M.G., Schellenberg, D.S., Edstrom, J.P., Brown P.H. and Scow, K.M. (2011) N2O Emissions and Water Management in California Perennial Crops. In: Guo, L., Gunasekara, A.S. and McConnell, L.L., Eds., Understanding Greenhouse Gas Emissions from Agricultural Management, American Chemical Society, Baltimore, 227-255.
http://dx.doi.org/10.1021/bk-2011-1072.ch013 - 26. Inclan, R., de la Torre, D., Benito, M. and Rubio, A. (2007) Soil CO2 Efflux in a Mixed Pine-Oak Forest in Valsain (Central Spain). The Scientific World Journal, 7, 166-174.
http://dx.doi.org/10.1100/tsw.2007.7 - 27. Dilustro, J.J., Collins, B., Duncan, L., et al. (2005) Moisture and Soil Texture Effects on Soil CO2 Efflux Components in Southeastern Mixed Pine Forests. Forest Ecology and Management, 204, 85-95.
http://dx.doi.org/10.1016/j.foreco.2004.09.001 - 28. Ussiri, D.A.N. and Lal, R. (2009) Long-Term Tillage Effects on Soil Carbon Storage and Carbon Dioxide Emissions in Continuous Corn Cropping System from an Alfisol in Ohio. Soil & Tillage Research, 104, 39-47.
http://dx.doi.org/10.1016/j.still.2008.11.008 - 29. Raich, J.W. and Tufeckcioglu, A. (2000) Vegetation and Soil Respiration: Correlations and Controls. Biogeochemistry, 51, 71-90.
http://dx.doi.org/10.1023/A:1006112000616 - 30. Smith, K., Watts, D., Way, T., Torbert, H. and Prior, S. (2012) Impact of Tillage and Fertilizer Application Method on Gas Emissions in a Corn Cropping System. Pedosphere, 22, 604-615.
http://dx.doi.org/10.1016/S1002-0160(12)60045-9 - 31. US EPA, Environmental Protection Agency (2012) Inventory of US Greenhouse Gas. Inventory of US Greenhouse Gas Emissions and Sinks: 1990-2012.
http://epa.gov/climatechange/emissions/usinventoryreport.html
NOTES

*Corresponding author.