American Journal of Climate Change
Vol.3 No.2(2014), Article
ID:47223,9
pages
DOI:10.4236/ajcc.2014.32016
MODIS-Derived Nighttime Arctic Land-Surface Temperature Nascent Trends and Non-Stationary Changes
Reginald R. Muskett
Geophysical Institute, University of Alaska Fairbanks, Fairbanks, USA
Email: reginald.muskett@gmail.com
Copyright © 2014 by author and Scientific Research Publishing Inc.
This work is licensed under the Creative Commons Attribution International License (CC BY).
http://creativecommons.org/licenses/by/4.0/


Received 7 December 2013; revised 5 January 2014; accepted 1 February 2014
ABSTRACT
Arctic nighttime land-surface temperatures derived by the Moderate Resolution Imaging Spectroradiometer (MODIS) sensors onboard the NASA Terra and Aqua satellites are investigated. We use the local equator crossing times of 22:30 and 01:30, respectively, in the analysis of changes, trends and variations on the Arctic region and within 120˚ sectors. We show increases in the number of days above 0˚C and significant increase trends over their decadal periods of March 2000 through 2010 (MODIS Terra) and July 2002 through 2012 (MODIS Aqua). The MODIS Aqua nighttime Arctic land-surface temperature change, +0.2˚C ± 0.2˚C with P-value of 0.01 indicates a reduction relative to the MODIS Terra nighttime Arctic land-surface temperature change, +1.8˚C ± 0.3˚C with P-value of 0.01. This reduction is a decadal non-stationary component of the Arctic land-surface temperature changes. The reduction is greatest, −1.3˚C ± 0.2˚C with P-value of 0.01 in the Eastern Russia— Western North American sector of the Arctic during the July 2002 through 2012.
Keywords:MODIS, Aqua-Terra, Nighttime, Arctic, Land-Surface Temperature, Trends, Non-Stationary Changes

1. Introduction
“How is the Earth changing and what are the consequences for life on Earth?” [1] [2] . Through the successes of international Earth observing satellite missions up to the early 1990’s, NASA and international partners launched the Earth Observation System (EOS) mission. Growing and evolving since 1991 directed by the NASA Earth-Sun Exploration Division EOS consists of an international array of space science missions, data processing and archiving centers, sensor-design, algorithm development and testing and sub-orbital testing platforms and ground-validation facilities activities.
Physics and processes operative at and near the surface of Earth rely on the exchanges and transformations of energy and mass [2] . A key parameter in monitoring these transformations is land-surface temperature. It is the direct consequence of absorption and radiance of the ground with direct and indirect solar, atmosphere and geothermal energy fluxes. Land-surface temperature is a vital parameter to monitor transformations of biogeochemical cycles, ecosystems, energy-mass budgets, meteorology and climatology across temporal scales from the diurnal to multi-decadal and longer.
The Arctic presents a unique variety of land-surfaces on Earth [3] . Snowfields and glaciers ice, tundra landscapes, peatlands and wetlands, thaw lakes, the northern continuous permafrost zone and its summertime thawlayer (the active layer), ecosystems and river basins connected to the coastal seas of the Arctic Ocean play vital roles in Earth’s energy balance.
Due to the decades long rise and variability of global near-surface temperatures, investigators are probing the resiliency and vulnerability of land-stored carbon, biological sequestration changes and release of “old-carbon” from carbon-ground ice rich permafrost as a consequence of long-term thaw and degradation [4] [5] . The changes of land-carbon storage will be driven by physics for which land-surface temperature is a key input parameter [6] .
We are conducting an ongoing investigation of land-surface temperature and its changes across the Arctic, Figure 1 [7] . These are derived by the MODIS sensors on the NASA Terra and Aqua satellites operating continuously now into their second decade since launchings. The data derived to date offer the first complete decade of MODIS operations for us to explore the changes and climatology of Arctic land-surface temperatures.
2. Data
In December 1999 and May 2002, NASA launched the first satellites of the Earth Observation System program, Terra and Aqua, respectively [8] [9] . Though scaled back from the original concept Terra and Aqua complement each other in orbit design and sensor loads. Terra occupies an AM near-polar 705 km altitude orbit with sunsynchronous equator crossing times at local 10:30 (daytime) descending-mode and 22:30 (nighttime) ascendingmode [9] . Aqua occupies a PM 705 km altitude near-polar orbit with sun-synchronous equator crossing times at local 13:30 (daytime) ascending-mode and 01:30 (nighttime) descending-mode [9] . Both orbits are managed relative to the Worldwide Reference System 2 grid [9] . Corrections to both orbits are performed routinely to maintain “orbit-station”, i.e. temporal synchronization [9] [10] .
Terra carries MODIS Proto-Flight Model (PFM) and Aqua carries MODIS Flight Model 1 (FM1) electrooptical sensors [8] [9] . Backscatter and upwelling electromagnetic radiation from Earth’s surface and atmosphere components is received at the sensor in 36 narrow bands from 405 nm (blue) to 2155 nm (infrared) and 1.360 μm to 14.385 μm (thermal). Both MODIS PFM and FM1 sensor pointing accuracy and on-orbit radiance calibrations are performed on a monthly schedule [8] [11] . MODIS land-surface temperature (Kelvin) estimates are derived through a retrieval algorithm [8] [10] -[13] . The algorithm, a “split-window” variety utilizes day/ night thermal emission and emissivity in the 10.78 to 11.28 μm and 11.77 to 12.27 μm bands [12] . In the processing chain to Level 3 products, the input data source is the L1B Level 2 swath product. The L1B product uses cloud-cover detection routines to admit only “clear-sky” emissions. Corrections for atmosphere column water vapor and boundary level temperatures and off-zenith-angle pointing are also utilized [8] [12] -[14] .
We use the MOD11A1 (Terra) and MYD11AI (Aqua) Level-3 Version 5 datasets. These are in HDF-EOS format and data structure. The land-surface temperature data layer constitute 5-by-5 degree granule at 1-km posting sinusoidal grid [12] . Nighttime (AM and PM) temperatures with the highest quality flag (most reliable) beginning on 5 March 2000 (Terra) and 8 July 2002 (Aqua) are extracted for investigation. The retrieval accuracy of land-surface temperature has been quantified at the 1-Kelvin level [14] -[16] .
We extract the northern hemisphere 5-by-5 degree granule sinusoidal grids at 1-km posting from the HDF datasets into daily AM nighttime and PM nighttime mosaics. We re-project these mosaics into northern stereographic projection using the World Geodetic System reference ellipsoid WGS-84 relative to the International Terrestrial Reference Frame. From these mosaics we extract land-surface clear-sky land-surface temperature within the Arctic region and three 120˚ sectors for analysis, Figure 1.
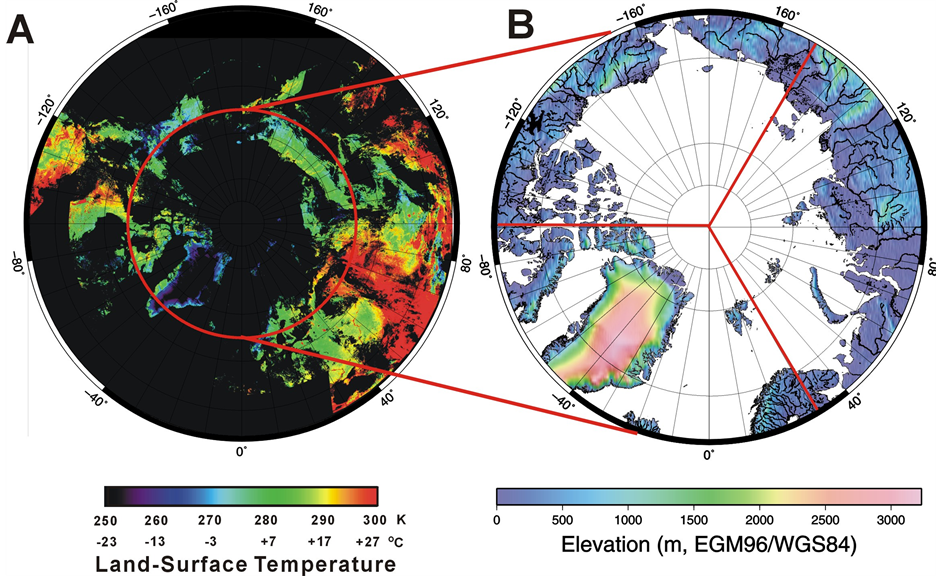
Figure 1. (A) MODIS (Aqua) 19 July 2012 nighttime land-surface temperatures; (B) Arctic region and 120 degree sector areas of interest. Sectors: Eurasia (Central East), Eastern Russia-Western North America (Northwest), Eastern North AmericaWestern Europe (Southwest). The Altimetry Corrected Elevation DEM 2 (ACE2) provides elevations shown in (B).
3. Results
Using nighttime AM and PM land-surface temperatures extracted in the regions of interest, Figure 1, we explore changes, nascent climatology and non-stationary characteristics. We illustrate the results in Figures 2-5 and Table 1 and Table2 Distributions plots (1:1) spanning the Terra decade (March 2000 through 2010) and Aqua (July 2002 through 2012) of nighttime land-surface temperature allow for assessment of increase (above 1:1) and decrease (below 1:1) to indicate nascent trends and non-stationary characteristics, on average.
3.1. Terra-MODIS 22:30 Equator Crossing Time
The Arctic region Figure 2(A) shows 2010 land-surface temperatures are increase relative to 2000 land-surface temperatures by 1.8˚C ± 0.3˚C, on average with P-value (ANOVA) of 0.01. Sector results indicate increase of 2.0˚C ± 0.3˚C in Eurasia, 1.6˚C ± 0.2˚C in Eastern Russia-Western North America and 0.6˚C ± 0.3˚C in Eastern North America-Western Europe, on average with P-values of 0.01. Regression R2 values are from 0.94 to 0.96.
Nighttime PM (22:30) monthly mean land-surface temperature change on the Arctic (Figure 3(A)) shows increases in eleven out of 12 months with January having the largest increase in excess of 4˚C and August having the smallest increase (near zero) over the decade. February shows a modest decrease of 1˚C over the decade. In the sectors monthly land-surface temperature changes terrain-controlled variations. Eurasia (Figure 3(B)) has the largest magnitude increase of almost 8˚C during March by the end of the decade whereas the increase is small at the March beginning the decade. Eastern Russia-Western North America (Figure 3(C)) shows increases except for February and the ending decade March. Eastern North America-Western Europe (Figure 3(D)) shows December and February with decreases and increases in the remaining months over the decade.
Over the March 2000 through 2010 decade there are changes in the number of days with land-surface temperature above 0˚C, Table2 On the basis of equator crossing time of 22:30 the number of days above 0˚C is increase by 26. The Arctic Eurasia sector shows an increase of 14. The Arctic Eastern Russia-Western North America shows an increase of 42. The Arctic Eastern North America-Western Europe sector shows no increase in the number of days above 0˚C.
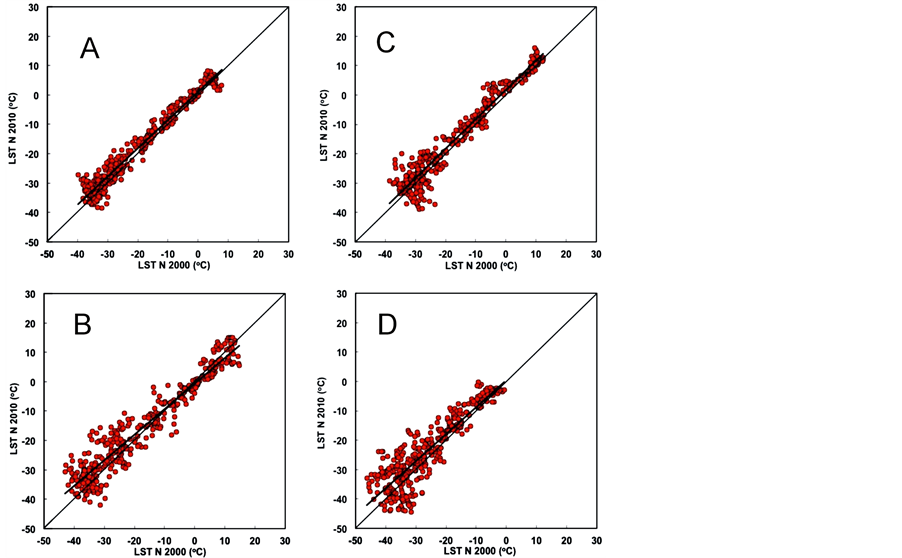
Figure 2. Regression plots of NASA MODIS (Terra, 22:30 local equator crossings) of Arctic and Arctic sector Land-Surface Temperature (LST) during nighttime (N) March 2000 through 2010. (A) Arctic; (B) Eurasia; (C) East Russia Western North America; (D) Eastern North America-Western Europe.

Table 1. Trends of nighttime arctic land-surface temperatures.
ECT = Equator Crossing Time, Δ = Average Land-Surface Temperature Change (Nascent Trend), STD = Standard Deviation, UNC = Uncertainty. Arctic sectors: Eurasia (E), Eastern Russia-Western North America (ER-WNA) and Eastern North America-Western Europe (ENA-WE) as shown in Figure 1.
3.2. Aqua-MODIS 01:30 Equator Crossing Time
Figure 4 and Table 1 show decadal comparisons of nighttime daily land-surface temperatures from July 2002
Table 2 . Nighttime Arctic MODIS-derived change in the number of days above 0˚C, 2000 through 2010 and 2002 through 2012.
Equator Crossing Time (ETC), Arctic sectors Eurasia (E), Eastern Russia-Western North America (ER-WNA) and Eastern North America-Western Europe (ENA-WE) as shown in Figure 1.
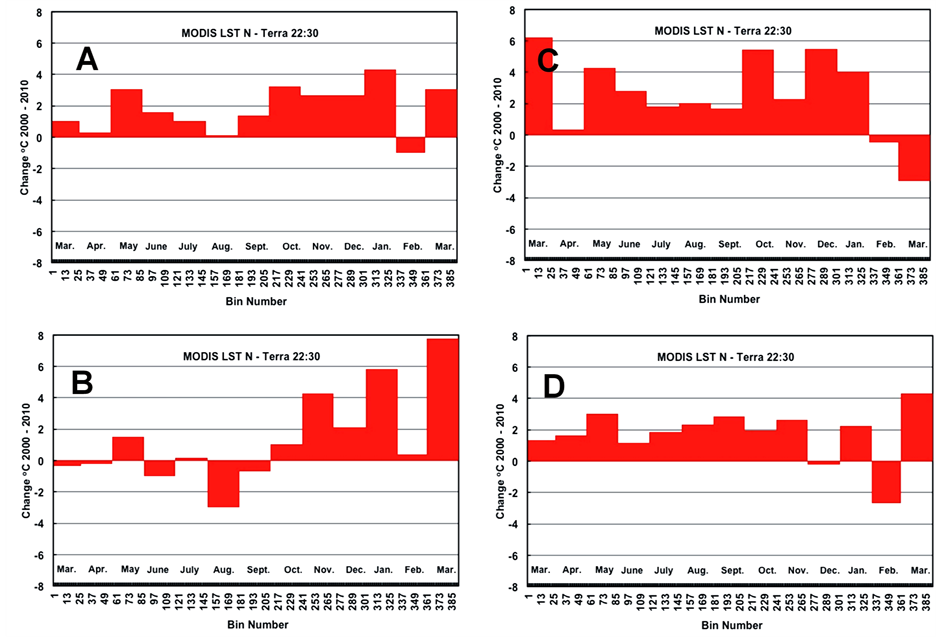
Figure 3. NASA MODIS (Terra) monthly nighttime land-surface temperature changes for the March 2000 through 2010. (A) Arctic; (B) Eurasia; (C) Eastern Russia-Western North America; (D) Eastern North America-Western Europe.
through July 2012 from MODIS-Aqua. The Arctic region Figure 4(A) shows 2012 land-surface temperatures are increase relative to 2002 land-surface temperatures by 0.2˚C ± 0.2˚C, on average with P-value (ANOVA) of 0.01. Sector results indicate an increase of 2.3˚C ± 0.3˚C in Eurasia and decreases of 1.3˚C ± 0.2˚C in Eastern Russia-Western North America and 2.1˚C ± 0.3˚C in Eastern North America-Western Europe, on average with P-values of 0.01. Regression R2 values are from 0.81 to 0.93 in the sectors and 0.96 in the Arctic region.
Nighttime AM (01:30) monthly mean land-surface temperature changes show a distinctive contrast (Figure 5)
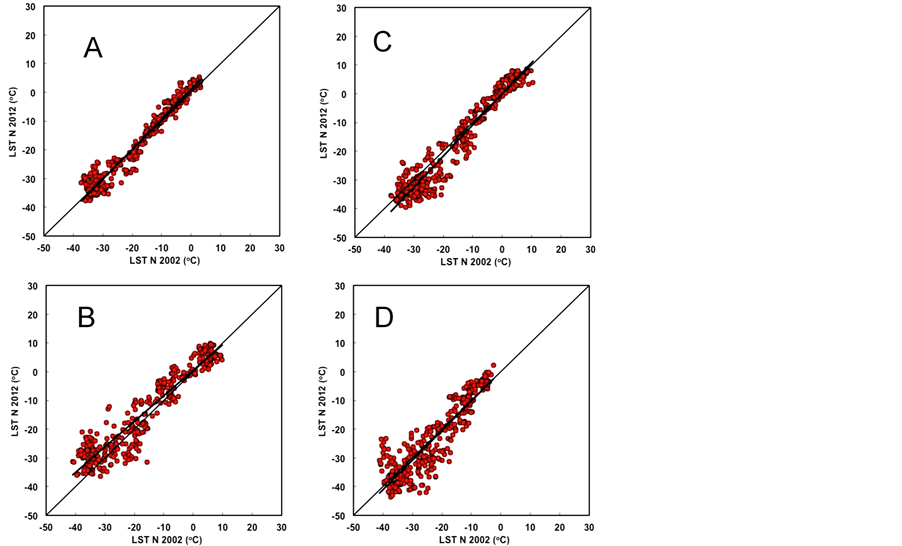
Figure 4. Regression plots of NASA MODIS (Aqua, 01:30 local equator crossings) of Arctic and Arctic sector land-surface temperature during nighttime (N) July 2002 through 2012. (A) Arctic; (B) Eurasia; (C) Eastern Russia-Western North America; (D) Eastern North America-Western Europe.
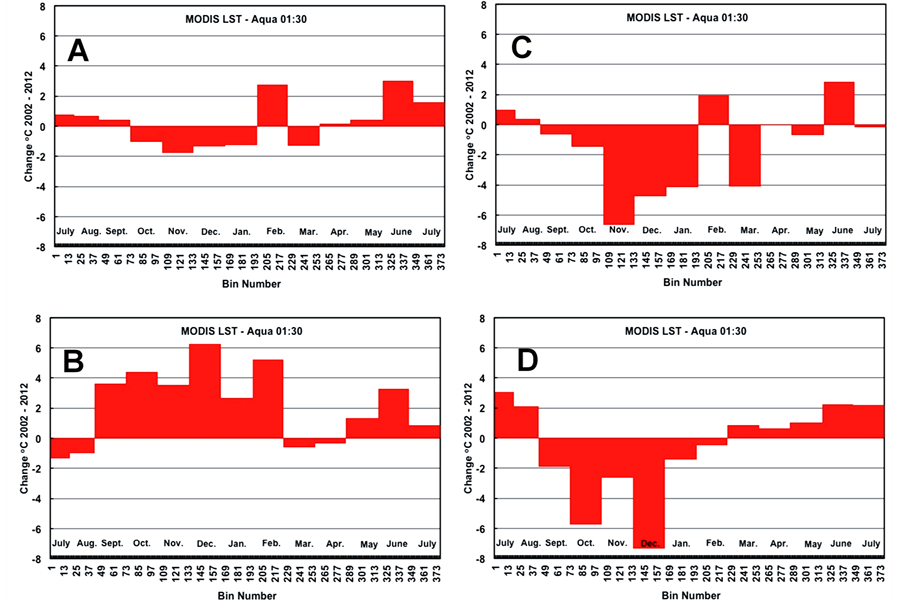
Figure 5. NASA MODIS (Aqua) monthly nighttime land-surface temperature changes for the July 2002 through 2012. (A) Arctic; (B) Eurasia; (C) Eastern Russia-Western North America; (D) Eastern North America-Western Europe.
relative to their PM counterparts. The Arctic region (Figure 5(A)) shows five months with decreases approaching 2˚C, two months with increases approaching 3˚C and the remainder show very small increase less than 1˚C. Eurasia (Figure 5(B)) shows increases of 3˚C to about 6˚C on the months of September through February. Decreases occur in beginning decade July, and in March and April. May and June show increases. Ending decade July shows an increase, however its magnitude is less than the decrease in the beginning decade July. Eastern Russia-Western North America (Figure 5(C)) shows most months with decrease, as much as 7˚C in November and February and June with increase in excess of 1˚C and 2˚C, respectively, over the decade. The beginning decade July and ending decade July show small increase and decrease, respectively. Eastern North AmericaWestern Europe (Figure 5(D)) shows December with the largest month decrease in excess of 7˚C, in a group of 5 months having decreases. The remaining months show increases that are much smaller in magnitude relative to the months with decrease, on average.
Over the July 2002 through 2012 decade there are changes in the number of days with land-surface temperature above 0˚C, Table2 On the basis of equator crossing time of 01:30 the number of days above 0˚C is increase by 21. The Arctic Eurasia sector shows an increase of 15. The Arctic Eastern Russia-Western North America shows an increase of 34. The Arctic Eastern North America-Western Europe sector shows no increase in the number of days above 0˚C.
4. Discussion
At the global and local scales solar irradiance is a fundamental driving parameter of climate, biogeochemical, energy-water cycles and geophysical processes on Earth [17] [18] . Irradiance absorbed and scattered by the atmosphere and ocean redistribute energy to maintain near surface mean temperatures and energy budgets in narrow ranges. Temporal variations occur diurnally, by latitude and by season from Earth’s rotation and orbit and by solar processes operative at decadal and longer periods [17] [19] -[23] . Spatial variations on Earth’s surface have variations dependent on terrain, geomorphology and material types and the influences of the near-surface atmosphere (i.e. turbulent layer) [17] [20] [21] -[24] .
Using the local equator crossing time as a key (Figure 2 and Figure 4, Table 1) we elucidate the Arctic nighttime land-surface temperature change, the change in the number of days with land-surface temperature above 0˚C (Table 2) and changes on a monthly basis of their respective decade periods (Figure 3 and Figure 5). While the 22:30 crossings show a significant increase of 1.8˚C ± 0.3˚C the 01:30 crossings show a significant increase of 0.2˚C ± 0.2˚C using the Arctic as the region of interest. Further examination on a 120˚ sector basis shows the 22:30 crossings have significant increases whereas two of the 01:30 crossings sectors, Eastern Russia-Western North America and Eastern North America-Western Europe, have significant decreases of 1.3˚C ± 0.2˚C and 0.6˚C ± 0.3˚C, respectively. The 01:30 crossing are advanced by 2 years (NASA Aqua) relative to the 22:30 crossings (NASA Terra).
The change in the polarity and magnitude of the sector nighttime land-surface temperature changes at the respective local equator crossing times expressions of non-stationary character of nascent trends. Whereas the daytime AM and PM Arctic land-surface temperature are forced by direct and in-direct solar irradiance the nighttime AM and PM are forced by in-direct radiation, i.e. the near-surface atmosphere.
5. Conclusion
Arctic nighttime land-surface temperatures derived by the MODIS sensors onboard the NASA Terra and Aqua satellites keyed by the local equator crossing times of 22:30 and 01:30, respectively, show increases in the number of days above 0˚C and significant increases and decreases of nascent trends over their periods of March 2000 through 2010 and July 2002 through 2012. The MODIS Aqua nighttime Arctic land-surface temperature change, +0.2 ± 0.2˚C with P-value of 0.01 indicates a reduction relative to the MODIS Terra nighttime Arctic land-surface temperature change of +1.8 ± 0.3˚C with P-value of 0.01. The reduction is a decadal non-stationary component of the Arctic land-surface temperature changes. The greatest reduction, −1.3˚C ± 0.2˚C with P-value of 0.01, is in the Eastern Russia-Western North American sector of the Arctic during the July 2002 through 2012 period.
Acknowledgements
Dr. Vladimir E. Romanovsky, Geophysical Institute University of Alaska Fairbanks (UAF) supported this research through grants from the National Science Foundation awards #0856864 and AON Development of Sustainable Observation of Thermal State of Permafrost in North America and Russia: The US Contribution to the Global Terrestrial Network for Permafrost and grants through the Scenarios Network for Alaska (UAF), the Arctic and Western Alaska Landscape Conservation Cooperatives and the USGS Alaska Climate Science Center. We thank the National Aeronautics and Space Agency Goddard Flight Center and the US Geological Survey Land Processes Distributed Active Archive Center for providing the MODIS datasets. We extend thanks the UAF Arctic Region Supercomputing Center for computational facilities assistance and the Geophysical Institute for support. The Generic Mapping Tools (http://gmt.soest.hawaii.edu, Dr. P. Wessel and Dr. W. H. F. Smith), ENVI/IDL and MATLab were used in this research.
References
- Mannstein, H. (1987) Surface Energy Budget, Surface Temperature and Thermal Inertia. In: Vaughan, R.A. and Reidel, D., Eds., Remote Sensing Applications in Meteorology and Climatology, Reidel Publishing Co., Dordrecht, 391-410.
- Wan, Z. (1999) MODIS Land-Surface Temperature Algorithm Theoretical Basis Document (LST ATBD) Version 3.3, National Aeronautics and Space. US Department of Commerce, Washington DC.
- Rowland, J.C., Jones, C.E., Altmann, G., Bryan, R., Crosby, B.T., Geernaert, G.L., Hinzman, L.D., Kane, D.L., Lawrence, D.M., Mancino, A., Marsh, P., McNamara, J.P., Romanovsky, V.E., Toniolo, H., Travis, B.J., Trochim, E. and Wilson, C.J. (2010) Arctic Landscapes in Transition: Responses to Thawing Permafrost. EOS Transactions of The American Geophysical Union, 91, 229-230. http://dx.doi.org/10.1029/2010EO260001
- Jorgenson, M.T., Romanovsky, V.E., Harden, J., Shur, Y.L., O’Donnell, J., Schuur, T. and Kanevskiy, M. (2010) Resilience and Vulnerability of Permafrost to Climate Change. Canadian Journal of Forest Research, 40, 1219-1236.http://dx.doi.org/10.1139/X10-060
- Grosse, G., Marchenko, S., Romanovsky, V., Wickland, K.P., French, N., Waldrop, M., Bourgeau-Chavez, L., Striegl, R., Harden, J., Turetsky, M., McGuire, A.D., Camill, P., Tarnocai, C., Frolking, S., Schuur, E. and Jorgenson, T. (2011) Vulnerability of High Latitude Soil Organic Carbon in North America to Disturbance. Journal Geophysical Research, 116, Article ID: G00K06. http://dx.doi.org/10.1029/2010JG001507
- Houghton, R.A., Davidson, E.A. and Woodwell, G.M. (1998) Missing Sinks, Feedbacks, and Understanding the Role of Terrestrial Ecosystems in the Global Carbon Balance. Global Biogeochemical Cycles, 12, 25-34.http://dx.doi.org/10.1029/97GB02729
- Muskett, R.R. (2013) MODIS-Derived Arctic Land-Surface Temperature Trends. Atmospheric and Climate Science, 3, 55-60. http://dx.doi.org/10.4236/acs.2013.31008
- Xiong, X.X., Chiang, K.F., Wu, A.S., Barnes, W.L., Guenther, B. and Salomonson, V.V. (2008) Multiyear On-Orbit Calibration and Performance of Terra MODIS Thermal Emissive Bands. IEEE Transaction on Geoscience and Remote Sensing, 46, 1790-1803. http://dx.doi.org/10.1109/TGRS.2008.916217
- Parkinson, C.L., Ward, A. and King, M.D. (2006) Earth Science Reference Handbook: A Guide to NASA’s Earth Science Program and Earth Observing Satellite Missions. In: Parkinson, C.L., Ward, A. and King, M.D., Eds., Earth Science Reference Handbook, National Aeronautics and Space Administration, US Department of Commerce, Washington DC, 1-6, 73-88, 225-227.
- L’Ecuyer, T.S. and Jiang, J.H. (2010) Touring the Atmosphere Aboard the A-Train. Physics Today, 63, 36-41.
- Xiong, X.X., Sun, J.Q. and Barnes, W. (2008) Intercomparison of On-Orbit Calibration Consistency between Terra and Aqua MODIS Reflective Solar Bands Using the Moon. IEEE Geoscience and Remote Sensing Letters, 5, 778-782.http://dx.doi.org/10.1109/LGRS.2008.2005591
- Wan, Z. (2008) New Refinements and Validation of MODIS Land-Surface Temperature/Emissivity Products. Remote Sensing Environment, 112, 59-74. http://dx.doi.org/10.1016/j.rse.2006.06.026
- Coll, C., Wan, Z. and Galve, G.M. (2009) Temperature-Based and Radiance-Based Validations of the V5 MODIS Land Surface Temperature Product. Journal Geophysical Research, 114, Article ID: D20102.
- Wang, W., Liang, S. and Meyers, T. (2008) Validating MODIS Land Surface Temperature Products Using Long-Term Nighttime Ground Measurements. Remote Sensing Environment, 112, 623-635.
- Hall, D.K., Box, J.E., Casey, K.A., Hook, S.J., Shuman, C.A. and Steffen, K. (2008) Comparison of Satellite-Derived and In-Situ Observations of Ice and Snow Surface Temperatures over Greenland. Remote Sensing Environment, 112, 3739-3749. http://dx.doi.org/10.1016/j.rse.2008.05.007
- Hachem, S., Duguay, C.R. and Allard, M. (2011) Comparison of MODIS-Derived Land Surface Temperatures with Near-Surface Soil and Air Temperature Measurements in the Continuous Permafrost Terrain. The Cryosphere Discussion, 5, 1583-1625. http://dx.doi.org/10.5194/tcd-5-1583-2011
- Weatherhead, B., Tanskanen, A. and Stevermer, A. (2005) Factors Affecting Surface Ultraviolet Radiation Levels in the Arctic. Chapter 5.4. In: ACIA, Ed., Arctic Climate Impact Assessment, Cambridge University Press, 159-164.
- Usoskin, I.G. (2008) A History of Solar Activity over Millennia. Living Reviews in Solar Physics, 5, 1-88.http://www.livingreviews.org/lrsp-2008-3
- Stephenson, F.R. (1988) Solar Variability from Historical Records. In: Stephenson, F.R. and Wolfendale, A.W., Eds., NATO ASI Series C, Mathematical and Physical Sciences Vol. 236, Kluwer Academic Publishers, Springer, New York, 109-129.
- Soon, W.W.-H. (2009) Solar Arctic-Mediated Climate Variation on Multidecadal to Centennial Timescales: Empirical Evidence, Mechanistic Explanations, and Testable Consequences. Physical Geography, 30, 144-184.http://dx.doi.org/10.2747/0272-3646.30.2.144
- Soon, W.W.-H. (2005) Variable Solar Irradiance as a Plausible Agent for Multidecadal Variations in the Arctic-Wide Surface Air Temperature Record of the Past 130 Years. Geophysical Research Letters, 32, Article ID: L16712.http://dx.doi.org/10.1029/2005GL023429
- Usoskin, I.G., Solanki, S.K. and Kovaltsov, G.A. (2007) Grand Minima and Maxima of Solar Activity: New Observational Constraints. Astronomy and Astrophysics, 471, 301-309. http://dx.doi.org/10.1051/0004-6361:20077704
- Scafetta, N. and West, B.J. (2006) Phenomenological Solar Signature in 400 Years of Reconstructed Northern Hemisphere Temperature Record. Geophysical Research Letters, 33, Article ID: L17718.http://dx.doi.org/10.1029/2006GL027142
- Tinsley, B.A. and Yu, F. (2004) Atmospheric Ionization and Clouds as Links between Solar Activity and Climate. In: Judit, M., Fox, R., Frohlich, C., Hudson, H.S., Kuhn, J., McCormack, J., North, G., Sprigg, W. and Wu, S.T., Eds., Solar Variability and Its Effects on Climate, AGU Geophysical Monograph Series, No. 141, 321-339.