Open Journal of Fluid Dynamics
Vol.3 No.3(2013), Article ID:37047,7 pages DOI:10.4236/ojfd.2013.33024
Performance of an Axial Cascade
King Saud University, Riyadh, KSA
Email: Basharat@ksu.edu.sa
Copyright © 2013 Basharat Salim. This is an open access article distributed under the Creative Commons Attribution License, which permits unrestricted use, distribution, and reproduction in any medium, provided the original work is properly cited.
Received June 18, 2013; revised July 17, 2013; accepted July 31, 2013
Keywords: Axial; Cascade; Performance; Deflection; Incidence
ABSTRACT
A cascade is defined as an infinite row of equidistant similarly aerofoil bodies. The cascade is used to divert a flow stream with a minimal loss. The flow over an axial cascade presents a complicated intra blade fluid dynamic interaction that causes the flow to behave differently than the flow over a single aerofoil blade. A cascade tunnel in which different shapes of cascades could be tested for performance evaluation has been build. An axial flat plate cascade of 70 mm chord, 215 mm span and 0.55 pitch chord ratio has been tested in this tunnel for evaluating its aerodynamic performance. The results depict that the Reynolds number, incidence and blade angle of the cascade control the aerodynamic performance of the axial cascade.
1. Introduction
A cascade is a row of geometrically similar blades arranged at equal distance from each other and aligned to the flow at the same angle. It is an infinite row of equidistant similarly aerofoil bodies. The cascade is used to divert a flow stream with a minimal loss. It forms the basic block for the design and development of turbomachinery, particularly the axial compressor and axial turbine. The turbine usually shows tolerance to the blade design and alignment errors because blades of a turbine stage perform under a favorable pressure gradient whereas compressor blades are prone to aerodynamic losses because these have to work under adverse pressure gradients due to diffusing nature of the flow field. The bladings of an axial compressor and axial turbine have high solidity which makes the flow structure in these machines highly complicated as the flow around any blade in these machines is affected by the presence of the adjacent blades. These blades are said to form a cascade. The pressure ratio developed by a cascade depends on its aerodynamic characteristics. There are various types of shapes used in compressor blading. These range from C series, NACA series, DCA series and other special profiles. Similarly, aerofoil shapes used in wind turbines are of NACA series, thin aerofoil shape and of special arc shapes. The aerodynamic parameters for compressor blades are stagger, solidity, camber, camber line shapes, thickness chord ratio and thickness distribution. The peculiar geometry of their blades causes the flow to be three dimensional. The passage flow in these machines is grossly affected by passage pressure gradient, secondary flows, boundary layer effects, cross flows, tip clearances, complicacies of stator rotor aerodynamic interaction, shock boundary layer interaction and inlet flow conditions. Therefore, understanding of cascade flow results in systematic improvement of the aerodynamic art for design of such passages.
Specification of a blade of an axial compressor or turbine is at the very heart of the design of an axial turbomachinery. There have been many attempts to find solution of these problems. Roundbash [1], Scholz [2] and Gostalow [3] have discussed the summary of these works. Compusty [4] has reported the work of Felix and Emery [5] in which it has been suggested that the shape of a compressor blade has an insignificant effect on its performance at low mach numbers. Their tests on C4 and NACA65 series cascades revealed same results. Bacur [6] has studied the flow development in S shaped profiles in a cascade tunnel. Andrews [7] has found out that the camber line shape, leading edge radius, and thickness chord ratio have small effect on the performance of a cascade. Serovy, et al. [8] have carried out detailed investigation of inter-passage flow in a baseline and modified versions of a two-stage axial compressor and have observed similarities in their aerodynamic performance. Pullen and Harrvey [9] have arrived at a loading parameter for an axial flow turbine cascade by taking sweep of the blade into account. They have validated their results with the experimental results of linear cascade tests of low pressure ratio axial turbine. Kalpatrick and Barrows [10] have tested cascades of varying aspect ratio from 1.5 to 3. Mustaphe, et al. [11] have presented the results of an off design performance of a turbine cascade at its mid span with varying Mach numbers, Reynolds numbers and incidences. Nagasaki and Yamsaki [12] have developed a CFD code to compute unsteady aerodynamic forces on a vibrating annular cascade and have compared it with the linearized theory and have found the two to be almost similar.
2. Experimental Setup and Methodology
The experimental setup for testing the cascade was constructed and it is a blow down, close jet, low speed cascade tunnel shown in Figure 1. The tunnel has a radial blower of 3.5 kW power, pressure rise of 3.5 kPa and a flow rate of 0.83 cubic meters per second. The blower speed is 3450 rpm. The blower is fitted with an inlet duct of 200mm internal diameter and 300 mm length. The inlet duct has a cup and cone valve at the free end to control the flow rate through the cascade tunnel. The cup can be moved into the cone by an axial movement system. The cup can fully close the valve. A circular duct of diameter 270 mm is fitted at the exit of the blower. The duct is connected to a settling chamber. The settling chamber has three parts. The inlet part is of diffusing section with inlet of diameter 270 mm where as its exit is rectangular of size 680 mm × 600 mm. This diffusing section is connected to the middle part which is further divided into three portions of size 680 mm × 600 mm and length 190 mm. These parts are connected tightly and wire gauze is fitted at each connection. These gauzes reduce the turbulence of the flow emerging out of the blower. The exit of the settling chamber is a rectangular converging duct of inlet size 680 mm × 600 mm and exit of size 220 mm × 210 mm. The converging section is connected to a small rectangular duct of size 220 mm × 210 mm and length 200 mm. This duct is in turn connected to the rectangular test section of size 220 mm × 210 mm and length 300 mm. The test section is fabricated from Perspex sheet of 12 mm thickness. All the ducts etc are made from sheet metal. The test section discharges the air to the atmosphere. The cascade row is fitted at the end of the test section. The cascade row was made to rotate from −10˚ to +10˚ by a moving mechanism which kept the pitch of the blades same all through. The axial cascade had a chord of 70 mm, span of 215 mm and pitch chord ratio of 0.55. The velocity traverses upstream and downstream of the cascade row were taken by using two Pitot Static probes, one upstream and other downstream, which was fitted on traverse systems. The traverses were taken at two flow rates corresponding to the two free stream Reynolds numbers for different blade angle setting. These traverses yielded the total velocity, V, and its flow angle, α, at the central location. The blades were oriented to the incoming flow through cascade blade angle changing mechanism that was fitted to the cascade tunnel. It could orient flow at any angle simultaneously.
3. Results and Discussion
The main concern of this study was to build a cascade tunnel in which different shapes of cascades could be tested for performance. This paper presents the results of the investigation that were carried out for finding out the performance of an axial flat plate cascade in that purpose build experimental setup. Karanja and Sayers [13] and Wolf and Jhonston [14] have documented that presence of a presence of a diffuser downstream of a straight duct reconfigures the flow upstream of it in that duct. This becomes more urgent in case where the straight duct is blocked by the cascade row. Hence it becomes necessary to determine a position which can represent free stream location. To achieve this traverse of velocity probe were carried out upstream of the cascade row and a location
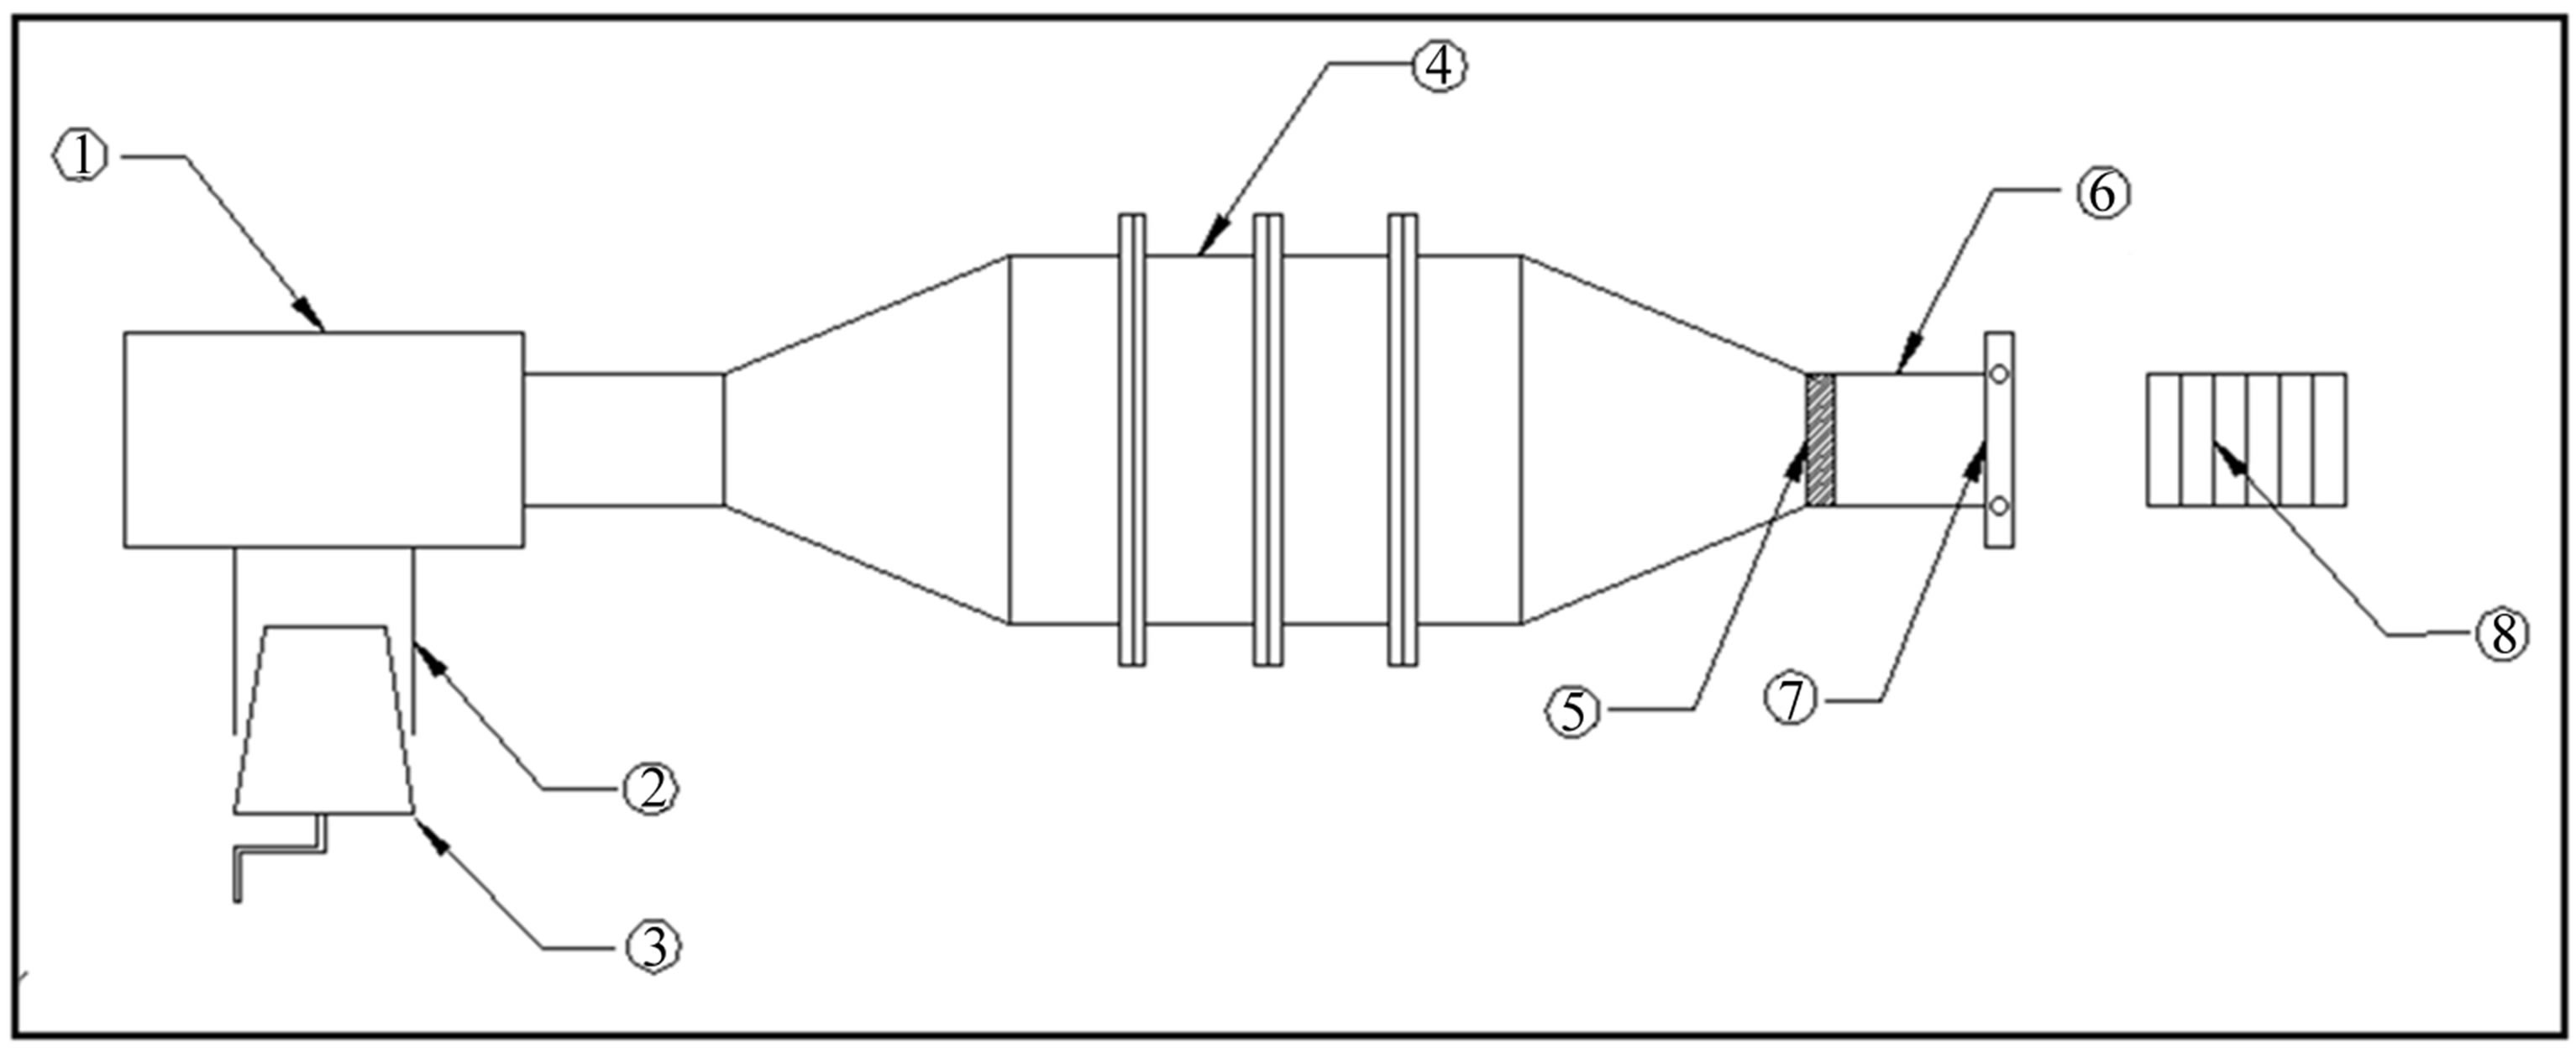
Figure 1. Experimental set up; (1) Blower; (2) Inlet duct; (3) Cup and cone; (4) Settling chamber; (5) Distorter; (6) Test section; (7) Cascade blade angle changing mechanism (8) Cascade row.
was found where the velocity profile would match the normal velocity profile in a rectangular duct. The free stream condition of symmetrical flow behavior in the straight duct was found at a distance of 1.75 times the width of the straight duct upstream of the leading edge of the cascade. This was taken as a free stream location for all the test conditions. The investigations were carried out at two flow rates corresponding to free stream Reynolds numbers of 2.26 × 10⁵ and 2.52 × 10⁵. It may be said that the free stream Reynolds number was based on duct dimensions. The inlet velocity profiles for free stream of the cascade were measured at about six chords distance upstream of the cascade. These profiles were measured with a NPL standard Pitot static probe using an inclined water manometer for the measuring the pressure. Figure 2 shows the free stream velocity profiles at two Reynolds numbers for the axial cascade. The results show uniform velocity profile for the most of the passage width of the tunnel except near the walls. The nonuniformity at the walls can be attributed to the wall effect of the tunnel and related boundary layer phenomenon. Therefore it can be concluded that the present investigations present the results of an axial cascade with a uniform upstream flow.
Cascade Flow: The flow over an axial cascade presents a complicated intra blade fluid dynamic interaction that causes the flow to behave differently than the flow over a single aerofoil blade. But if the aspect ratio of the cascade blade row is high then two dimensionality of the flow prevails. In most of the flow analysis problems of the cascade the flow is usually assumed to be two dimensional. The most important aerodynamic flow parameters that govern the two dimensional flow behavior in a cascade are angle of incidence, angle of deflection, angle of deviation, static pressure rise coefficient, total pressure loss coefficient, drag coefficient and lift coefficient. These flow parameters were measured by a precaliberated three hole probe near the centre of the span of the cascade at half chord distance upstream and downstream
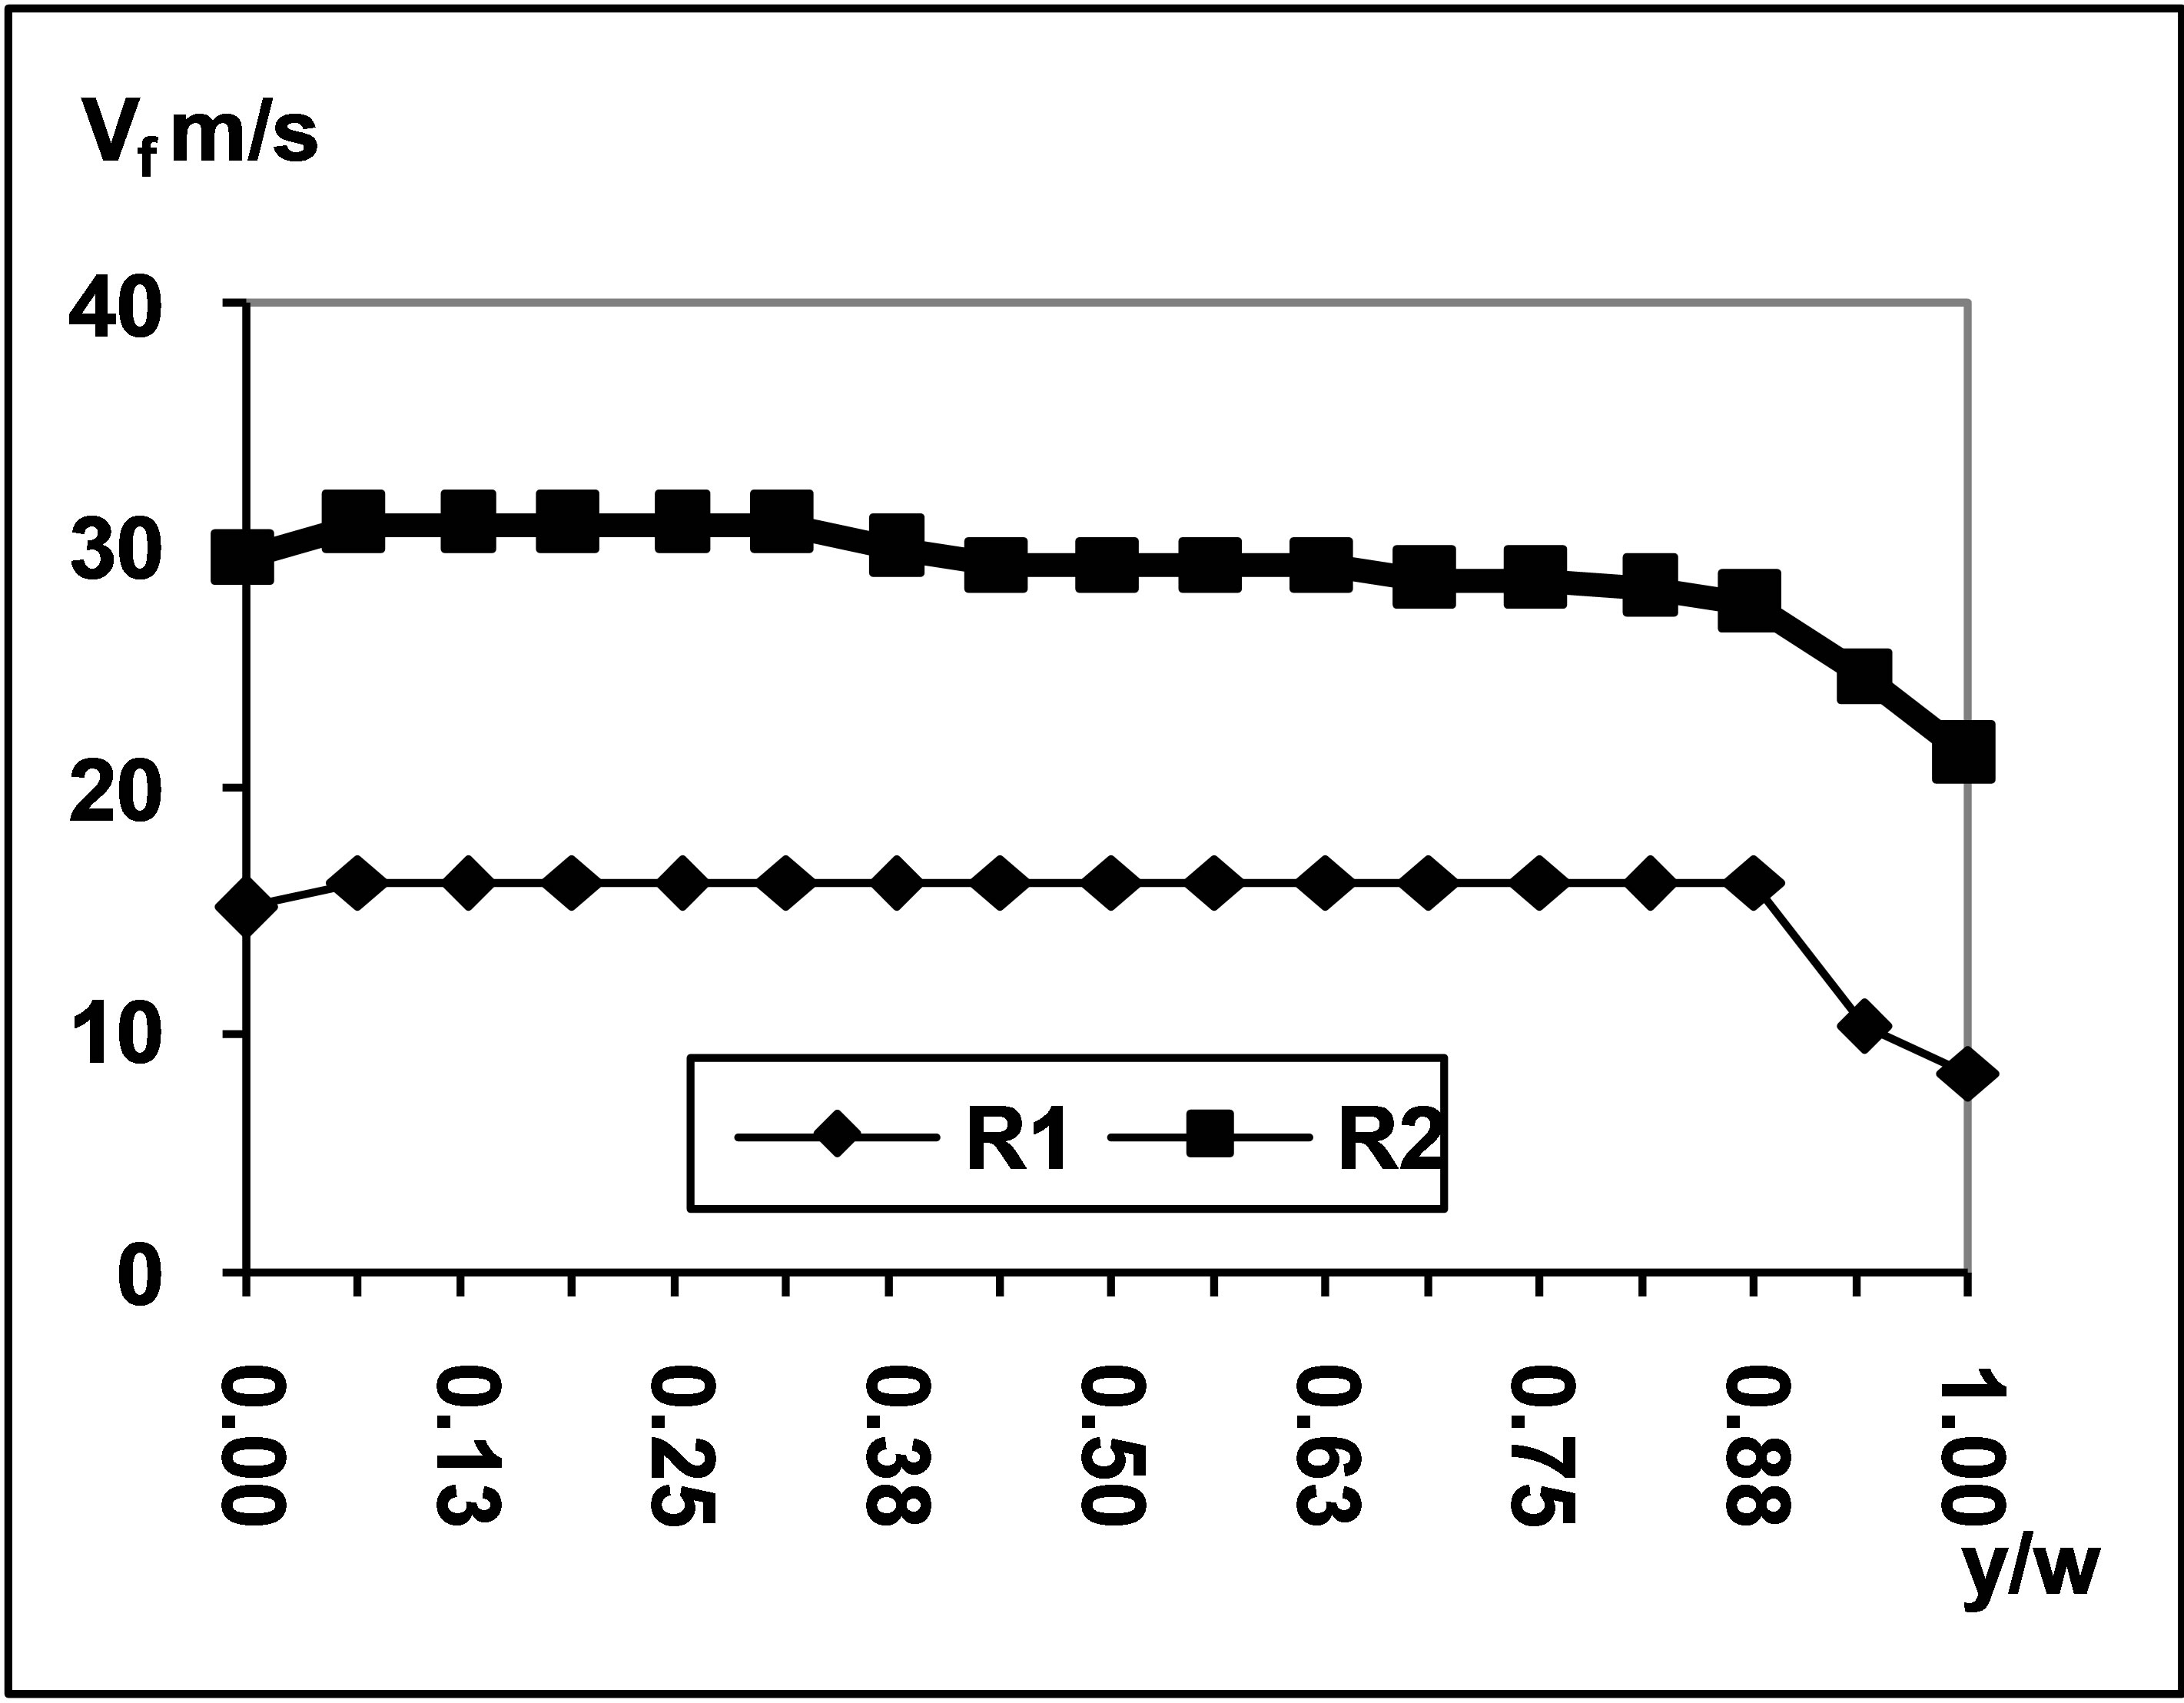
Figure 2. Variation of free stream velocity in the Cascade tunnel R1 = 2.26 × 10⁵ and R2 = 2.52 × 10⁵.
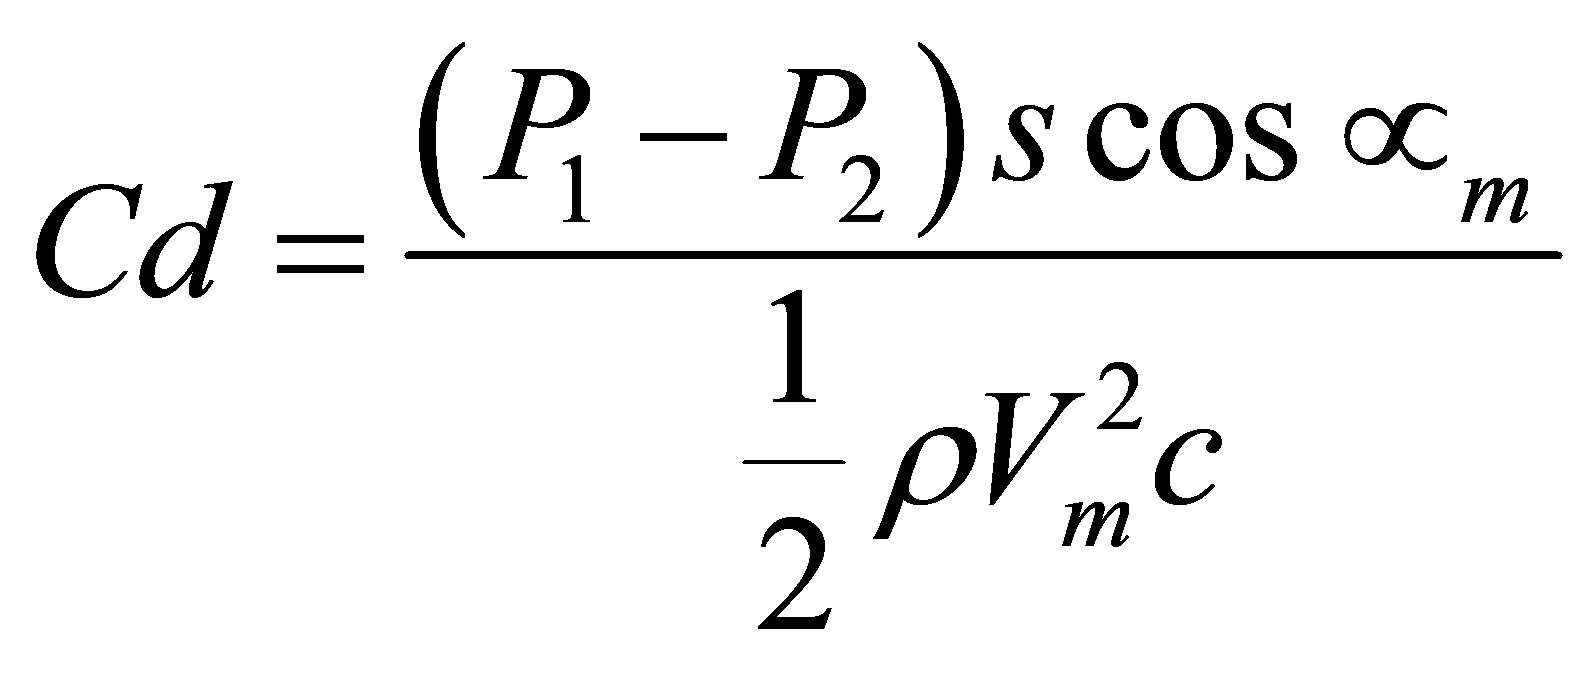
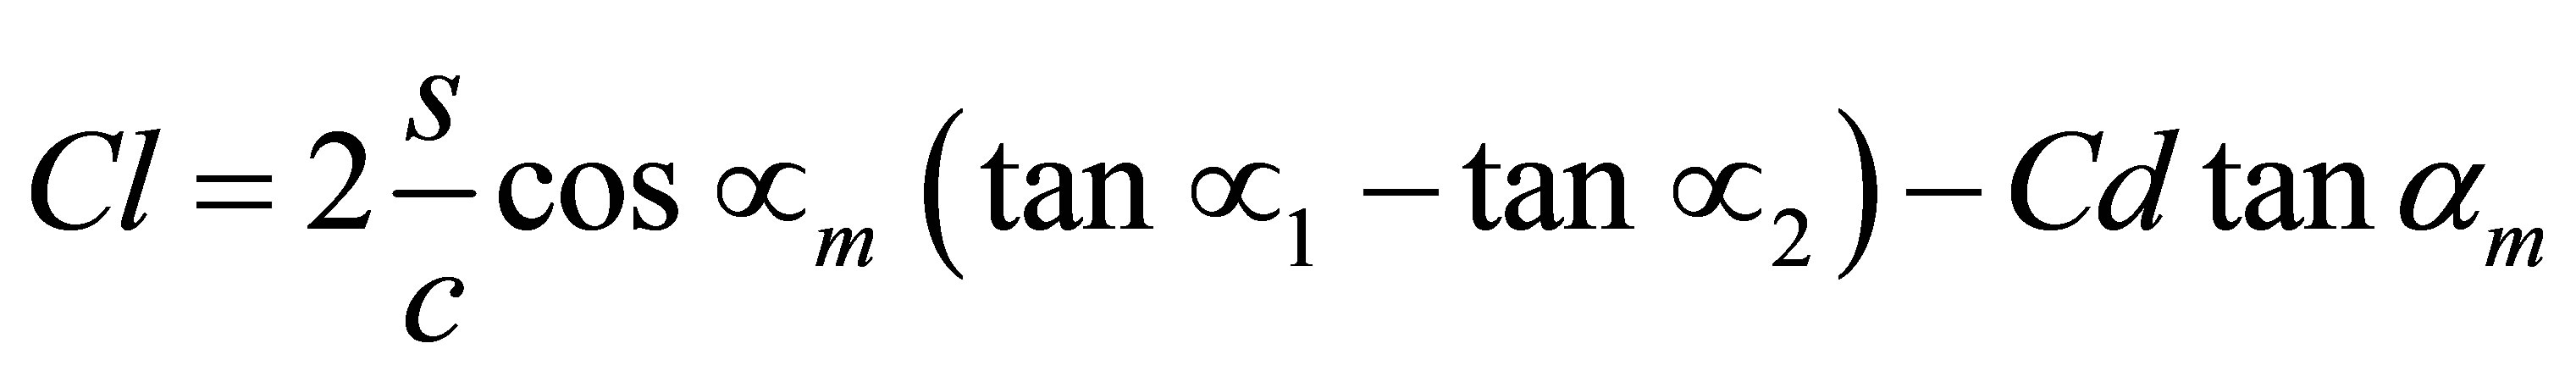
of the central blade of the cascade. The probe output was measured with the help of an inclined water manometer. The different flow and performance variables for the cascade were calculated using two dimensional cascade aerodynamics (3). The incidence angle, i, was calculated as, i = α − β. All other calculation were based on the measurements of the probe though the use of two dimensional theory. The relevant relationships for each parameter is given in the definitions of these parameters in the nomenclature.
Figure 3 reveals the variation the angle of incidence with the blade angle. The angle of incidence is defined as the difference between the flow angle and blade angle at the inlet of the cascade. The blade angle was varied between −10 degrees to 10 degrees. These depict that the angle of incidence decreases with the blade angle at both Reynolds numbers for the cascade. All other flow parameters have been shown as a combined variation of the blade angle and the angle of incidence. This is due to the fact that the variation in a cascade is dependent on blade angle whereas in an isolated blade or aerofoil the dependence is mainly on the angle of incidence or angle of attack. Figure 4 shows the variation of deviation angle with the blade angle and the incidence angle at two Rey-
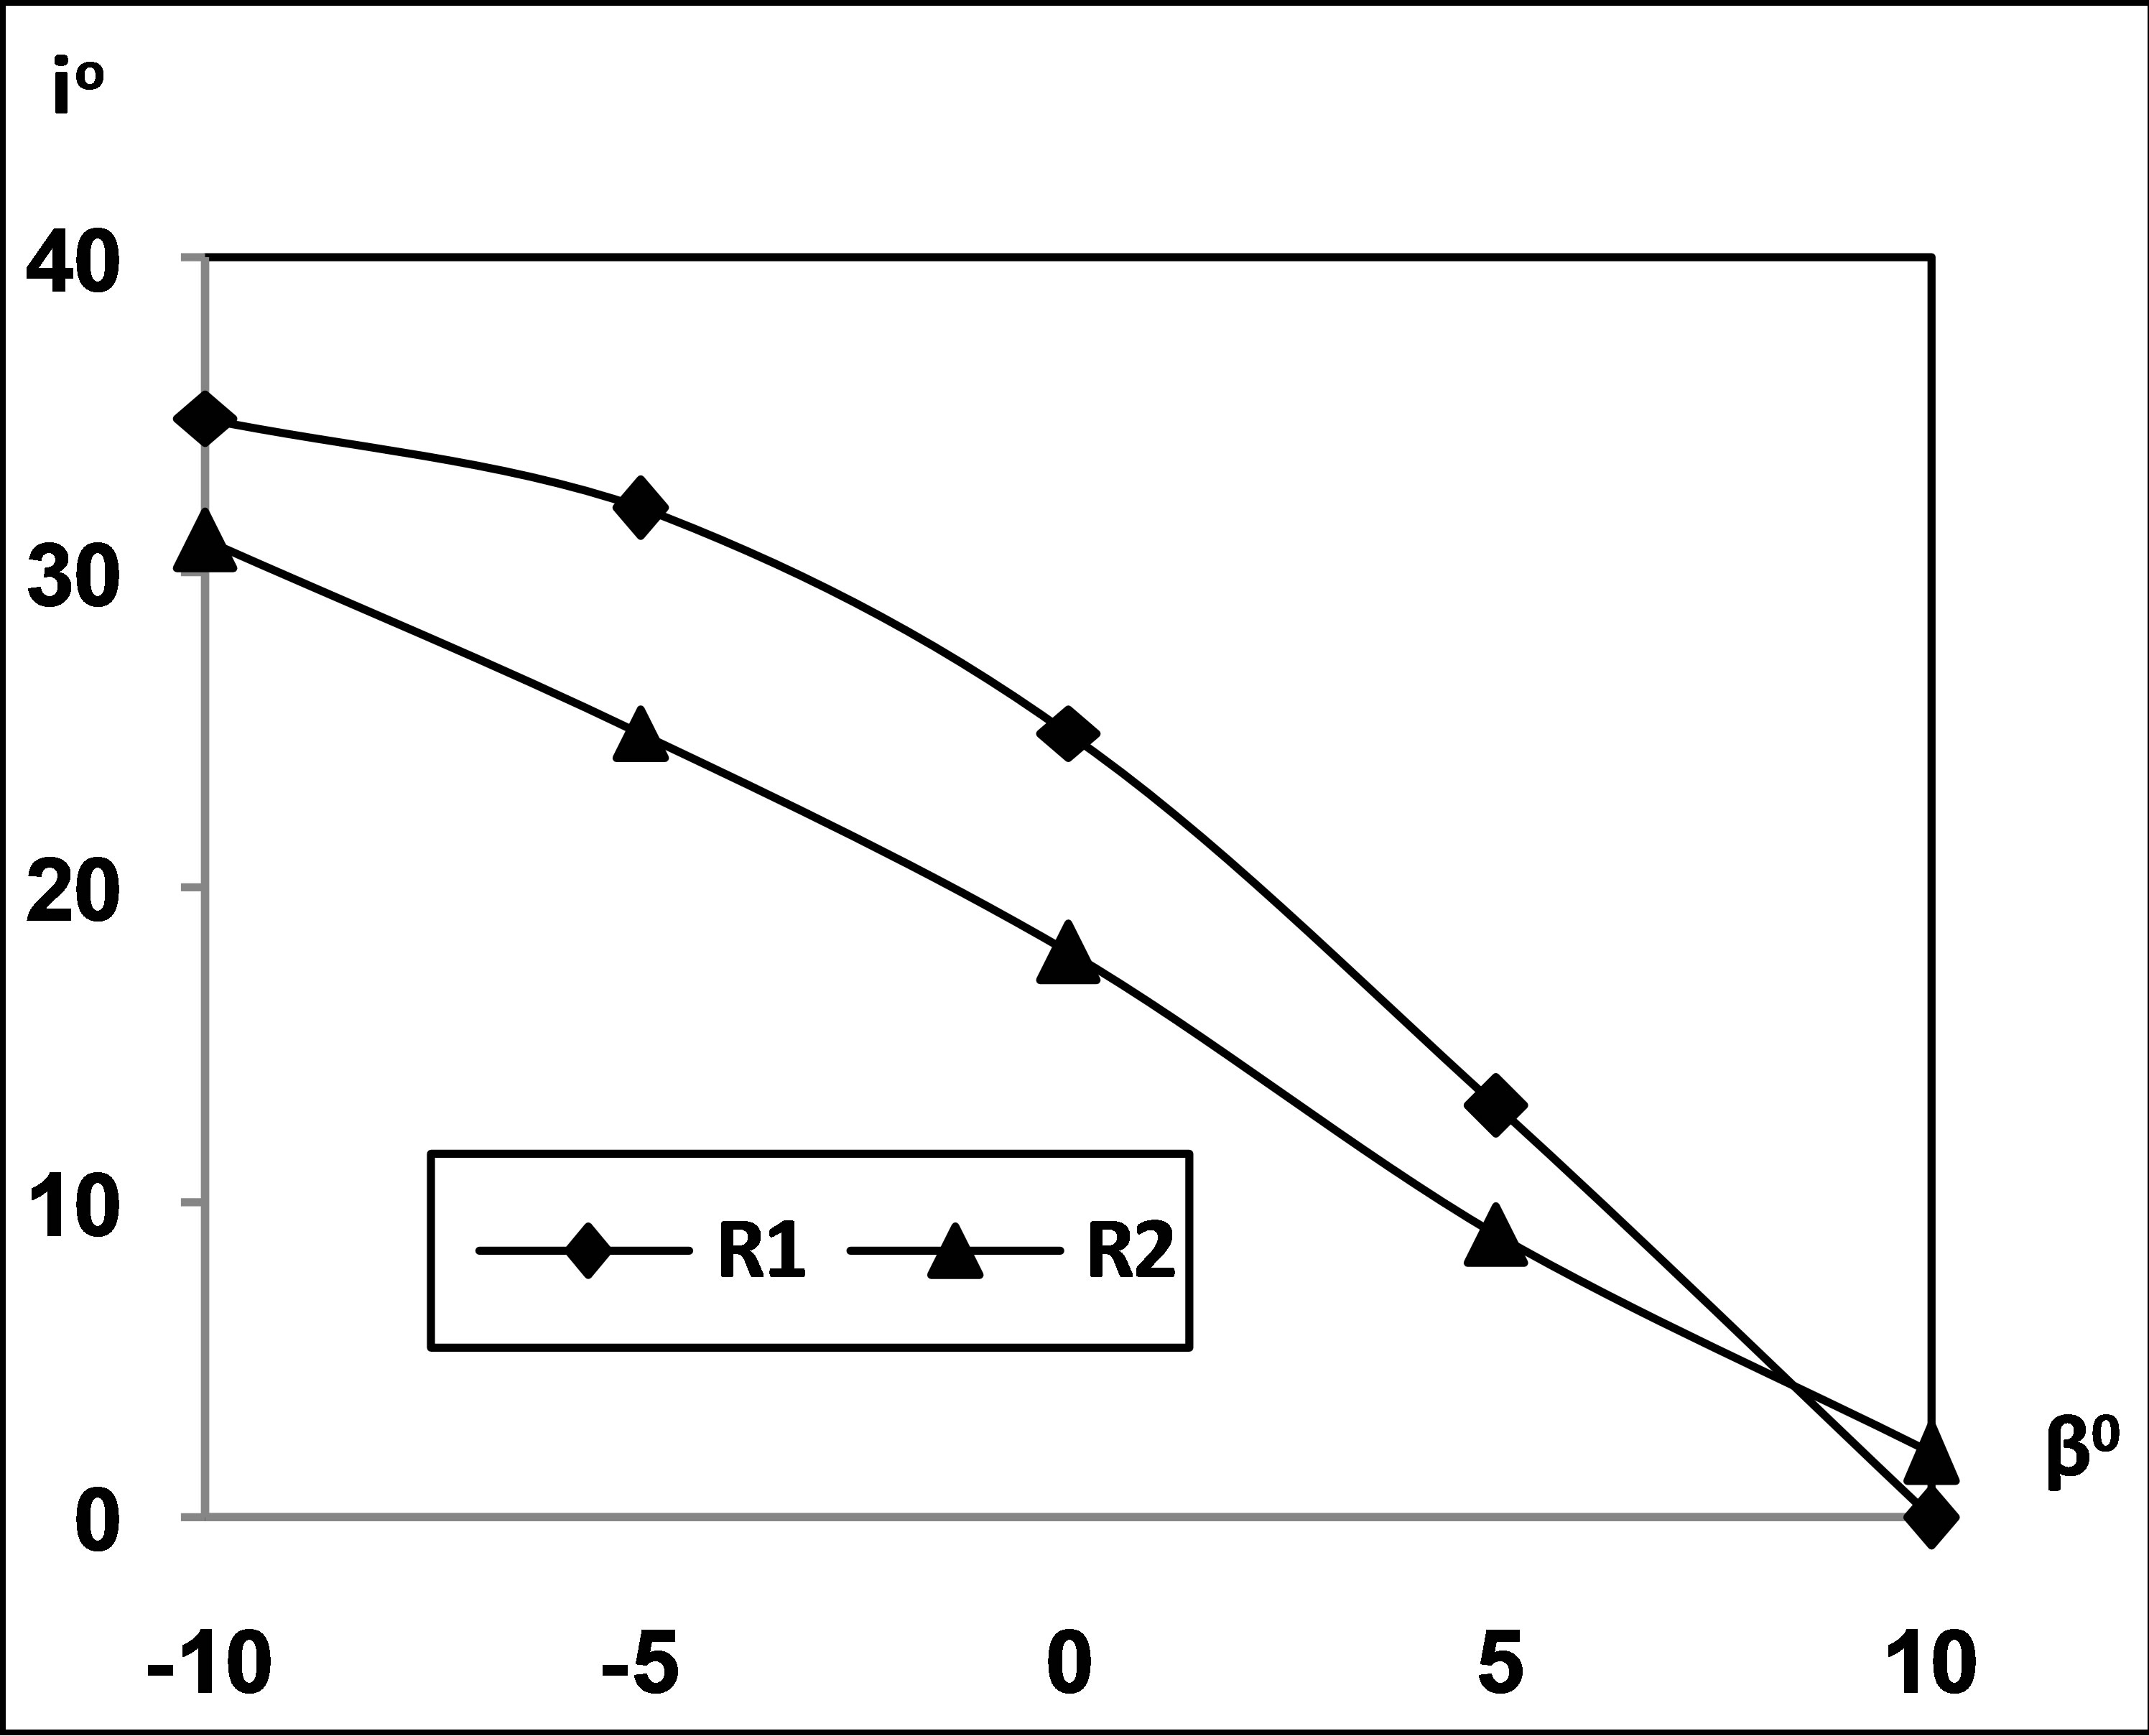
Figure 3. Variation of angle of incidence with the blade angle R1 = 2.26 × 10⁵ and R2 = 2.52 × 10⁵.

Figure 4. Variation of deviation angle with blade angle and angle of incidence. R1 = 2.26 × 10⁵ and R2 = 2.52 × 10⁵.
nolds numbers. The deviation angle is the difference between the flow angle and the blade angle at the exit of cascade row. At lower Reynolds number the deviation angle decrease up to zero blade angle and there after it increases again. At higher Reynolds number it progressively decreases with the blade angle. The deviation at lower Reynolds number is seen to increase with the incidence up to a blade angle of zero and then decreases, A maximum incidence of 35˚ is observed at lower Reynolds number. At higher Reynolds number the deviation increases with incidence and achieves a maximum value of 20˚ for a deviation angle of −8˚. The deviation of the flow is observed to decrease with the increase in Reynolds number and the blade angle. Figure 5 shows the variation of deflection angle with the blade angle and angle of incidence at two Reynolds numbers. The deflection angle is the difference between the flow angles at the inlet and the exit of cascade row. The deflection angle depicts a continuous decreasing trend with the increase in the blade angle and it increases with the increase in the incidence. Further the deflection decreases at higher Reynolds number. Thus flow is found to deflect less at higher blade angles and flow rate.
Variation of static pressure rise coefficient through the cascade is presented in Figure 6. It shows that the varia-
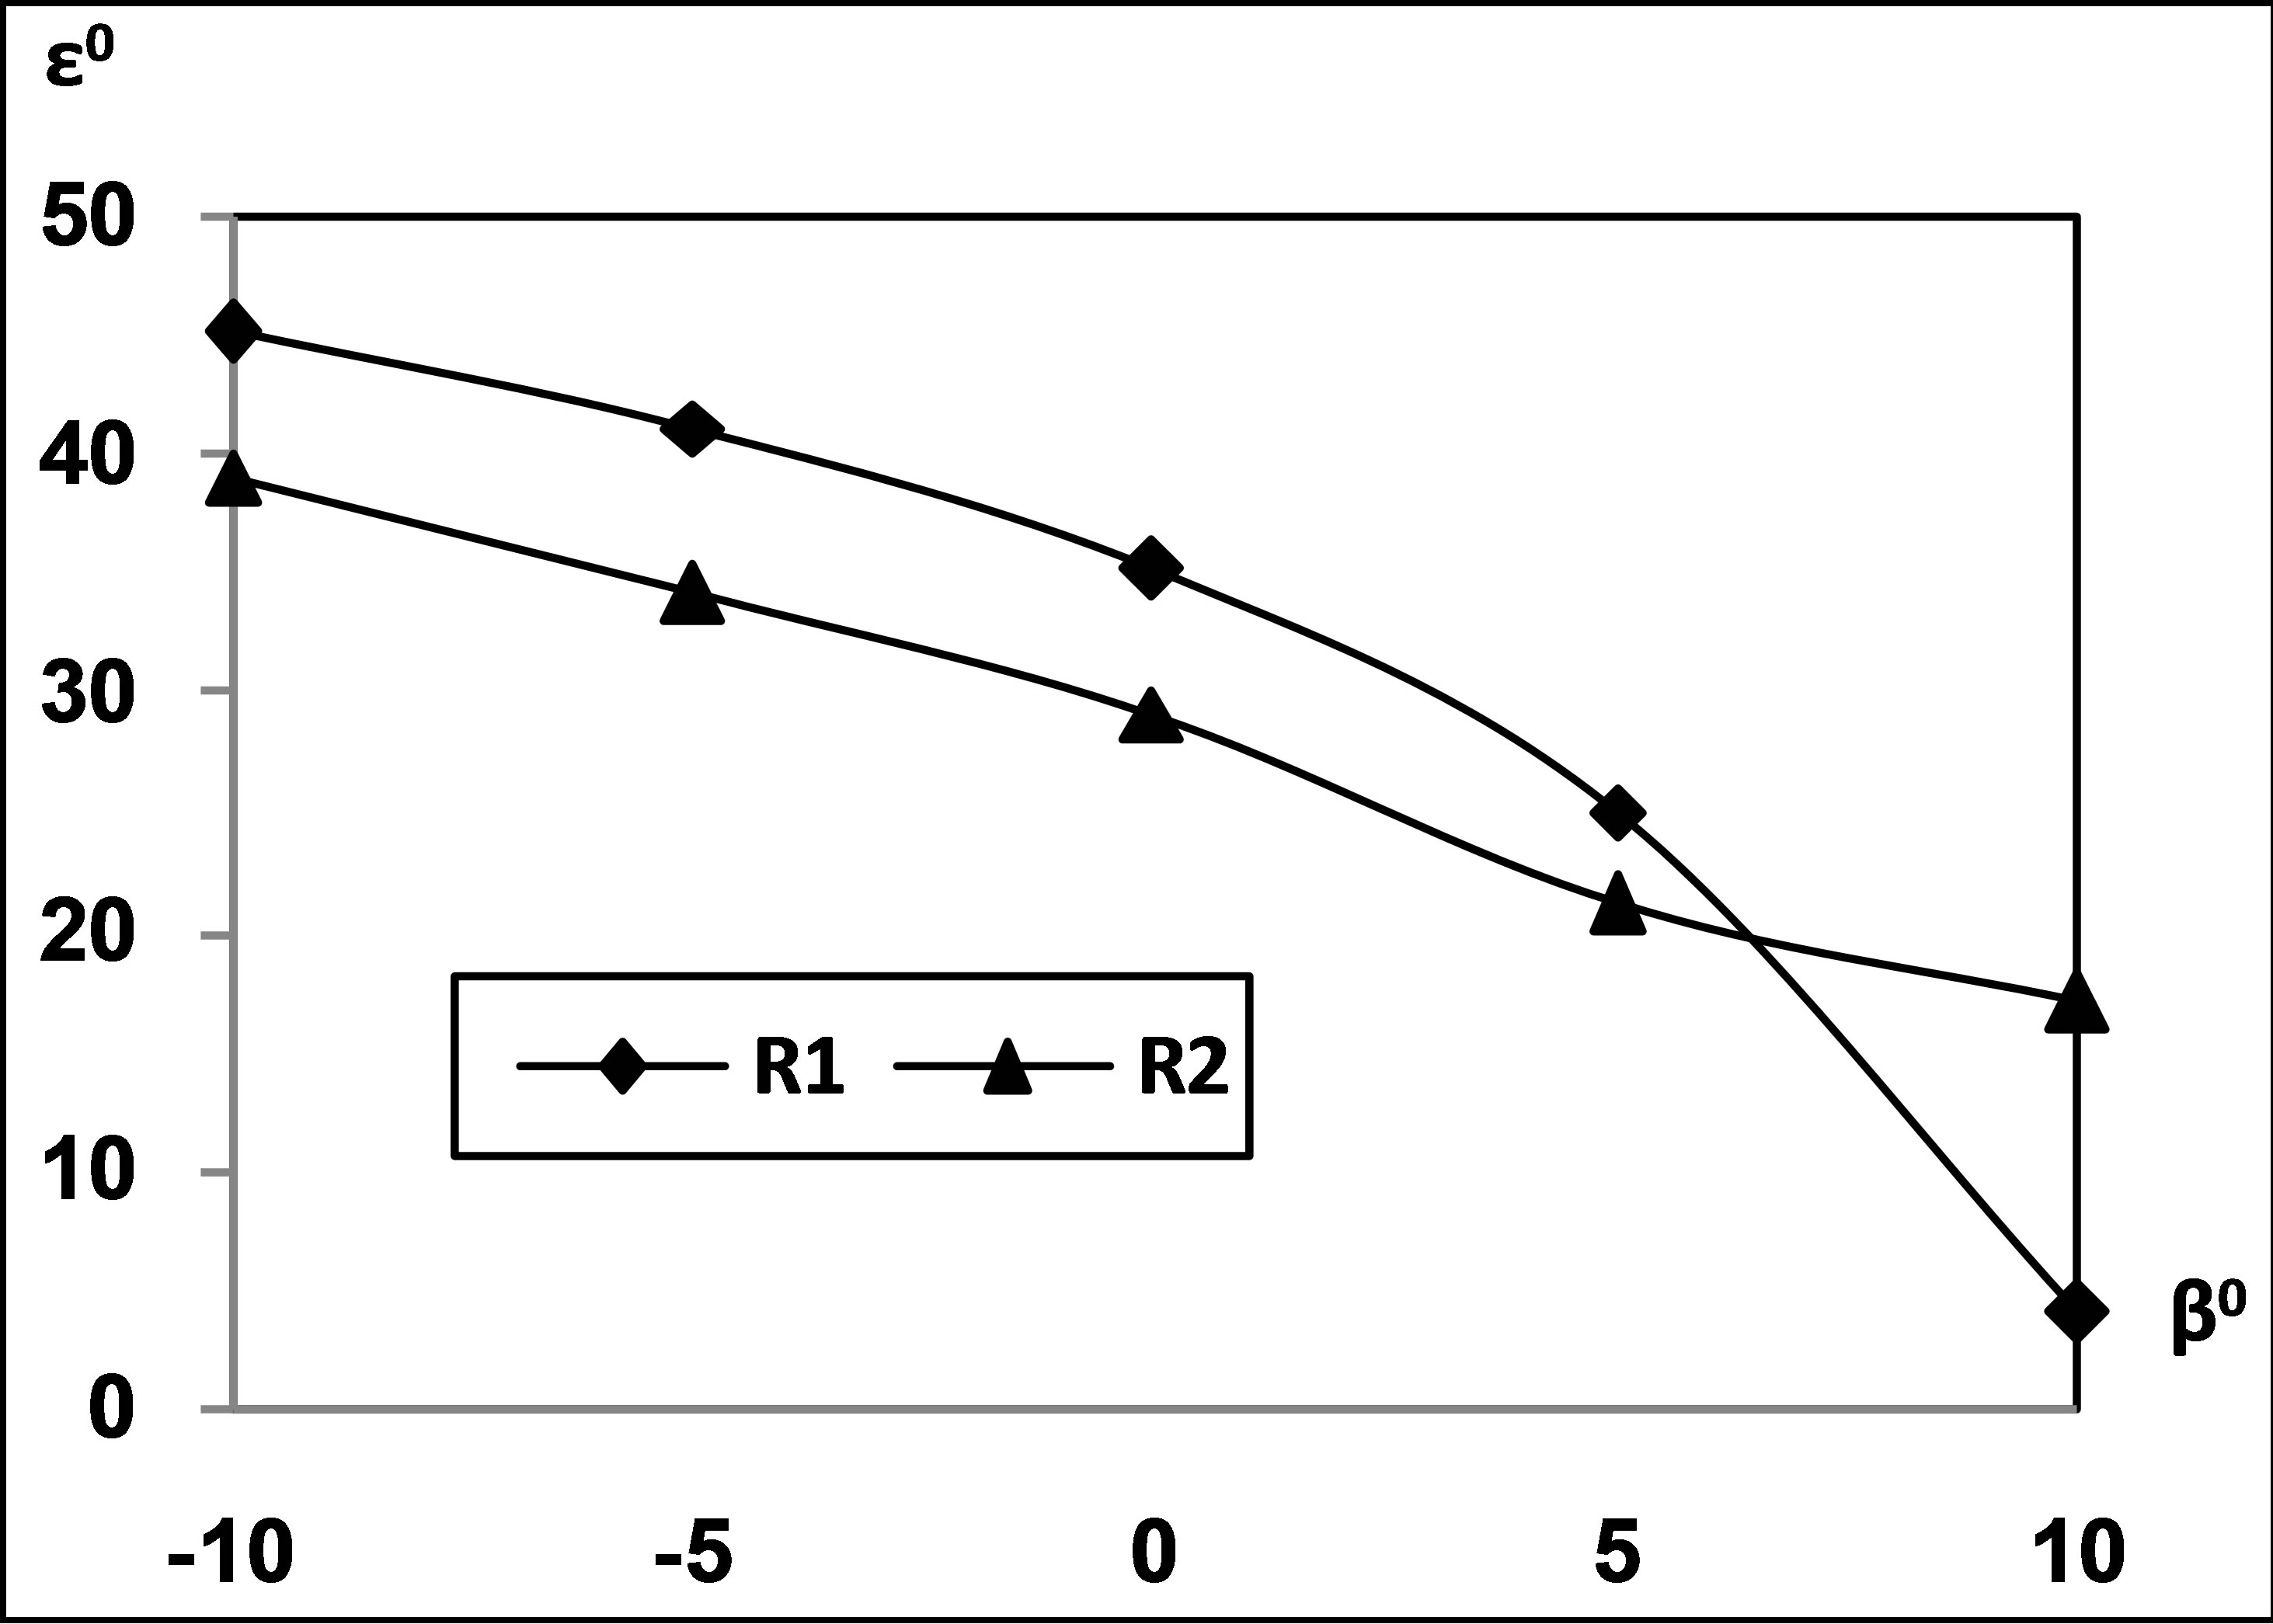
Figure 5. Variation of deflection angle with blade angle and angle of incidence. R1 = 2.26 × 10⁵ and R2 = 2.52 × 10⁵.
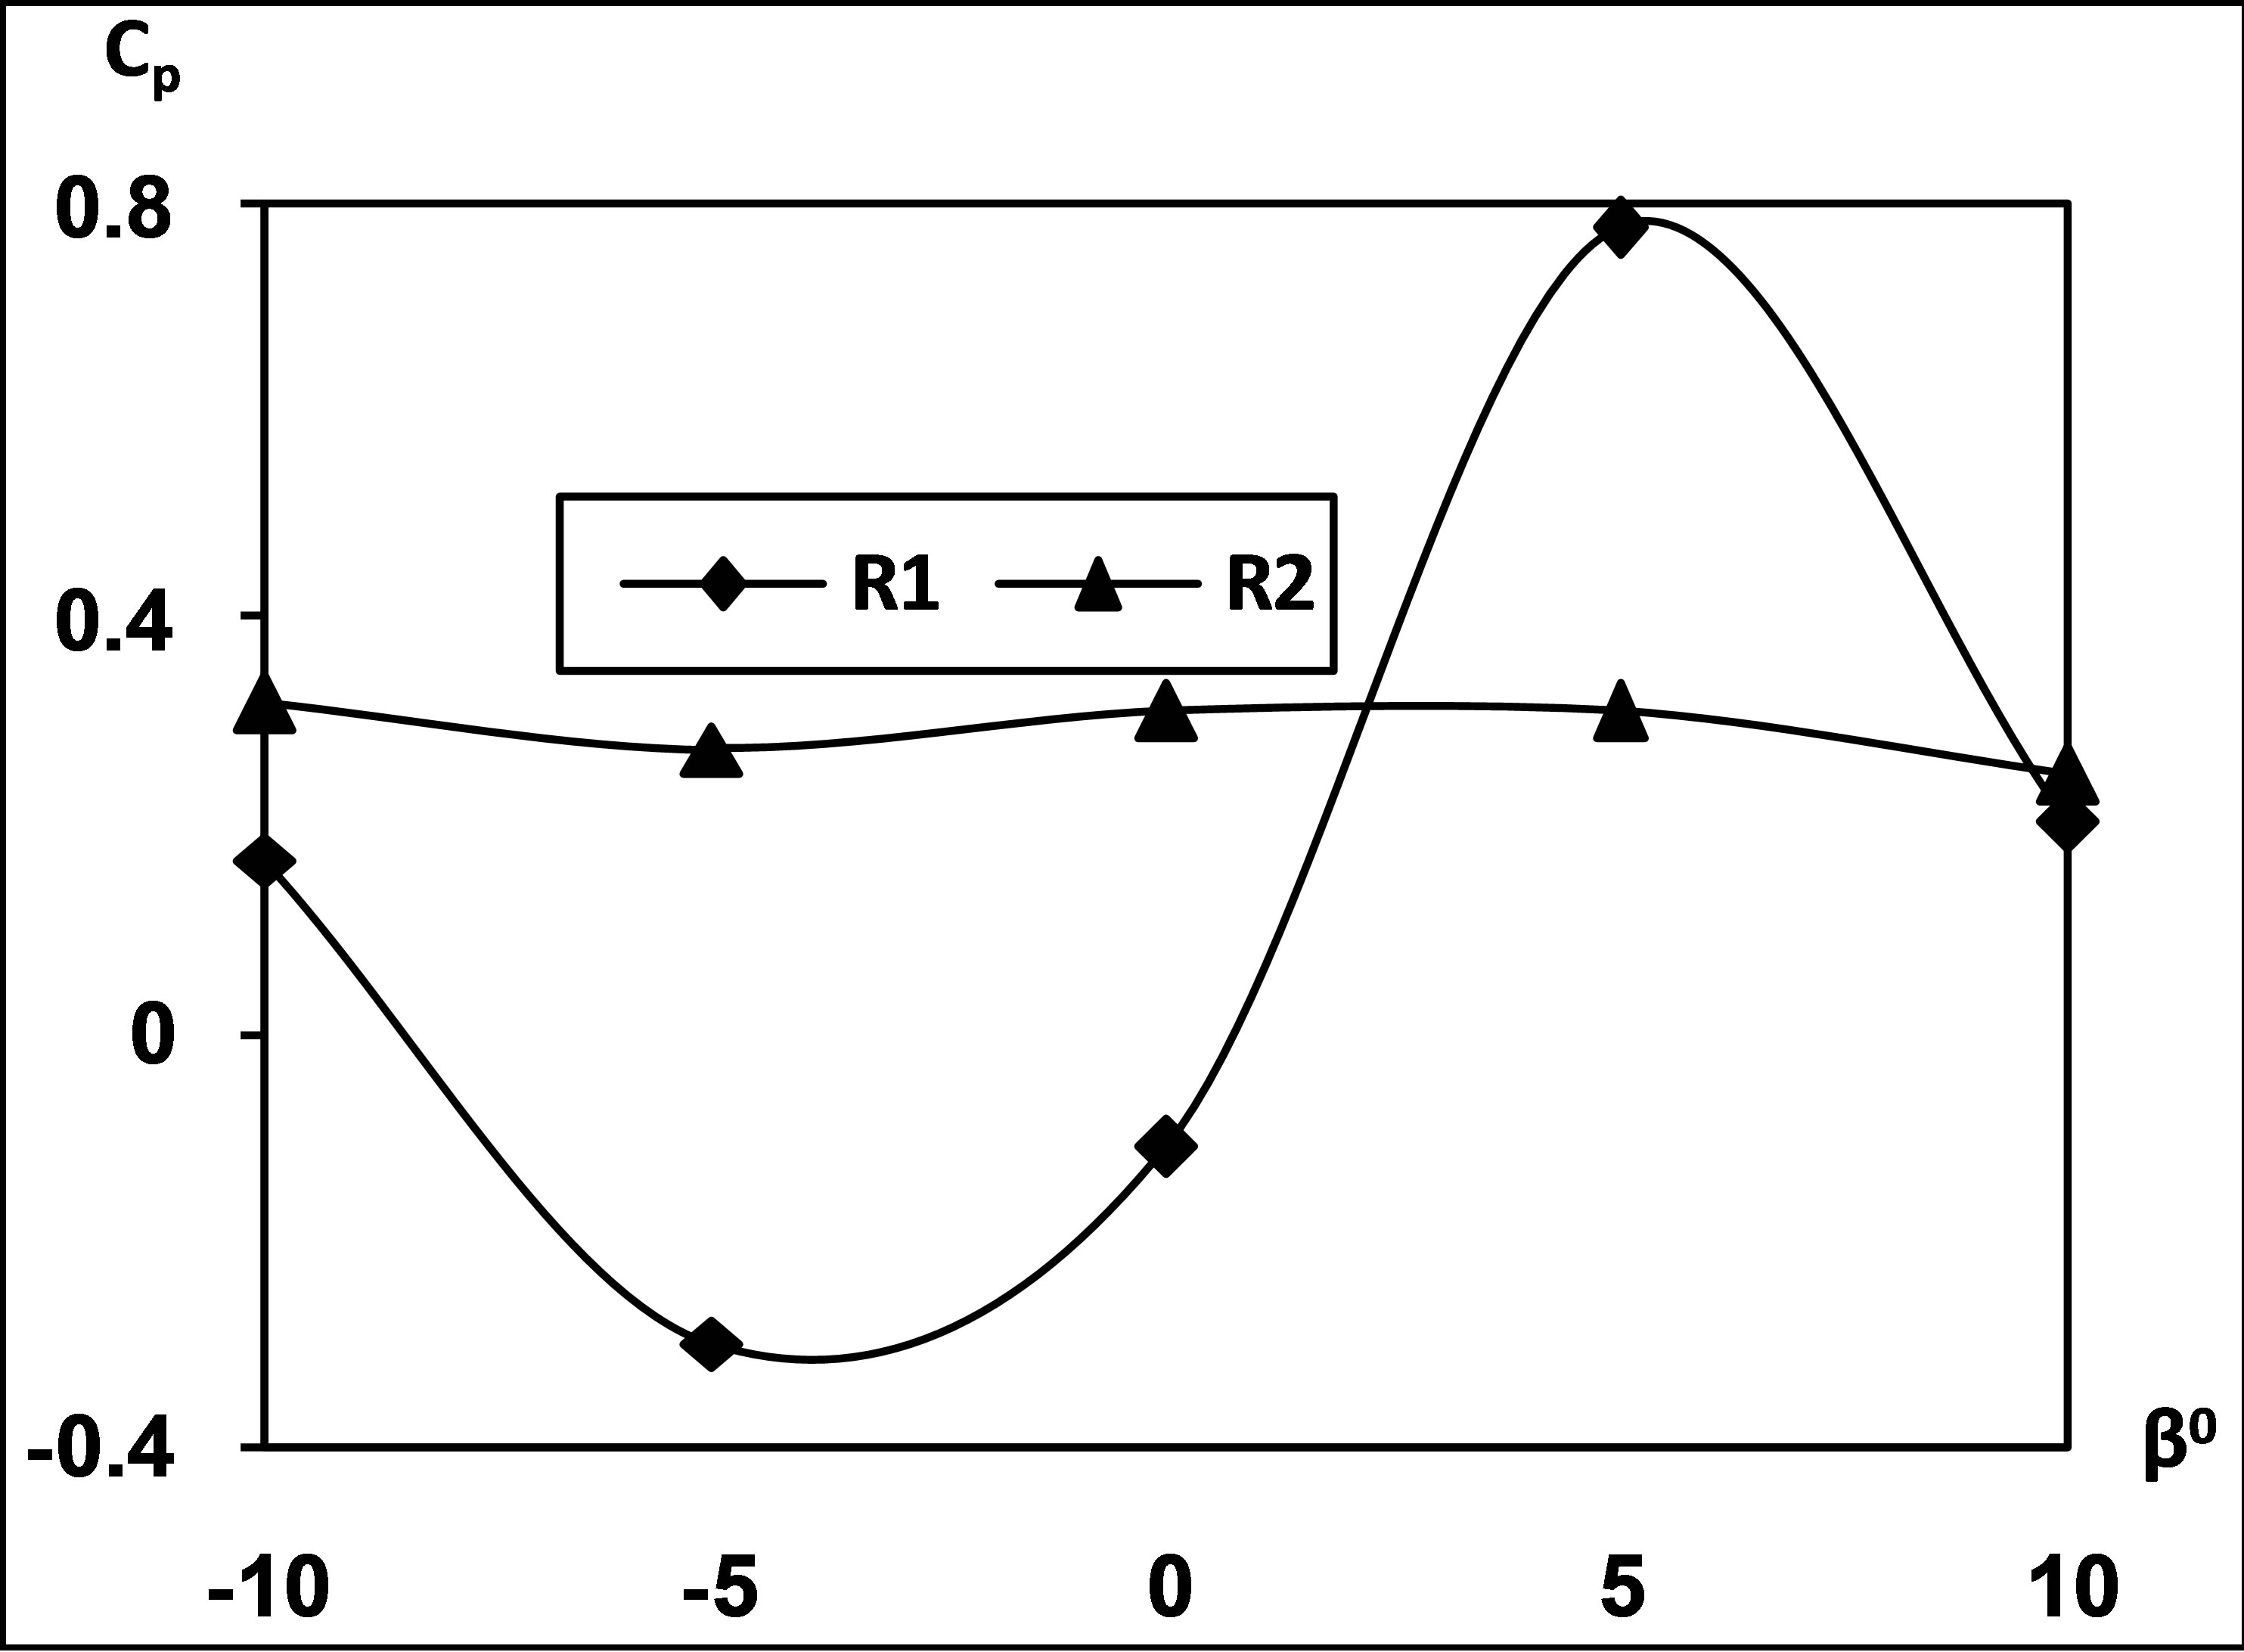
Figure 6. Variation of static pressure rise coefficient with blade angle and angle of incidence. R1 = 2.26 × 10⁵ and R2 = 2.52 × 10⁵.
tion at lower Reynolds number is of a wavy form showing lowest and highest values at blade angles of ±5˚. The value of Cp at +5˚ blade angle is 0.77 where at −5˚ blade angle it is −0.11. At higher Reynolds number a small change is observed in the values of Cp with the change in the blade angle whereas almost no changes are observed with the angle of incidence. The variation of total pressure loss coefficient along the passage through the cascade is presented in Figure 7. At lower Reynolds number the total pressure loss coefficient is minimum at zero blade angle where as it increases both for the positive and negative values of the blade angle. At higher Reynolds number the total pressure loss coefficient is almost invariant with the blade angle. The least changes in the values total pressure loss coefficient is an indicator of stable behavior within the passage that creates such fluid dynamic conditions that give rise to lower flow losses in the cascade passage. A minimum value of total pressure loss coefficient of 0.06 at zero blade angle is observed at lower Reynolds number where as very small loss is depicted at higher Reynolds number. The total pressure loss coefficient is observed to have a minimum value of 0 - 6 at incidences below 10 degrees and it shows two values for the same incidence corresponding to negative and positive values of the blade angle.
Figure 8 presents variation of lift coefficient at two Reynolds numbers for the cascade. The lift coefficient is
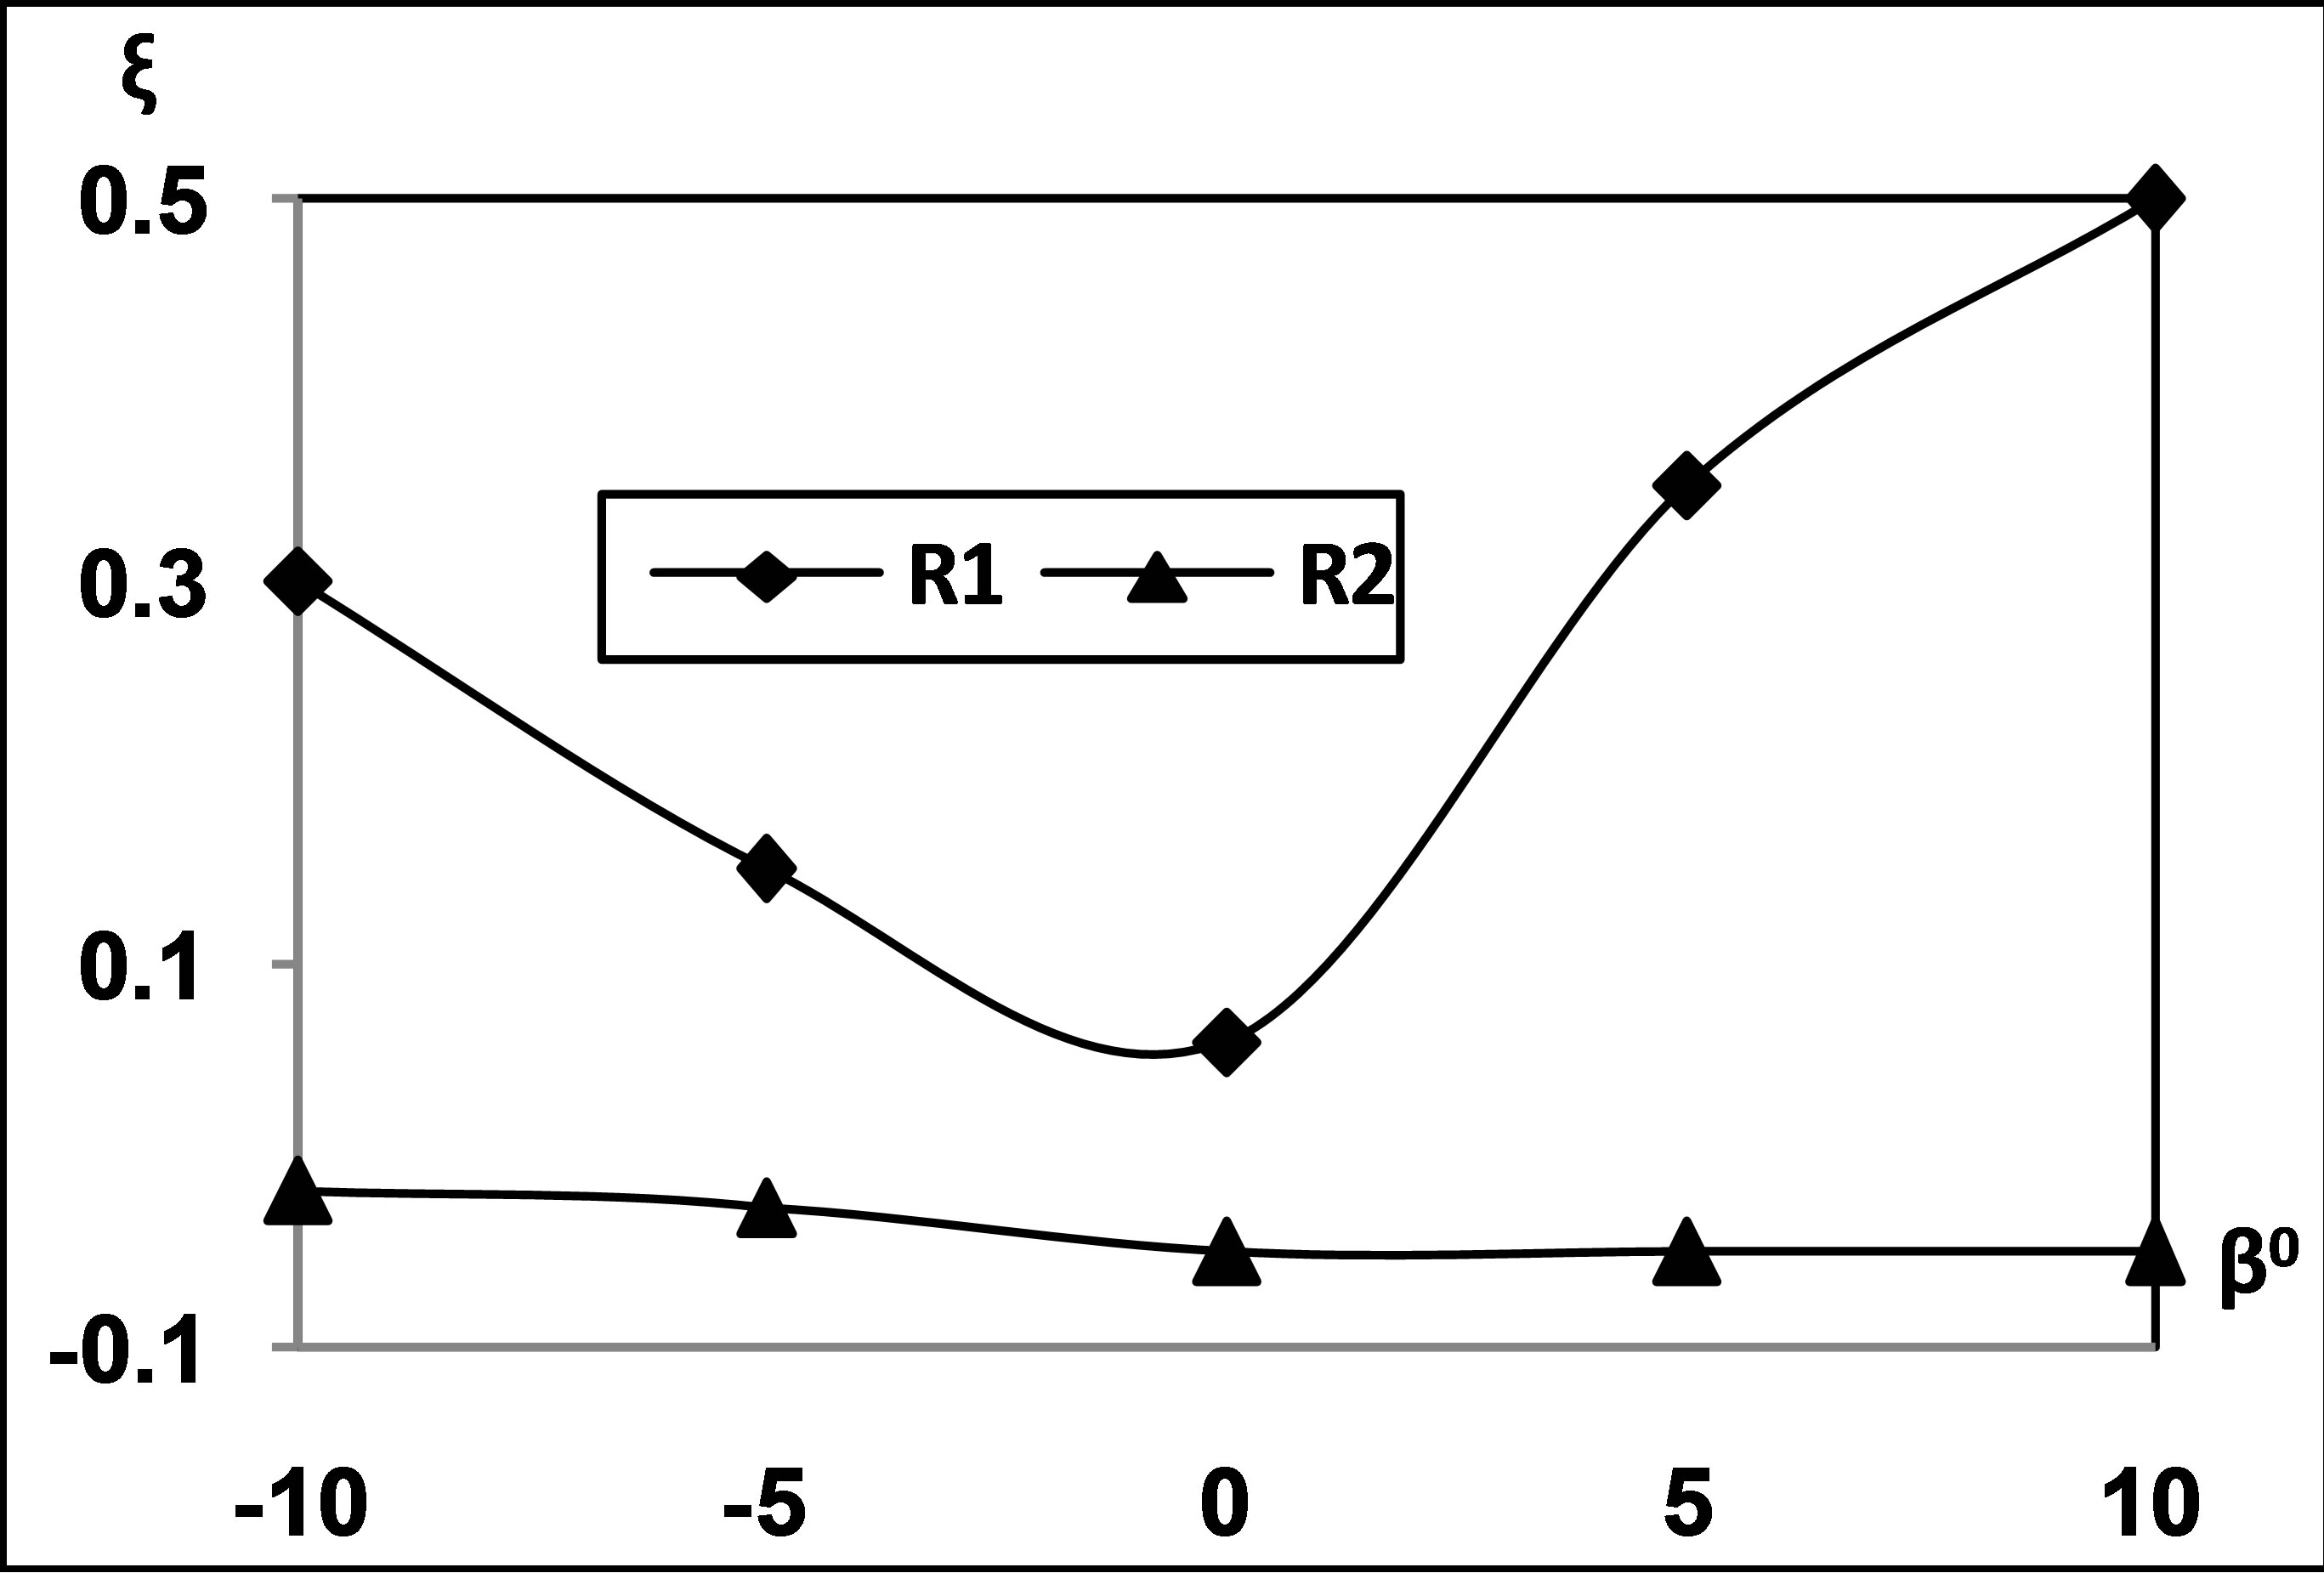
Figure 7. Variation of total pressure loss coefficient with blade angle and angle of incidence. R1 = 2.26 × 10⁵ and R2 = 2.52 × 10⁵.
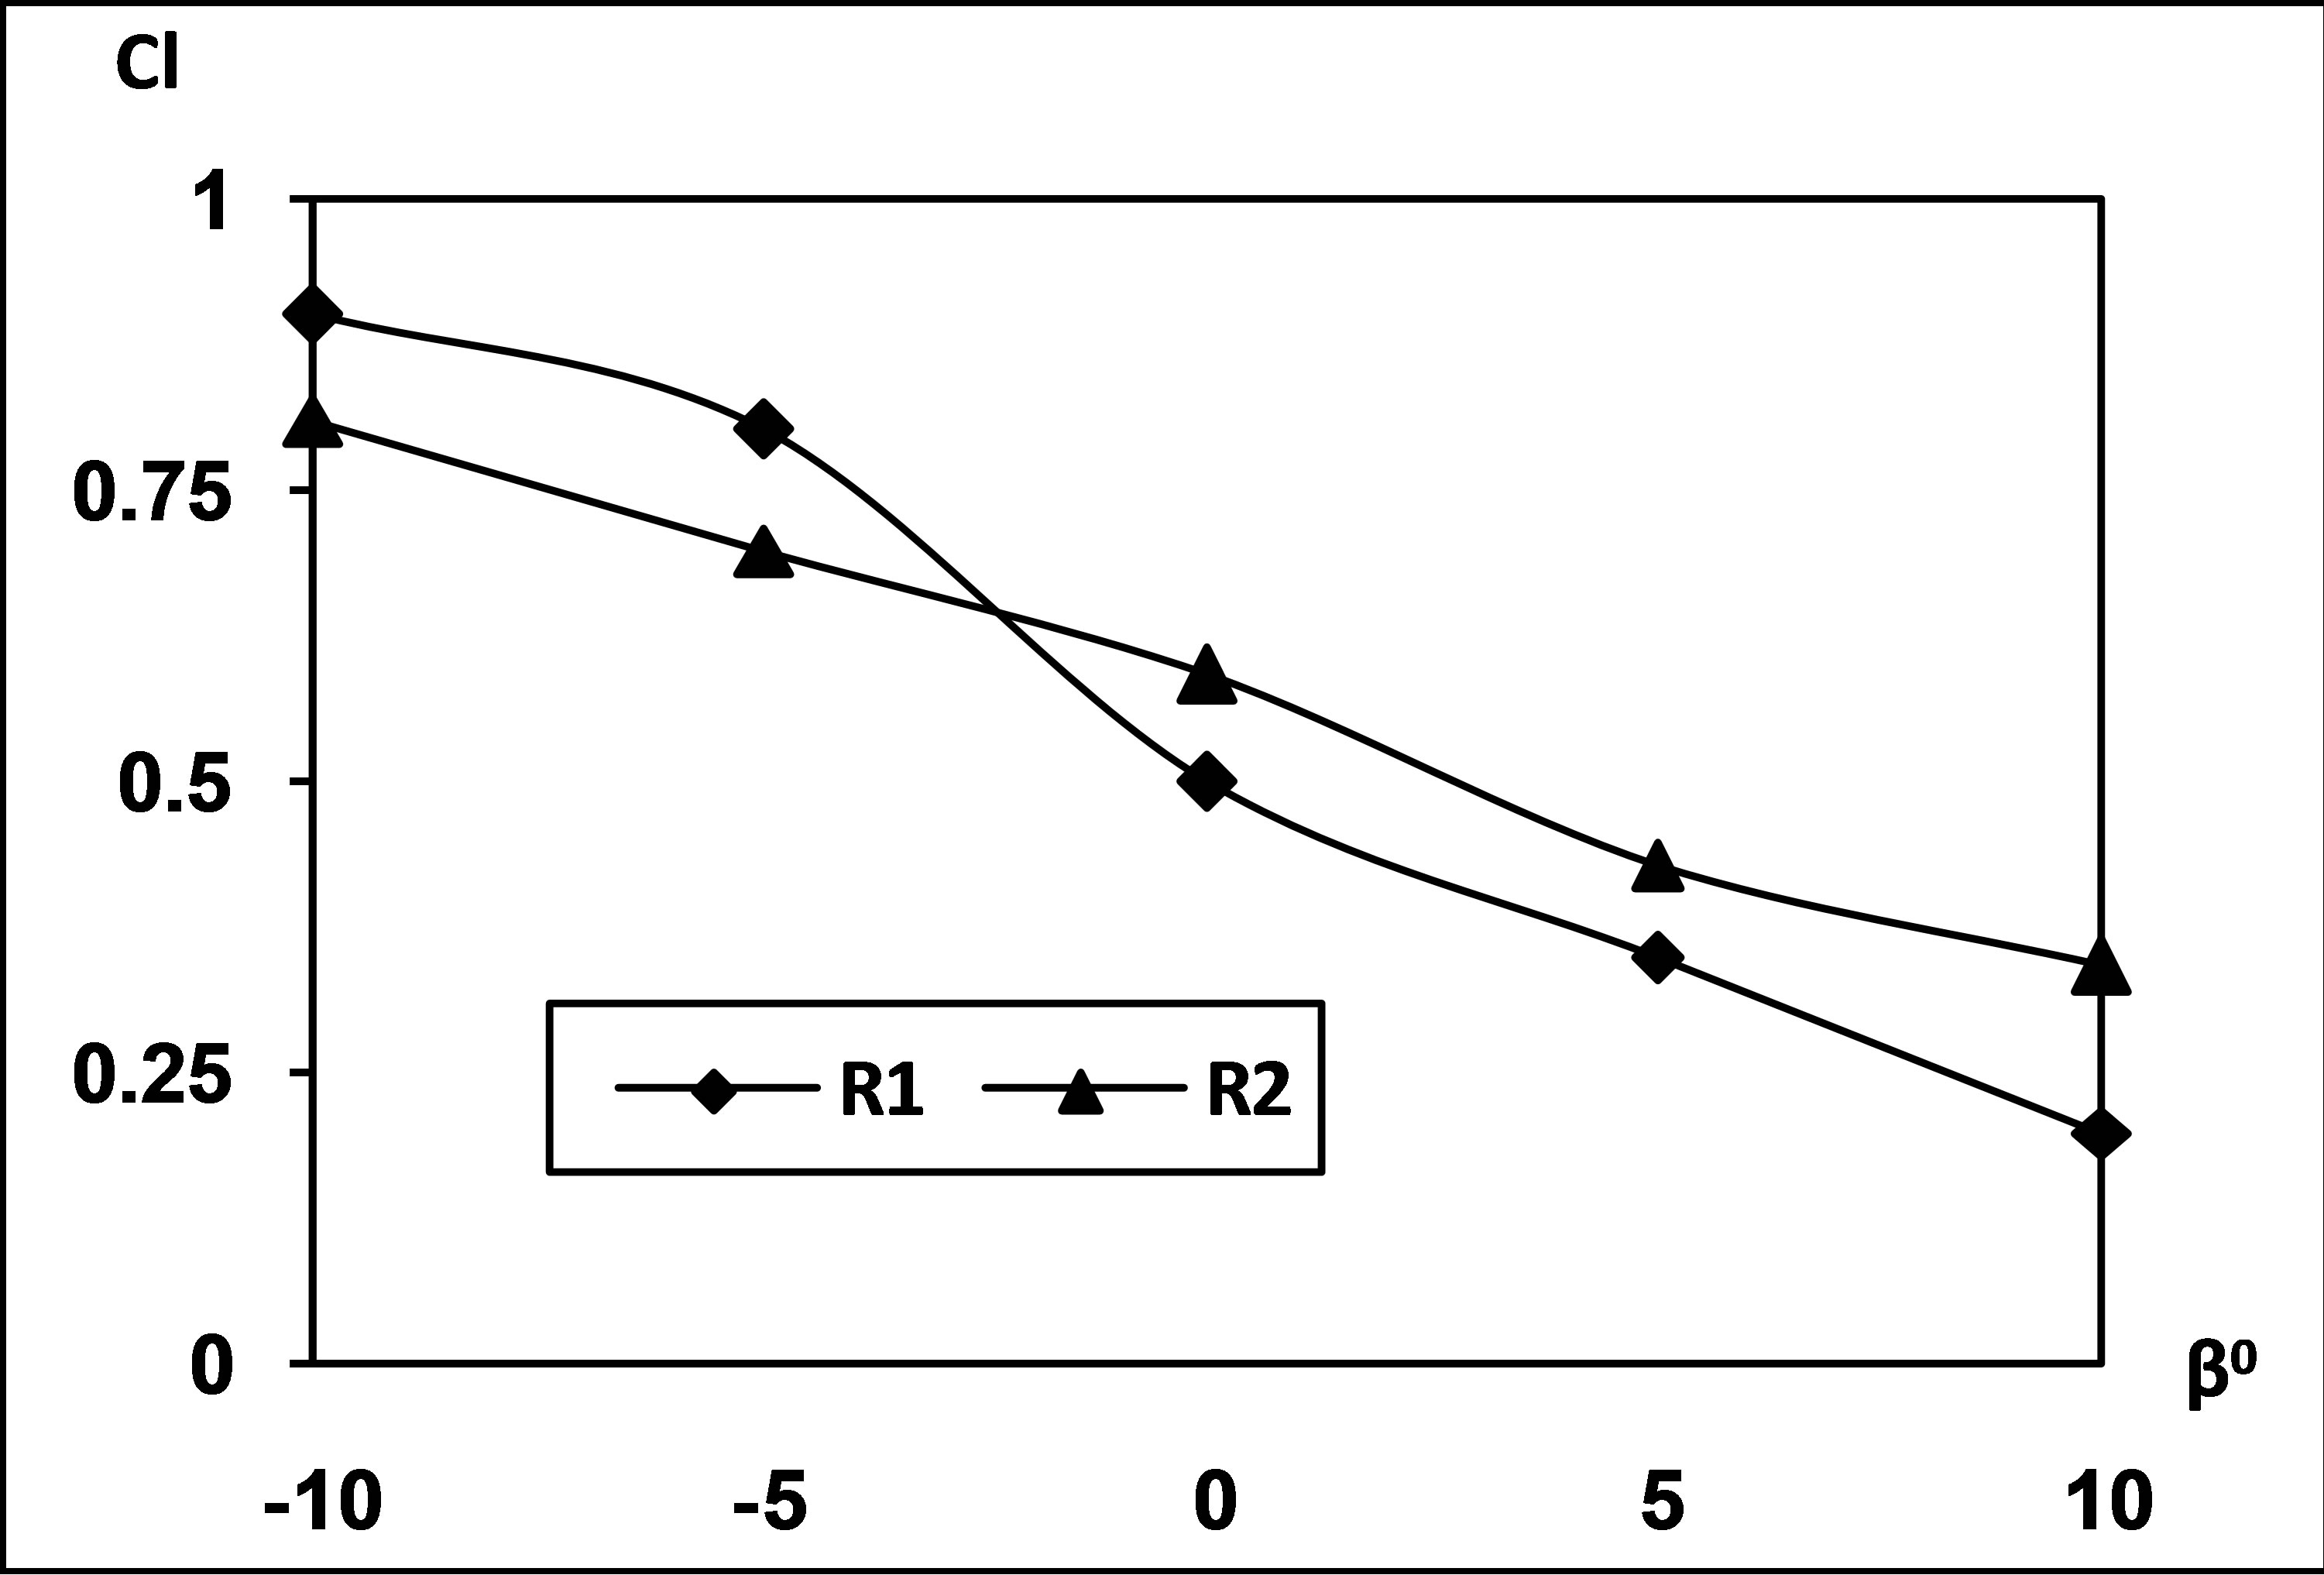
Figure 8. Variation of lift coefficient with blade angle and angle of incidence. R1 = 2.26 × 10⁵ and R2 = 2.52 × 10⁵.
observed to decrease with the blade angle at both the Reynolds numbers. Compared to this the lift coefficient is observed to increase with the incidence. This variation is typical of a linear cascade. Even in case of a flat plate the lift coefficient directly increases with the increase in the incidence. At negative blade angles the lift coefficient is seen to be more at lower Reynolds number this corresponds to the higher values of incidence. The drag coefficient variations of the cascade, shown in Figure 9, indicate that at lower Reynolds number, the drag for the cascade is minimum at zero blade angle and increases as the blade angle gets altered from that blade angle in a parabolic manner. At that instance the incidence is about 14˚. As the incidence increases the drag coefficient achieves twin relations. First in the range of decreasing negative blade angles where drag coefficient increases with the incidence and the next where drag coefficient decreases with the incidence which corresponds to the increasing positive blade angles. But at higher value of Reynolds number the drag coefficient is almost invariant with blade angle for all the configurations. It is obvious that drag will be minimum at zero blade angle because at that time the blocked area in the tunnel is minimum and as blocked area is altered the drag coefficient gets changed. Thus the drag coefficient blade angle and the incidence are interrelated to each other.
A comparison of the main performance parameters like lift coefficient and drag coefficient was carried out with different published empirical results for a flat plate with no distortion case. Lanzafame, et al. [13] have obtained the following empirical formula for the lift coefficient and the drag coefficient.
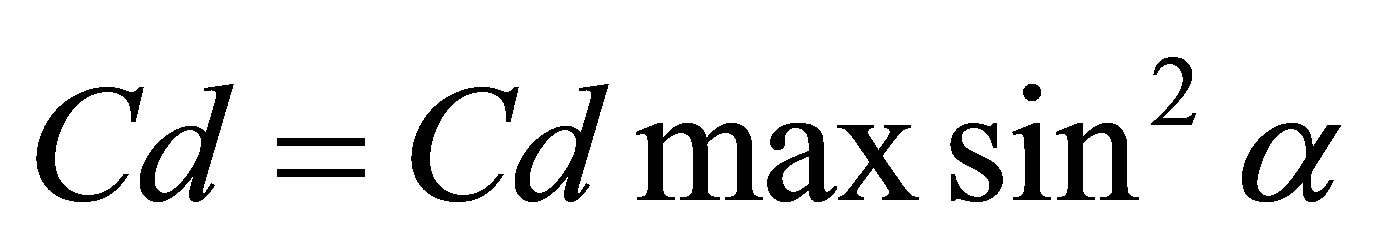 . For a flat plate
 , ref [10]
 where
where , ref [10]
Using this empirical result the comparison between achieved results and theoretical results is presented in Figure 10 for drag coefficient. The results depict that the measured drag is more than that obtained from the theory. It is due to the fact that the theory considers only a single
Figure 9. Variation of drag coefficient with blade angle and angle of incidence. R1 = 2.26 × 10⁵ and R2 = 2.52 × 10⁵.
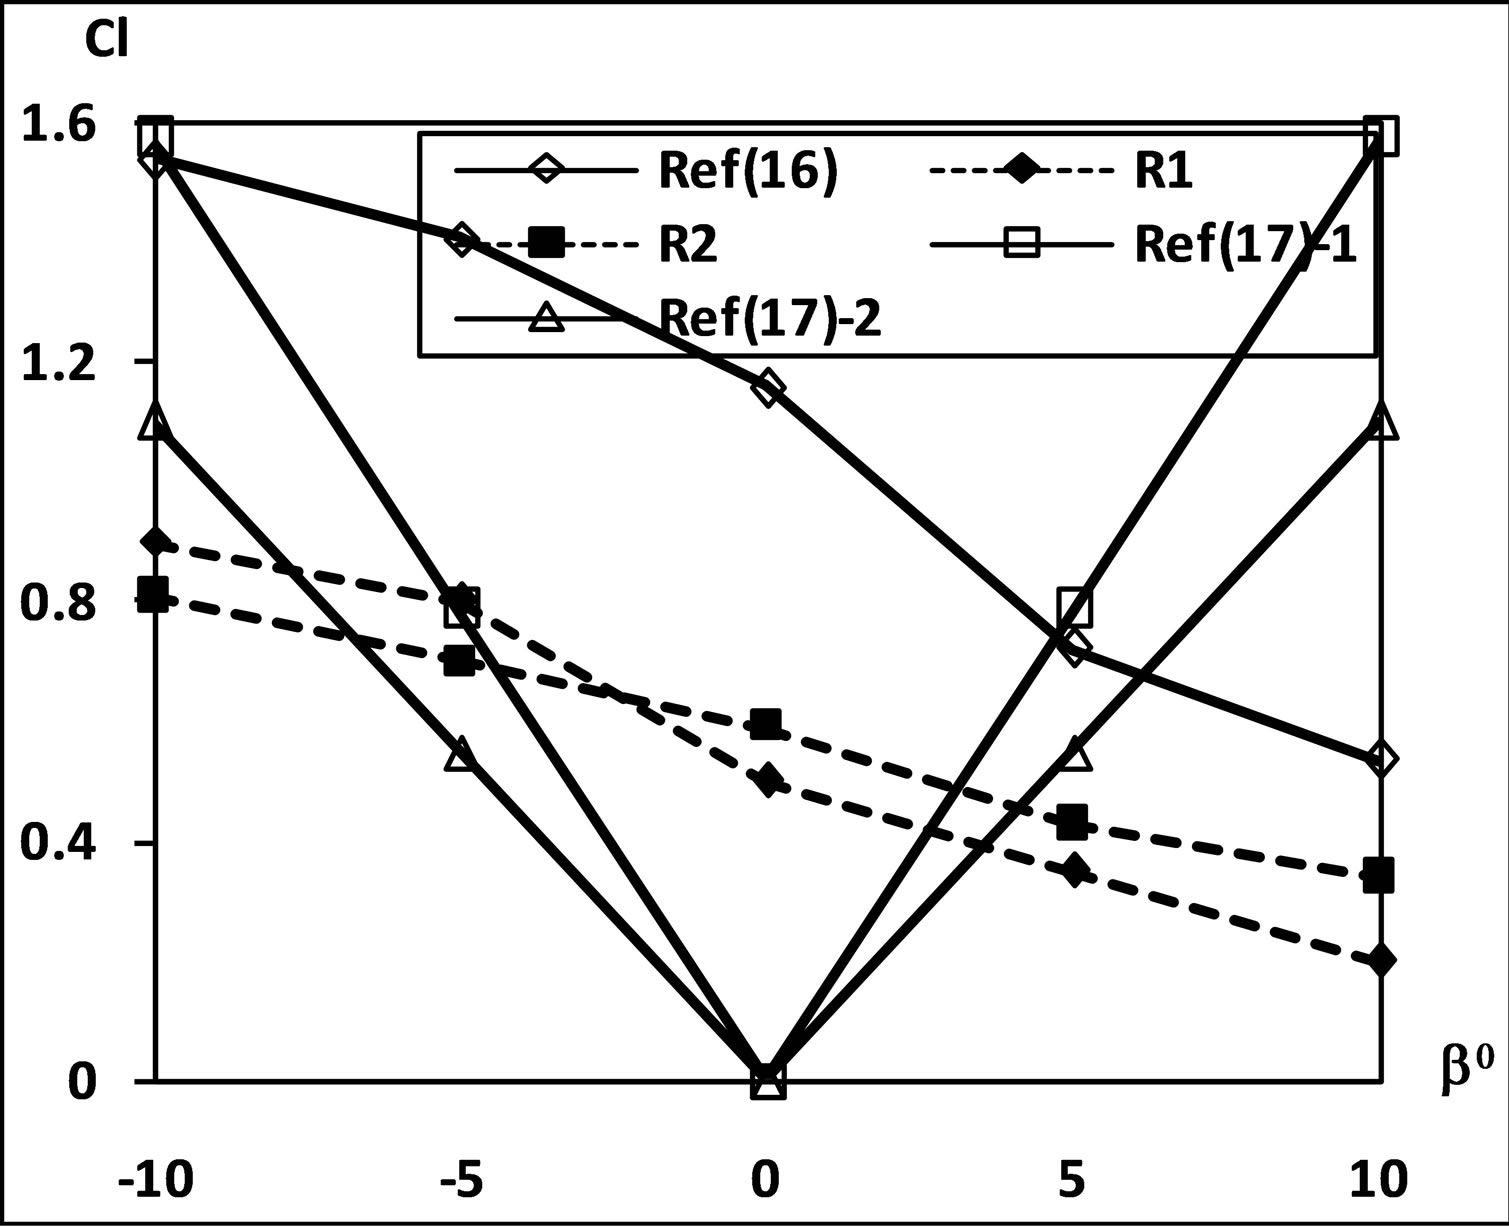
Figure 10. Comparison of experimental and theoretical lift coefficient R1 = 2.26 × 10⁵ and R2 = 2.52 × 10⁵.
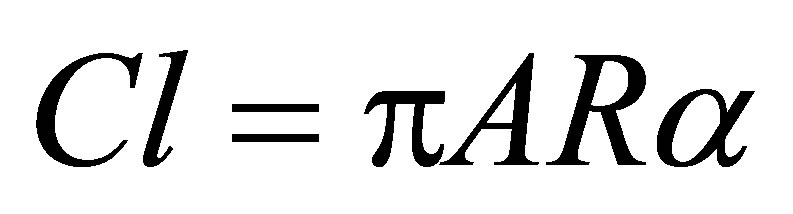
plat in a infinite control volume that is unaffected by the presence of other elements of the cascade and the tunnel wall boundaries. Comparative lift coefficient variations are presented in Figure 11. This figure also shows that the experimental values of lift coefficient are lesser than the theoretical values of the lift coefficient. The reasoning for this result is also that the theoretical results represent a flat plat aerodynamics in an infinite space which is not true for the cascade. A comparison of the results has also been made with the momentum theory and lifting line theory [14] for a flat plate. The lift coefficient and drag coefficient by these theories are given as under.
Lifting Line theory

Momentum theory
The drag in both cases is given as
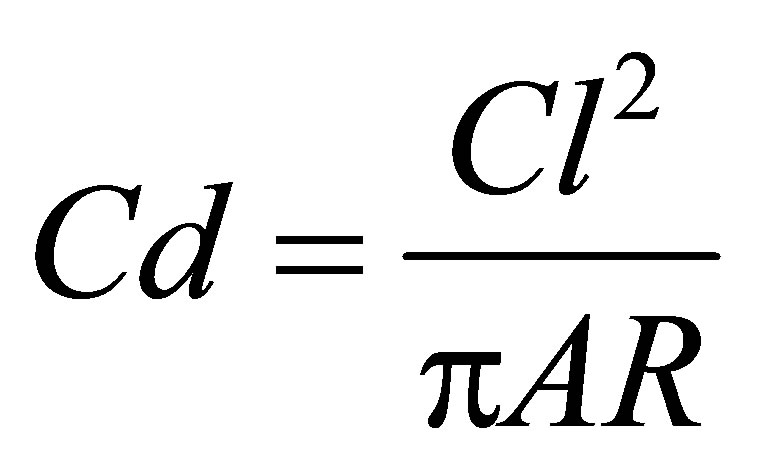
where AR is aspect ratio of the cascade = b/c.
The comparison of these results also shows that the theoretical values of lift coefficient are higher than the experimental values whereas theoretical drag coefficients are lower than the experimental values. This difference is because of the fact that a flat plate behaves differently when it is placed in infinite surroundings rather than as a part of a cascade. It may be added here that the lift coefficient and drag coefficient are basically dependent both on the blade angle and the angle of incidence. \this is illustrated in the Figures 12 and 13. It may be seen that these figure show similarity with the Figures 8 and 9. It is because the angle of incidence is dependent on blade angle through the flow angle.
4. Conclusion
A blow down cascade tunnel facility for testing cascades
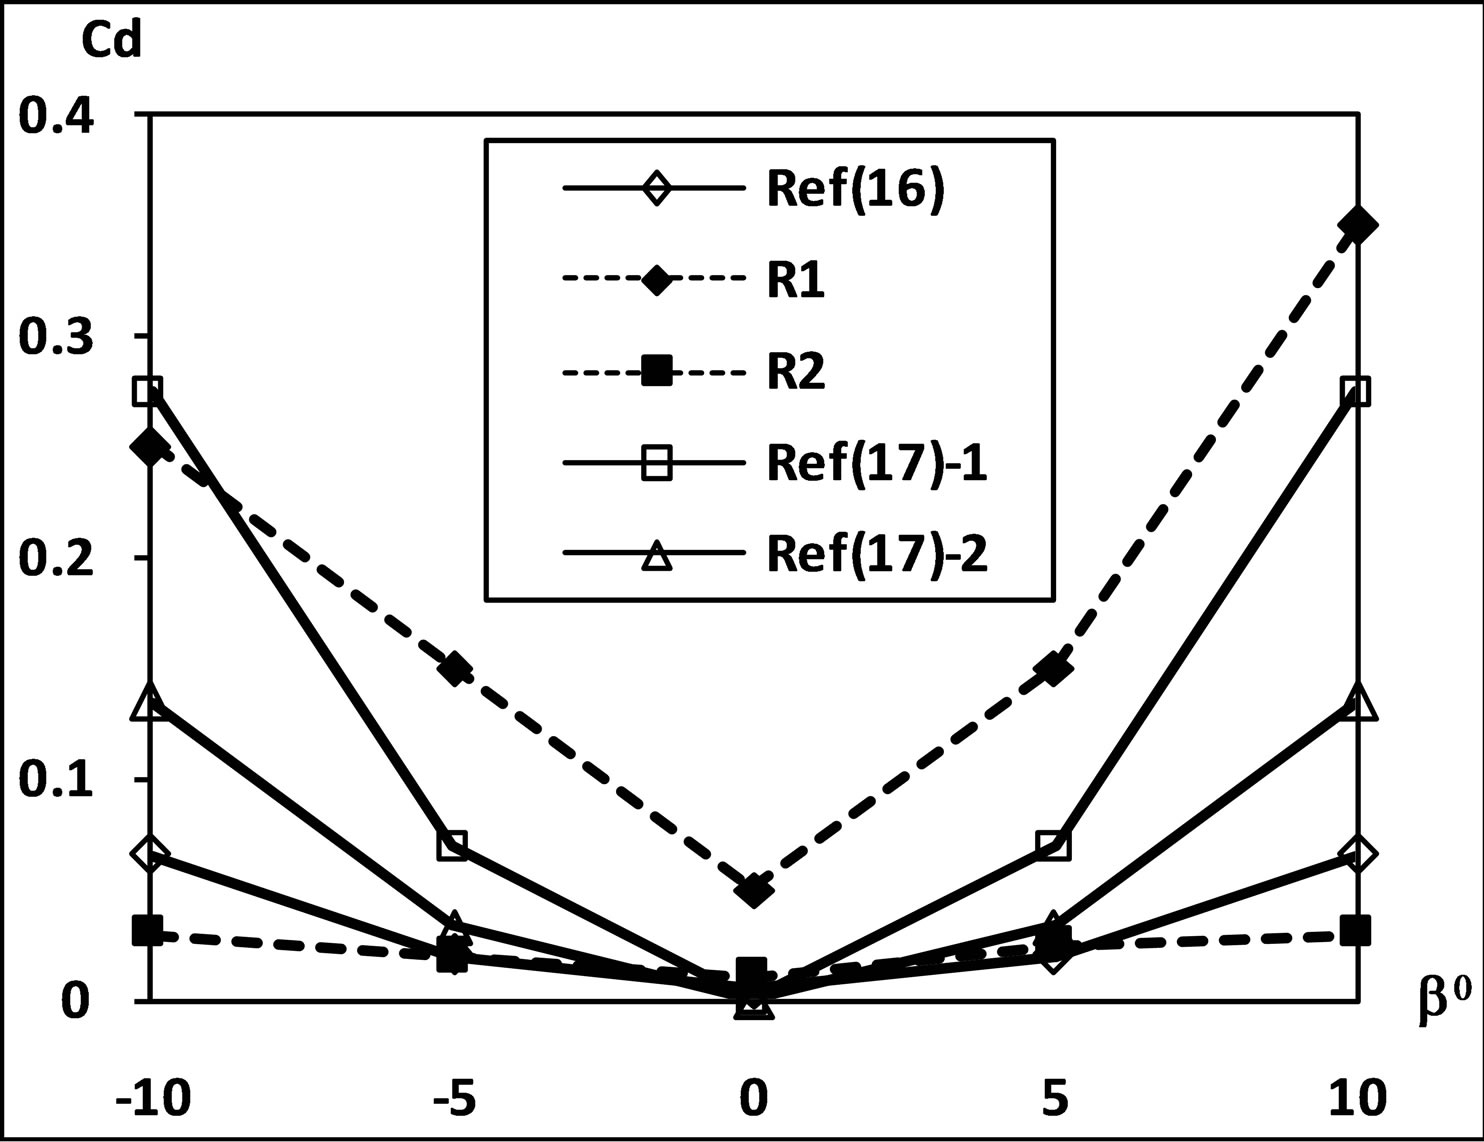
Figure 11. Comparison of experimental and theoretical drag coefficient R1 = 2.26 × 10⁵ and R2 = 2.52 × 10⁵.
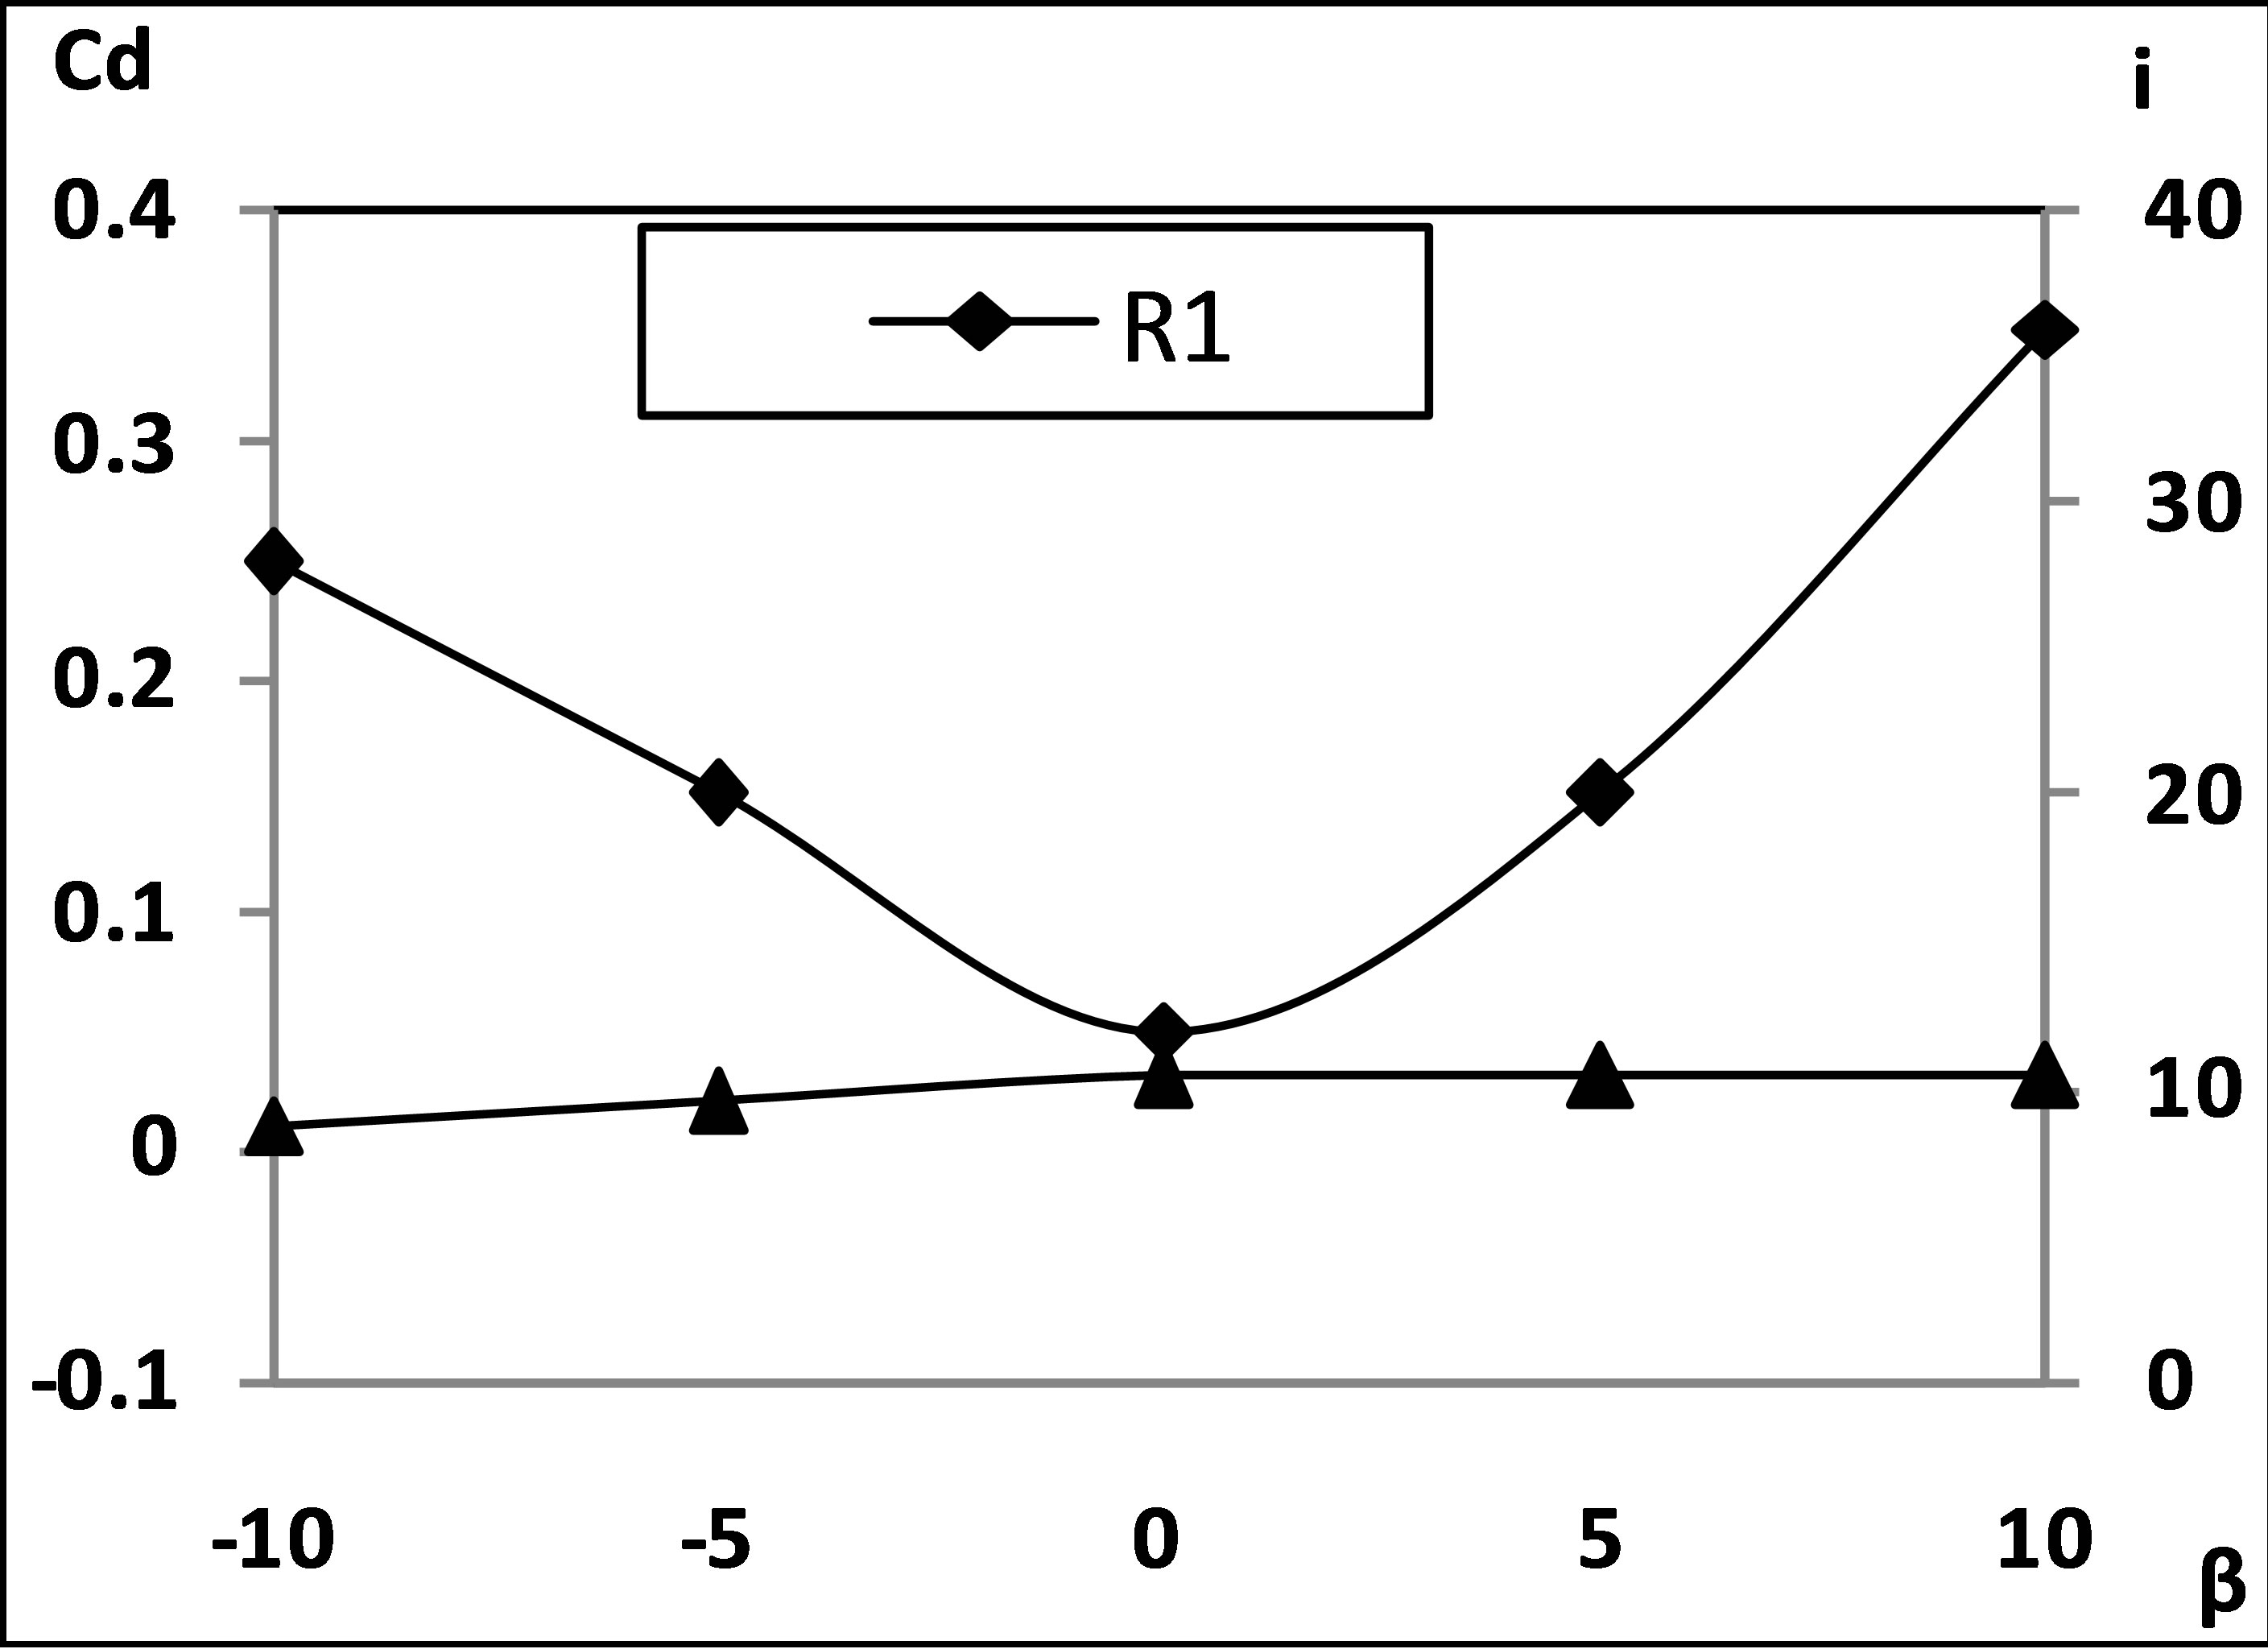
Figure 12. Variation of drag coefficient with Blade angle and angle of incidence. R1 = 2.26 × 10⁵ and R2 = 2.52 × 10⁵.
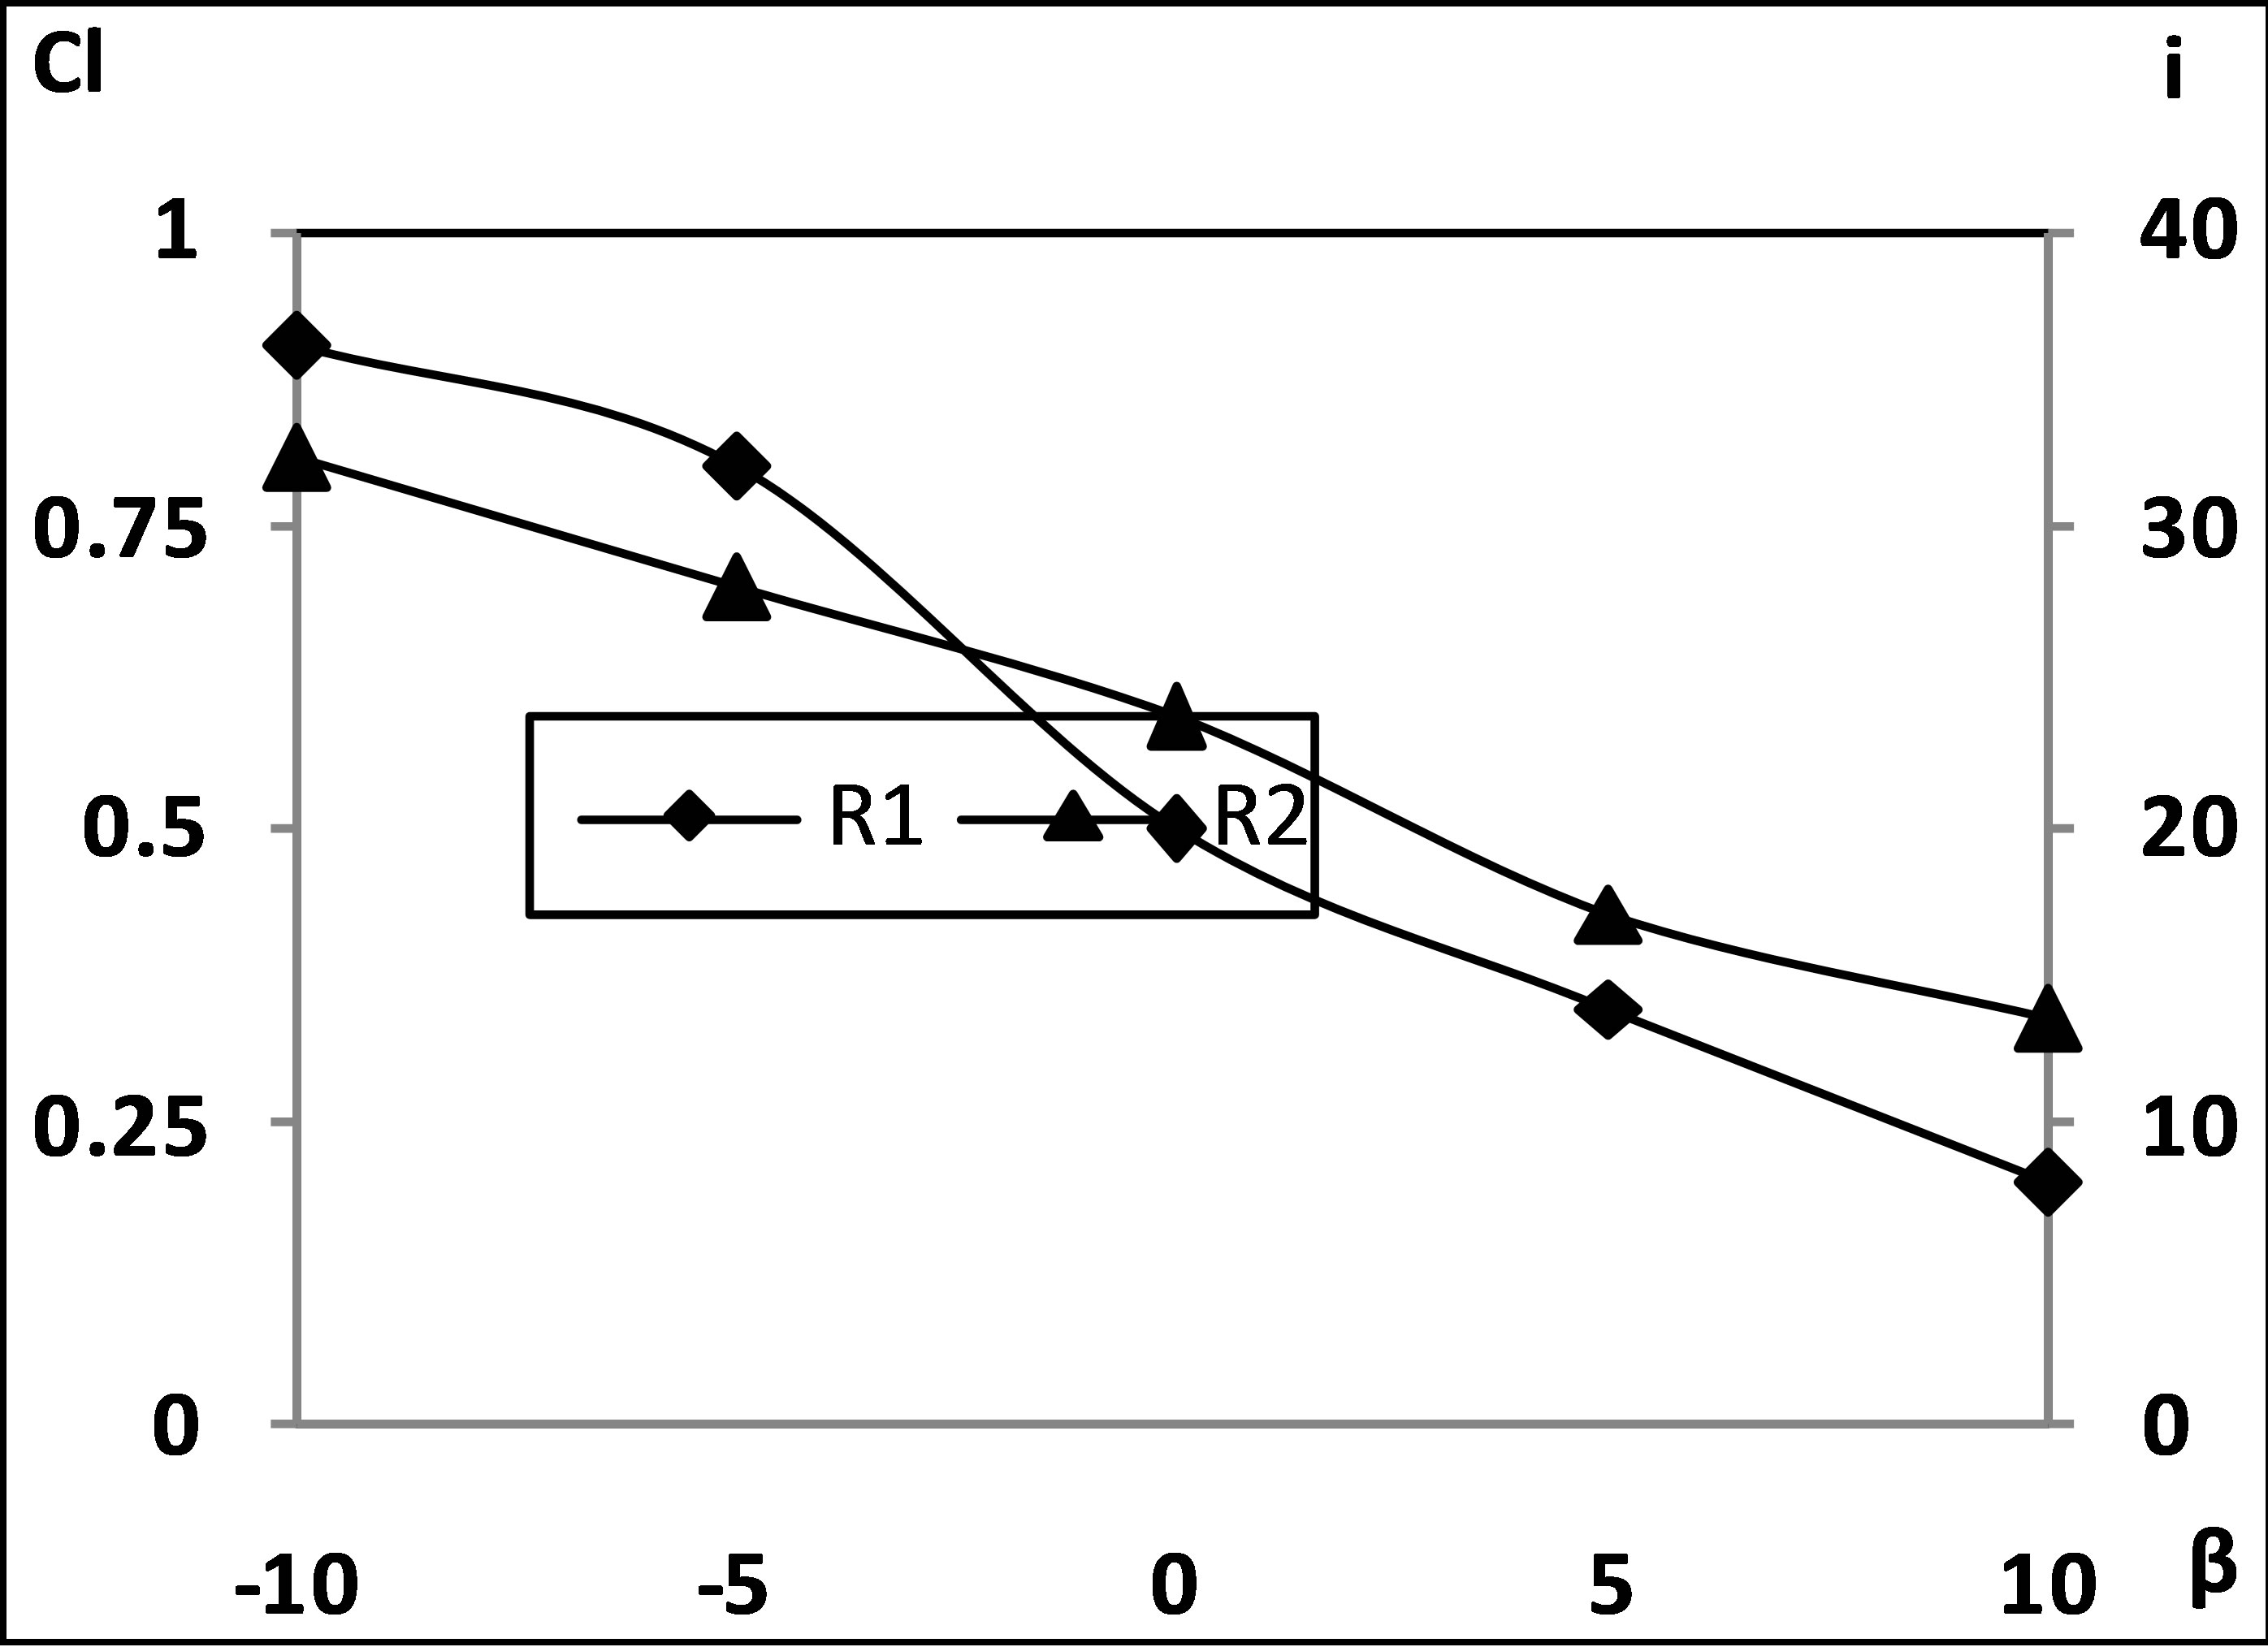
Figure 13. Variation of lift coefficient with Blade angle and angle of incidence. R1 = 2.26 × 10⁵ and R2 = 2.52 × 10⁵.
of different shapes at low speed has been built. Aerodynamic performance of an axial cascade of chord 70 mm, span 215 mm and pitch chord ratio of 0.55 has been evaluated. From the investigations, it has been found that under the conditions of the test the angle of incidence decreases with the blade angle. The deviation of the flow is observed to decrease with the increase in Reynolds number and the blade angle. The flow is found to deflect less at higher blade angles and flow rate. At higher Reynolds number, a small change is observed in the values of Cp with the change in the blade angle, whereas almost no changes are observed with the angle of incidence. At higher Reynolds number, the total pressure loss coefficient is almost invariant with the blade angle. The lift coefficient is observed to decrease with the blade angle. The drag coefficient, blade angle and the incidence are interrelated to each other. Further the theoretical values of both coefficients are seen to be different than the measured values. Measured drag is higher and the lift is lower.
5. Acknowledgements
This project was supported by Deanship of Scientific Research and Research Center College of Engineering, King Saud University, Riyadh, KSA.
REFERENCES
- W. H. Roundebush, “Potential Flow in Two Dimensional Cascades, Chapter IV of ‘Aerodynamic Design of Axial Flow Compressors’,” NASA Sp 36, US Government Printing Office, Washington DC, 1965.
- N. Scholz, “Aerodynamics of Cascades,” AGARDograph No. 220, Nato Science and Technology Organization, Amsterdam, 1977.
- J. P. Gostlow, “Cascade Aerodynamics,” Pergaman Press, Oxford, 1984.
- N. A. Cumpsty, “Compressor Aerodynamics,” Longman Scientific and Technical, England, 1989.
- A. Felix and J. Emery, “A Comparison of Typical NGTE and NACA Axial Blade Compressor Blade Sections in Cascades at Low Speeds,” NACA TN 3937, US Government Printing Office, Washington DC, 1957.
- I. D. Baciu, “A S Profile Axial Cascade Tested in a Wind Tunnel,” International Conference on Hydraulic Machinery and Equipment, Timosoars, 16-17 October 2008, pp 45-48.
- S. J. Andrew, “Tests Related to the Effect of Profile Shape and Camber-Line on Compressor Cascade Performance,” Aeronautical Research Council R&M 2743, Aeronautical Research Council, England, 1949.
- G. Serovy, P. Kavanagh and T. Okishi, “Aerodynamics of Advanced Axial Turbomachinery,” NTIS Report ADA 131360, US Government Printing Office, Washington DC, 1983.
- G. Pullen and N. Harrvey, “Influence of Sweep on the Axial Flow Turbine Cascade at Mid Span,” Transactions of ASME, Journal of Turbomachinery, Vol. 129, No. 3, 2007.
- D. Kalpatrik and R. Burrow, “Aspect Ratio Effects on Compressor Cascade Blade Flutter,” ARC Technical Report, R&M No. 3103, Aeronautical Research Council, England, 1958.
- H. Mustaphe, D. Jourim and S. A. Scolander, “Aerodynamic Performance of a Transonic Turbine Cascade at Off Design Conditions,” Journal of Turbomachines, Vol. 123, No. 3, 2001, pp. 510-519.
- T. Nagasaki and N. Yamasaki, “Linear Unsteady Aerodynamic Forces on a Vibrating Annular Cascade Blade,” Journal of Thermal Sciences, Vol. 12, No. 2, 2003, pp. 138-143.
- R. Lanzafame and M. Messina, “Fluid Dynamic Wind Turbine Design: Critical Analysis, Optimization and Application of BEM Theory,” Renewable Energy, Vol. 32, No. 14, 2007, pp. 2291-2305.
- Mcormik and Barnes “Aerodynamics, Aeronautics and Flight Mechanics,” John Wiley and Sons, New York, 1979.
Nomenclature
AR: Aspect ratio of the cascade = b/c;
c: Chord of the cascade blades;
Cd: Drag coefficient.
Cdmax: Maximum drag coefficient;
Cl: Lift coefficient.
Clmax: Maximum lift coefficient;
Cp: Static pressure rise coefficient.
i: Incidence angle i =α1‒β1;
l: Blade span;
P: Total pressure;
p: Static pressure;
s: Pitch;
V: Total velocity;
α: Flow angle;
β: Blade angle;
δ: Deviation angle δ = α2 ‒ β2;
ε: Deflection angle ε = α1 ‒ α2;
ξ: Total pressure loss coefficient 
ρ: Air density.
Subscript
1: Cascade inlet;
2: Cascade outlet;
m: Mean;
f: Free stream.