Advances in Microbiology
Vol.08 No.12(2018), Article ID:89400,19 pages
10.4236/aim.2018.812066
Gut Microbiota Dysbiosis in Cafeteria Diet Fed Sprague Dawley Rats
Kavitha Varadharajan1*, Muralitharan Shanmugakonar1*, Sandra Concepcion Das1, Hamda A. Al-Naemi1,2
1Laboratory Animal Research Centre (LARC), Qatar University, Doha, Qatar
2Department of Biological and Environmental Sciences, Qatar University, Doha, Qatar

Copyright © 2018 by authors and Scientific Research Publishing Inc.
This work is licensed under the Creative Commons Attribution International License (CC BY 4.0).
http://creativecommons.org/licenses/by/4.0/


Received: November 29, 2018; Accepted: December 22, 2018; Published: December 25, 2018
ABSTRACT
Diet plays a major role in the body physiology and metabolism. The quantity, nature and stability of the macronutrients present in the diet have a major impact on the composition of gut microbiota. Gut microbiota plays a major role in the body metabolism and leads to obese or lean phenotype. Bacteriodetes, Firmicutes, Proteobacteria and Actinobacteria are the major microbes that inhabit in the region of the gut. We made an attempt to study the effects of Cafeteria (CAF) diets and normal chow diets on diet consumption, weight gain, metabolism and composition of gut microbiota in fecal and cecum samples from three weeks old Sprague Dawley (SD) rats (n = 18/group) using 16S rDNA high throughput sequencing. Results revealed that distinctive diet based phenotypical changes were observed in some of the Cafeteria diet fed rats. Interestingly, some weight gain resistant (WGR) animals in Cafeteria diet fed groups show similar trend like that of control normal chow fed rats. Fecal microbiome analysis indicates that the ratio of Bacteriodetes is higher than the Firmicutes in cecum samples of Cafeteria diet fed rats whereas no significant difference is found in fecal samples of Cafeteria diet fed rats and as well as in control rats. Further analysis of other taxa at the level of family and genus of microbial abundance are also discussed. Our study suggests that contribution of gut microbiota towards obesity is not at the phylum level, and microbiome composition even at the level of species or strain may exert impact on the metabolism of the Cafeteria diet.
Keywords:
Gut Microbiota, Obesity, Cafeteria Diet, Feces, Weight Gain Resistant, Next Generation Sequencing

1. Introduction
Obesity is the major metabolic disorder that affects more than 2 billion people worldwide and the prevalence of this disorder has been more than doubled since 1980. Increasing fat mass is the hallmark of obesity which is the result of an imbalance between the energy intake and expenditure. Both the adults and young ones are affected by this nutritional disorder. A high prevalence of obesity and obesity-related diseases is posing ever increasing threat to global health. In Qatar, approximately 30% of the population (6 - 11 years) is overweight or obese [1] . These children are having significantly increased the risk of obesity, hypertriglyceridemia, low HDL-cholesterol, and higher atherogenic index compared with children who were normal weight. Obesity is significantly associated with cardiovascular disorder; however, the mechanism involved is poorly understood. Excess of adipose tissue marks obesity which influences the circulating cardiovascular risk factors that are involved in the development of type 2 diabetes and cardiovascular disease. Hence, it is essential to explore and understand the different factors, such as diet, physiological responses to diet and most importantly the role of gut microbiota in the regulation of body weight and maintaining energy homeostasis [2] .
Gut microbiota comprises of abundant species of bacteria and their diversity is significantly contributed to the maintenance of health; whereas, changes in their composition contribute to the development of diseases. Studies have suggested that food in the intestine interacts with gut microbiota, and when this interaction is disturbed either by diet or the change in the gut microbial community, it eventually leads to health disorders, such as obesity, obesity associated inflammation and insulin resistance. In addition, gut microbiota is involved in many of the host functions, such as energy harvest, fat storage and immune response, hence studying the impact of high fat and high sugar diet on the gut flora and their metabolites will be useful to understand the role of gut microbes on obesity and obesity related cellular changes that lead to obese phenotype. Recent studies have suggested that gut microbiome plays a major role in contributing the risk for various chronic diseases, such as obesity, type 2 diabetes, cardiovascular disease and cancer. It is understood that diet plays a major role in shaping the microbiome; however, the role of gut microbiota in the regulation of body weight and maintaining energy homeostasis still needs to be studied to understand the mechanism involved.
Diet is one of the major factors which contribute to the change in the ratio of the gut microbiota [3] . High fat and high sugar diet adversely affect the gut microbiota composition which alters the body metabolism rate. The dietary components, such as carbohydrates, proteins and lipids that escape from digestion in the upper gastrointestinal tract, are the main source of energy for the gut microbiota [4] . Metabolism of complex food substances results in the synthesis of short chain fatty acids, sterols etc., and such metabolites play a major role in maintaining body health [5] .
Gut microbiota has extensive metabolic pathway which can able to synthesize various byproducts and also regulates the absorption during digestion. Mutualism between the gut microbiota and the diet plays a vital role in shaping up the normal health of the body; however, it is hard to understand the mechanism involved in maintaining interrelationship when alteration or change in the microbial composition and as well in the food intake occurs in the body. Moreover, microbiota specific to different regions of the gut and their relationship to host influence the metabolism of the various diets. Selection of sample type for the microbiome analysis is also critical to understand the host-microbial interaction and their metabolic response. Several review reports were published with regards to the host-microbial interaction and the dynamics of their metabolism [6] , nevertheless, very few research reports were focused on metabolism and metabolite analysis [7] .
We intended to investigate the taxonomical abundance present in the fecal & cecum samples from the cafeteria (CAF) diet fed Sprague Dawley (SD) rats compared with normal chow diet fed rats. In the present study, we compared the microbial diversity from the phylum level to species level using (16S rDNA) high throughput next generation sequencing technology. Furthermore, we highlighted the behavior, phenotype and metabolic activities of the CAF and normal chow diet fed animals.
2. Materials and Methods
2.1. Animal Care and Husbandry
Sprague-Dawley (SD) male rats were purchased from Charles River, UK. SD rats were housed and maintained in Laboratory Animal Research Center (LARC), Qatar University (QU), Qatar, according to the QU institutional ethical rules and regulations and approved by QU―IACUC & IBC. All the three weeks old SD rats (50 ± 1.09 g) were caged under standard animal husbandry conditions (Temperature―19˚C - 23˚C; Humidity―60% - 70%; Light & dark cycles―12 hours; (Food and water in adlibitum) with IVC system and the controlled environment. Animal cages were changed on weekly basis or at the time of wet cages. All efforts were made to reduce the animal suffering and stress. Euthanasia was performed under deep anesthesia induced by an intraperitoneal dose of Thiopentone sodium (0.04 mg/kg b.Wt.).
2.2. Experimental Design and Diet Composition
SD rats were separated into two different groups. Control group with normal chow diet (n = 18), the obese group with cafeteria (CAF) diet (n = 18), and body weight, food and water intake were recorded weekly for 8 weeks. Table 1 demonstrates the composition of normal chow diet and cafeteria diet.
2.3. Animal Phenotype Observation
The phenotype of the experimental SD rats was closely observed and changes were noted accordingly. After completion of the study, representative experimental animals (all groups) were euthanized under deep anesthesia induced by

Table 1. Demonstrating the composition of normal chow diet (Standard) and cafeteria diet.
an intraperitoneal dose of Thiopentone sodium (0.04 mg/kg body Weight) Followed by cervical dislocation, physical examination of internal organs was made during necropsy.
2.4. Sample Collection and Storage
After necropsy, the cecum stool samples were collected under aseptic conditions from all experimental groups and stored immediately at −80˚C. Fresh fecal samples (2 - 4 pellets) from each group were also collected before necropsy and stored immediately at −80˚C for gut microbiota analysis.
2.5. DNA Extraction from Fecal Sample
Genomic DNA was extracted from fecal pellet and cecum stool samples using QIAamp DNA Stool Mini kit (Qiagen). Frozen fecal samples were kept on ice for 20 - 30 minutes for thawing. From each experimental groups, Fecal pellet and the cecum samples were weighed (approximately 180 - 220 mg) and homogenized by vortex with buffer provided in the kit and followed the extraction procedure according to the manufacturer’s instructions. Briefly, homogenized fecal supernatant samples were lysed using lysis buffer with proteinase K. Gut microbiota DNA was extracted by spin column method and washed with ethanol and eluted with elution buffer. Extracted genomic DNA was quantified by IMPLEN nanophotometer and stored at −80˚C until Next Generation Sequencing analysis (NGS).
2.6. Next Generation Sequencing Analysis
Next Generation Sequencing (NGS) library preparation and 16S rDNA sequence analysis were outsourced and performed by Macrogen, Inc Korea. The sequencing analysis was carried out using Illumina MiSeq system according to the manufacturer’s instruction. Initially, the DNA samples were subjected to quality testing and libraries were prepared. Specific primer sets were used to amplify V3-V4 hypervariable region and sequencing was carried out for the analysis of broad taxonomic range. After sequencing, the raw data were analyzed using Quantitative insights into microbial ecology (QIIME) software to filter the multiplexed sequence reads and by operational taxonomic units (OUT). Sequences were clustered and aligned for diversity analysis to identify the taxa of the microbiota. The assembled OUT analysis tables were then used to report the relative percentage of the microbiota in every sample. QIIME package was used to explore the diversity of the microbial population.
3. Results and Discussion
In recent past, several studies were published about gut microbiota in human as well as in rodents focusing on its impact on diet induced obesity [7] [8] [9] . Here we discuss the aspect of gut microbiota population in the cecum fecal and fecal pellet samples from our experimental SD rats fed with cafeteria and normal chow diet. We chose the cafeteria diet because it has been proven as an informative tool to induce voluntary hyperphagia and hence overweight/obesity in rats that better resembles the impact of Western diet in humans. The current study describes the gut microbiota composition and comparing them in the study groups of SD rats. Moreover, we explore the variation of gut microbiota in cecum as well as the fecal sample of the respective groups.
The impact of the cafeteria diet on weight gain, food consumption, physiological and biochemical activities were observed throughout the experimental period. Prior to the commencement of the diet, animals with the approximate bodyweight of 50 ± 1.09 g were chosen and separated into two different groups based on the diet. Normal chow diet based group is designated as control (C) group and the cafeteria (CAF) diet based group is considered as the test group. Control and the test group of SD rats were maintained in SPF facility with individually ventilated cage (IVC) system with a controlled environment at Laboratory Animal Research Center (LARC), Qatar University, Qatar.
During the experiment, diet intake, body weight and physical examination of the experimental animals were observed and recorded. Figure 1 illustrates the diet consumed by the experimental animals. From the third week onwards, consumption of CAF diet was increased more than 100 grams per week and this trend was maintained until the end of the study period. CAF diet fed rats consumed double the amount of food compared to the chow diet fed rats. With respect to the body weight gain of the experimental rats, there is no significant body mass variation observed in the early experimental period. After 3rd week, CAF diet fed animals were started to gain weight (designated as “Obese” (O) group) when compared with the control (C) animals which were provided by normal chow diet. Interestingly, some of the rats in the cafeteria diet fed groups were not gained their weight and the phenotype is similar to control animals and these animals were observed separately and designated as “Weight Gain Resistant” (WGR) group. However, the phenotype of the obese and weight gain resistant animals was continued until the end of the experiment. At the end of the study period (10th week), CAF diet fed obese rats were almost double the body mass of normal chow diet fed groups whereas the WGR groups were same as control animals (Scheme 1).
Food intake is increased gradually in CAF diet fed obese rats; this observation shows the rats are more sensitive to the palate of the food. In contrast, the food intake in WGR rats did not increase as the obese rat and hence these rats may not be susceptible to the palate of the food. In addition to taste and aroma of the food, gut microbiota also plays a major role in the food consumption. Food

Figure 1. Illustrating the weekly average diet consumption of experimental animals (Mean value of diet consumption, ± SD).
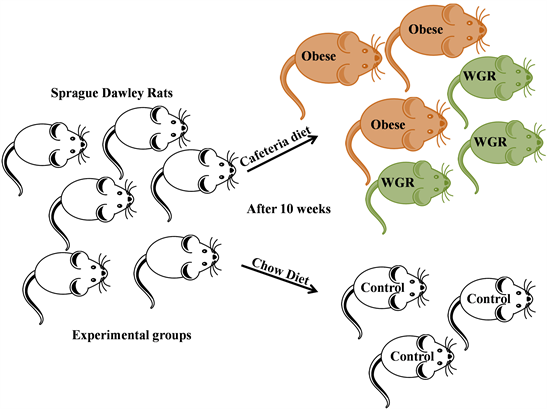
Scheme 1. The experimental groups of the present study described the control, obese and the weight gain resistant groups.
consumption increases due to environmental factor (nocturnal hyperphagia), molecular/metabolic alterations (Ghrelin/Leptin) and protein modifications which are influenced by gut microbiota [10] . Gut microbiota also induces the short and long term appetite control which is influenced by available nutrients. When comparing with the phenotype of the experimental rats, body weight gain was observed in CAF fed obese rat and this may largely due to the increase in the food consumption. It has been reported that metabolic alterations and deposition of adipose tissue are the main contributors to induce obesity [11] . In our study, we observed an interesting and contrast outcome that CAF fed WGR rats did not gain body weight and these groups are same as control. Genetic factor, metabolic alterations and/or gut microbiota might be the potential contributing factors for this kind of phenotype. However, the mechanism behind this is not well explored yet.
Towards the end of the study period, all experimental groups (Control, Obese and Weight gain resistant) were subjected to overnight fasting and euthanized as per the LARC recommended procedure. Before euthanization, the animal’s fecal pellet from all the three experimental groups was collected under the aseptic condition and stored at appropriate condition. Cecum fecal samples were collected from the experimental animals after euthanization and stored at appropriate condition. During necropsy, examination of internal body parts was observed in all the three experimental groups. Overweight-related changes were observed in the internal body parts, as predicted accumulation of white and brown adipose tissue on the various organs was observed in CAF-fed obese groups. Size of the organs (Stomach, Liver, thigh & abdominal mesenteric fat) in the obese group is significantly varied from other two groups. Presence of fatty liver in obese rat indicates the accumulation of fat and high energy intake. Due to the abdominal adiposity, muscular wasting also observed in the thigh region and this may be associated with the cardiovascular-related disorder [12] .
To explore the association between host and gut microbiota interrelationship, various techniques have been employed to identify microbial diversity from environmental, research and medical samples. In particular, the distribution of gut microbiota in the fecal samples has been explored universally by 16S rDNA and meta-transcriptomic sequencing analysis [13] . Intense study of gut microbiome explores the relationship between the microbial community and their impact on metabolism and the host immune response [14] . Furthermore, weakening and/or imbalance in the microbial population have been associated with variation in phenotype, inflammatory disorder, metabolic changes and other various obesity related disease [15] .
Here, we studied the microbial diversity in rat fecal and cecum fecal samples of diet induced obese, WGR and control rats by NGS. To evaluate, genomic DNA was extracted from fecal and the cecum pellet in all the three groups (Control, Obese and weight gain resistant) Three replicates from each group were subjected to 16S sequencing analysis, Short-read sequencing libraries were prepared from the extracted DNA (8 µg) and hypervariable region V3 - V4 of the 16S rDNA was sequenced, the representative image and average results are presented in the current study.
Significant numbers of OTUs were acquired using 97% sequence homology as a cutoffpoint. The OTUs of all the experimental samples are more than 100 counts except the obese fecal pellet. Nevertheless, the small OTUs in the obese samples are more than sufficient for analysis. Alpha diversity indices of the microbial richness and the evenness of the experimental groups were calculated using Shannon, Simpson and Chao index boxplots which reveals that there is a good coverage of microbial diversity. The rarefaction curve (RC) of all the experimental samples reveals that the number of sequence reads is more than sufficient for OTU and alpha diversity analysis. Sequence reads were randomly pulled out from the clean raw data and the number of species from each experimental group is explored in the rarefaction curve. The curve also explains that the sequence reads are adequate to show the diversity of the species within the particular sample.
Figure 2 shows the PCoA plot analysis for the distance matrices of the obtained sequence from the experimental groups. This explains the gut microbial communities in the fecal sample are well-distributed with 63% of PC1-PCoA, 22% of PC2-PCoA and 8% of PC3-PCoA, which indicates a clear distance matrix of the gut microbiota of the obese and WGR samples away from that of the control samples. UPGMA tree analysis shows the significant difference in diversity abundance as indicated in the PCoA analysis (Figure 3). Figure 4 describes the heat map analysis which shows the abundance count of different gut microbial species present in the fecal and cecum samples. Distribution of gut microbiota are differentiated with the color code and it is based on the contribution of each OTUs present in the samples. Higher OTUs indicates in highlighted colors whereas blue color indicates low counts. Interestingly, in the present study, minor variations were observed in the community richness plot with no difference in

Figure 2. 3D-Principle coordinate analysis (PCoA) of gut microbiome in fecal and cecum samples compared with control. Every dot indicates the bacterial population composition of individual fecal sample. Axis titles explained the percentage difference.

Figure 3. Unweighted Pair Group Method with Arithmetic mean (UPGMA) hierarchical clustering and the distance matrix between the test group samples.
the average Simpson-Shannon index values. Rarefaction curve also showed a higher yield of sequence in all the fecal samples. PCoA and UPGMA also explored the clustering and the distance matrix between the samples. In addition, heat map also confirmed the OUT difference in all the control and test samples. All these parameters are supportive to estimate community richness and to find the degree of similarity of the microbial composition between the fecal samples to further explore the alpha as well the beta diversity of the samples [16] .
The impacts of different diet supplements on the gut microbial diversity of the experimental groups were analyzed from the cecum and fecal samples. Changes in microbial taxonomic composition from phylum to species level were determined. In phylum level, Bacteroidetes were significantly higher in the cecum samples of CAF diet group (Obese & WGR group) when compared to the control group; whereas, there was not much difference observed in the fecal samples irrespective of diet. Interestingly, Proteobacteria is significantly higher in the obese group of both cecum and fecal whereas in normal and WGR group shows lesser. This observation shows Proteobacteria plays a major role in the fat metabolism and increase in Proteobacteria leads to overweight in the experimental animals. With regard to Firmicutes, not much difference was observed in fecal samples. However the percentage in cecum samples were significantly less in obese and WGR groups when compared to respective control groups (Figure 5). Figure 6 illustrates the order level of taxonomical abundance ratio of the gut microbiota in obese, WGR and control samples. Irrespective of all the diet, Clostridiales, Lactobacillales and Bacteroidales were dominant when compared to other order of microbes.
Analyzing microbial community at the family level indicates that there is a rich diversity of gut microbes in all the samples. The abundance ratio of the community reveals that the fecal sample of CAF diet fed (obese) animals showed

Figure 4. Heat map describes the amount of significantly different OTUs between gut microbiota in cecum fecal pellet (CFP) of Weight gain Resistant (WGR) and Obese (O) compared with normal rats. The OTU heat map displays raw OTU counts per sample, where the counts are color based on the contribution of each OTU to the total OTU count present in that sample (blue: contributes low percentage of OTUs to sample; other highlighted colours: contributes high percentage of OTUs). [Filter by counts per OTUs ? 50].

Figure 5. Phylum level taxonomical abundance ratio of the gut microbiota present in the fecal (FP) and cecum (CFP) samples of Control (C), Obese (O) and weight gain resistant (WGR) rats.

Figure 6. Order level taxonomical abundance ratio of the gut microbiota present in the fecal (FP) and cecum (CFP) samples of Control (C), Obese (O) and weight gain resistant (WGR) rats.
the higher abundance of 41% Bacteroidaceae and 31% Lactobacillaceae but Sutterellaceae, Peptostreptococcaceae, Ruminococcaceae and Porphyromonadaceae showed <10% whereas in cecum samples of CAF diet fed (obese) animals 25% Bacteroidaceae, 24% Porphyromonadaceae, 18% Prevotellaceae and all the other families were shown less than 10%. When compared to control animal, gut microbiota was varied significantly in the fecal and cecum samples of obese rat (Figure 7(a)). Figure 7(b) describes the abundance of gut microbiota in fecal and cecum samples of WGR animals. In the fecal sample of WGR rats, Bacteroidaceae and Peptostreptococcaceae are more abundant (24%) when compare to Lactobacillaceae and Porphyromonadaceae (16%) and all others are less than 10% of the population. However, Porphyromonadaceae (30%), Bacteroidaceae (24%) and Ruminococcaceae (16%) were dominant in cecum samples of WGR rats but all others are less than 10%. In contrast, there is not much dominance in the samples (Fecal & cecum) of control groups and all the said families are distributed in the range of 0% - 18% (Figure 7(c)). Depends upon the anatomical location, the microbial population shifts were induced by CAF diet in both obese and WGR groups but the rate of metabolism and the pathway may vary. Table 2 elucidated genera level taxonomical abundance count of the gut microbiota present in the fecal and cecum samples of control, obese and weight gain resistant rats. Genus of Barnesiella, Parabacteroides, Prevotella, Bacteroides (from Bacteroidetes), Parasutterella (from Proteobacteria), Lactobacillus and Clostridium XI (from Firmicutes) were dominant in the fecal samples.
In the taxonomical analysis, most of the reported articles were discussed about
 (a)
(a) (b)
(b) (c)
(c)
Figure 7. Family level distribution (%) of gut microbiome in Obese (O) rats (a), Weight Gain Resistant (WGR) rats (b) and Normal control rats (c).
Table 2. Genera level taxonomical abundance count of the gut microbiota present in the fecal and cecum samples of Normal, Obese and weight gain resistant rats.
the ratio of Firmicutes and Bacteriodetes which influence the diet induced obesity in rats [17] . The relative proportion of Firmicutes in the gut microbiota of overweight animals has been suggested that it enhance the energy harvest from the diet and induce the absorption of more calories which leads to consequent weight gain [18] . Ley et al. [19] reported that relative abundance of Bacteriodetes was decreased in obese animals when compared with lean animals.
We reported a higher abundance of Firmicutes, Bacteriodetes and Proteobacteria in our experimental animals at the phylum level. These three are the predominant microbiota in gut region (cecum and fecal) of human as well in rodents [20] suggesting that the rats are the best model for the diet induced gut microbiome studies. All these microbial communities influence the metabolism of diet and make the body either obese or lean. In our study, the percentage of Bacteriodetes as well as members within its order, Bacteroidales is also increased in the cecum samples due to high fat and high glucose content in cafeteria diet. A relative percentage of decrease in the ratio of Firmicutes and increase in Bacteriodetes were observed due to high fat and high glucose content in cafeteria diet. Schwiertz et al. [21] and Lecomte et al. [8] reported similar results in increase in the abundance of Bacteriodetes which supports the phenomenon of diet induced obesity. There is no significant relative abundance (at phylum level) between Firmicutes and Bacteriodetes in the fecal samples of CAF fed animals, similar findings were also observed in several human gut microbiota studies, where no change in the ratio of the gut microbiota was related with obese phenotype [15] . Increase in the abundance of Proteobacteria may also induce the obesity in the animals [22] . Bacteria within the order, Bacteroidales, Clostridiales and Lactobacillales were showed higher variations in both the chow diet and cafeteria diet fed animals. Decrease in Clostridiales were observed in Cafeteria diet fed obese animals whereas in normal and WGR animals were remain same. In contrast, Magnusson et al. [9] reported that decrease in Bacteroidales and increase in Clostridiales, but the percentage of Lactobacillales was significantly increased in cafeteria diet fed obese animals.
Most of the reported articles discuss about the ratio between the phylum level of gut microbiota (Firmicutes and Bacteriodetes) however families within the Firmicutes and Bacteriodetes are not well explored. Here we also discuss about the microbial diversity within the families present in the different gut regions. With regard to the fecal pellet, families within Firmicutes, Erysipelotrichaceae was completely reduced whereas Lactobacillaceae was increased in obese and WGR samples. There was no significant difference in Ruminococcaceae, Peptostreptoceae and Lachnospiraceae. With regards to Bacteriodetes families a remarkable increase in the ratio was observed in obese samples when compare to WGR and control samples. Significant reduction in Porphyromonadaceae and Prevotellaceae population was observed in obese samples when compare to WGR and control samples. Families in Proteobateria may also play a major role in diet metabolism. Sutterellaceae was increased significantly in obese samples when compare to WGR and control samples. With regard to the cecum fecal samples, Peptostreptoceae and Lactobacillaceae from Firmicutes were reduced significantly whereas Prevotellaceae proportion was increased in obese samples. Rest of all the families was similar to fecal samples.
With regard to the genus level, microbial abundance count in the Bacteroidetes was observed higher than the Firmicutes but the number of genera variation was observed only in Firmicutes. Only eight different genus was observed in the Bacteroidetes whereas in Firmicutes more than 25 different genus was observed. Difference in the genus level may play a major role in the diet metabolism and this warrants further study.
Many literatures were available with regard to the gut microbiota ratio (Firmicutes/Bacteriodetes) which is associated with obesity. In some of the reports, Firmicutes were increased when compared to bacteriodetes and in other studies this trend is completely opposite with the increase of Bacteriodetes. In contrast, some reports confirm that there is no change at all in the population. Koliada et al. [23] reported that the Firmicutes are increased when compared with obese Bacteroidetes. However, Furet et al. [24] stated that upside down in Bacteroidetes and there in no variation in Firmicutes ratio. Collado et al. [25] revealed that ratio of Firmicutes and Bacteroidetes was increased at species level. Some other reports were confirmed that decrease [26] , increase in Firmicutes [27] and no difference in Bacteroidetes at the family or phylum level [21] . Further, no change among Bacteroidetes and Firmicutes at phylum level was reported by Duncan et al., [28] .
All the above observations highlight that the level or the diversity of gut microbiota was not significantly correlated with the phenotype of the animal, region of the gut and the diet. Interestingly, some of our results were supported with existing reports. Each and every bacterium has its own unique metabolic pathway which may vary upon the circumstances such as diet, environmental factors and genetic changes. The abundance may also vary depends upon the time of sample collection, the age of the animal, diet composition and the duration of metabolism. Bacterial metabolites (hormones, toxin and antibiotics) may also indirectly influence the phenotype of the animal due to some hormonal changes. Species level variations also play a major role in the metabolism and it influences the phenotype of the animal [29] . These reports indicate that the ratio of the microbial community doesn’t contribute reasonably to influence the phenotype of the body.
4. Conclusion
To conclude, the role of the microbiome in obesity, host-microbial interactions, type of samples, gut microbiota ratio, metabolism of diet and action of metabolites are the factors that need to be studied in detail to get a better understanding of microbiome and their contribution for health and disease. Based on our study outcome, we conclude that focus on strain dependent metabolic pathway and metabolite analysis may significantly reveal the dynamic mechanism behind the diet induced obesity and the weight gain resistant phenotypes. If all these parameters are satisfied, then certainly a study of this kind might reveal the mechanism in detail with more clarity for further therapeutic approach.
Acknowledgements
The authors would like to acknowledge: the Faculty Internal Grant (QU-G-CAS-BES-13/14-18), Qatar University for their financial support and LARC vivarium team, Qatar University for their support in animal care and husbandry.
Significance Statement
This study addresses the landscape and interrelationship of gut microbiota present in the various regions of gut in the study animals fed with cafeteria diet. This study shows variations even at the species level. Hence species related metabolic and molecular pathway studies might contribute more on diet induced obesity research.
Conflicts of Interest
The authors declare that they have no conflict of interest.
Cite this paper
Varadharajan, K., Shanmugakonar, M., Das, S.C. and Al-Naemi, H.A. (2018) Gut Microbiota Dysbiosis in Cafeteria Diet Fed Sprague Dawley Rats. Advances in Microbiology, 8, 975-993. https://doi.org/10.4236/aim.2018.812066
References
- 1. Kerkadi, A., Hassan, A.S. and Yousef, A.E.M. (2009) High Prevalence of the Risk of Overweight and Overweight among Qatari Children Ages 9 through 11. Nutrition Food Science, 39, 36-45. https://doi.org/10.1108/00346650910930806
- 2. O’Hara, A.M. and Shanahan, F. (2006) The Gut Flora as a Forgotten Organ. EMBO reports, 7, 688-693. https://doi.org/10.1038/sj.embor.7400731
- 3. Flint, H.J., Duncan, S.H., Scott, K.P. and Louis, P. (2015) Links between Diet, Gut Microbiota Composition and Gut Metabolism. Proceedings of the Nutrition Society, 74, 13-22. https://doi.org/10.1017/S0029665114001463
- 4. Scot, T.K.P., Duncan, S.H. and Flint, H.J. (2008) Dietary Fibre and the Gut Microbiota. Nutrition Bulletin, 33, 201-211. https://doi.org/10.1111/j.1467-3010.2008.00706.x
- 5. den Besten, G., van Eunen, K., Groen, A.K., Venema, K., Reijngoud, D.J. and Bakker, B.M. (2013) The Role of Short-Chain Fatty Acids in the Interplay between Diet, Gut Microbiota, and Host Energy Metabolism. Journal of Lipid Research, 54, 2325-2340. https://doi.org/10.1194/jlr.R036012
- 6. Tagliabue, A. and Elli, M. (2013) The Role of Gut Microbiota in Human Obesity: Recent Findings and Future Perspectives. Nutrition, Metabolism & Cardiovascular Diseases, 23, 160-168. https://doi.org/10.1016/j.numecd.2012.09.002
- 7. Monk, J.M., Lepp, D., Wu, W., Graf, D., McGillis, L.H., Hussain, A., Carey, C., Robinson, L.E., Liu, R., Tsao, R. and Brummer, Y. (2017) Chickpea-Supplemented Diet Alters the Gut Microbiome and Enhances Gut Barrier Integrity in c57bl/6 Male Mice. Journal of Functional Foods, 38, 663-674. https://doi.org/10.1016/j.jff.2017.02.002
- 8. Lecomte, V., Kaakoush, N.O., Maloney, C.A., Raipuria, M., Huinao, K.D., Mitchell, H.M. and Morris, M.J. (2015) Changes in Gut Microbiota in Rats Fed a High Fat Diet Correlate with Obesity-Associated Metabolic Parameters. PLOS ONE, 10, e0126931. https://doi.org/10.1371/journal.pone.0126931
- 9. Magnusson, K.R., Hauck, L., Jeffrey, B.M., Elias, V., Humphrey, A., Nath, R., Perrone, A. and Bermudez, L.E. (2015) Relationships between Diet-Related Changes in the Gut Microbiome and Cognitive Flexibility. Neuroscience, 300, 128-140. https://doi.org/10.1016/j.neuroscience.2015.05.016
- 10. Stunkard, A.J., Grace, W.J. and Wolff, H.G. (1955) The Night-Eating Syndrome: A Pattern of Food Intake among Certain Obese Patients. American Journal of Medicine, 19, 78-86. https://doi.org/10.1016/0002-9343(55)90276-X
- 11. Jung, U.J. and Choi, M.S. (2014) Obesity and Its Metabolic Complications: The Role of Adipokines and the Relationship between Obesity, Inflammation, Insulin Resistance, Dyslipidemia and Nonalcoholic Fatty Liver Disease. International Journal of Molecular Science, 15, 6184-6223. https://doi.org/10.3390/ijms15046184
- 12. Heitmann, B.L. and Frederiksen, P. (2009) Thigh Circumference and Risk of Heart Disease and Premature Death: Prospective Cohort Study. British Medical Journal, 339, b3292. https://doi.org/10.1136/bmj.b3292
- 13. Consortium, H.M.P. (2012) Structure, Function and Diversity of the Healthy Human Microbiome. Nature, 486, 207-214. https://doi.org/10.1038/nature11234
- 14. Martin, R., Miquel, S., Langella, P. and Bermudez-Humaran, L.G. (2014) The Role of Metagenomics in Understanding the Human Microbiome in Health and Disease. Virulence, 5, 413-423. https://doi.org/10.4161/viru.27864
- 15. Turnbaugh, P.J., Hamady, M., Yatsunenko, T., Cantarel, B.L., Duncan, A., Ley, R.E., Sogin, M.L., Jones, W.J., Roe, B.A., Affourtit, J.P. and Egholm, M. (2009) A Core Gut Microbiome in Obese and Lean Twins. Nature, 457, 480-484.https://doi.org/10.1038/nature07540
- 16. D’Argenio, V., Casaburi, G., Precone, V. and Salvatore, F. (2014) Comparative Metagenomic Analysis of Human Gut Microbiome Composition Using Two Different Bioinformatic Pipelines. BioMed Research International, 2014, Article ID: 325340.
- 17. Mozes, S., Bujnakova, D., Sefcikova, Z. and Kmet, V. (2008) Developmental Changes of Gut Microflora and Enzyme Activity in Rat Pups Exposed to Fat-Rich Diet. Obesity, 16, 2610-2615. https://doi.org/10.1038/oby.2008.435
- 18. Turnbaugh, P.J., Ley, R.E., Mahowald, M.A., Magrini, V., Mardis, E.R. and Gordon, J.I. (2006) An Obesity-Associated Gut Microbiome with Increased Capacity for Energy Harvest. Nature, 444, 1027-131. https://doi.org/10.1038/nature05414
- 19. Ley, R.E., Turnbaugh, P.J., Klein, S. and Gordon, J.I. (2006) Microbial Ecology: Human Gut Microbes Associated with Obesity. Nature, 444, 1022-1023.https://doi.org/10.1038/4441022a
- 20. Brooks, S.P., McAllister, M., Sandoz, M. and Kalmokoff, M.L. (2003) Culture-Independent Phylogenetic Analysis of the Fecal Flora of the Rat. Canadian Journal of Microbiology, 49, 589-601. https://doi.org/10.1139/w03-075
- 21. Schwiertz, A., Taras, D., Schafer, K., Beijer, S., Bos, N.A., Donus, C. and Hardt, P.D. (2010) Microbiota and SCFA in Lean and Overweight Healthy Subjects. Obesity, 18, 190-195. https://doi.org/10.1038/oby.2009.167
- 22. Shin, N.R., Whon, T.W. and Bae, J.W. (2015) Proteobacteria: Microbial Signature of Dysbiosis in Gut Microbiota. Trends in Biotechnology, 33, 496-503.https://doi.org/10.1016/j.tibtech.2015.06.011
- 23. Koliada, A., Syzenko, G., Moseiko, V., Budovska, L., Puchkov, K., Perederiy, V., Gavalko, Y., Dorofeyev, A., Romanenko, M., Tkach, S. and Sineok, L. (2017) Association between Body Mass Index and Firmicutes/Bacteroidetes Ratio in an Adult Ukrainian Population. BMC Microbiology, 17, 120.https://doi.org/10.1186/s12866-017-1027-1
- 24. Furet, J.P., Kong, L.C., Tap, J., Poitou, C., Basdevant, A., Bouillot. J.L., Mariat, D., Corthier, G., Dore, J., Henegar, C. and Rizkalla, S. (2010) Differential Adaptation of Human Gut Microbiota to Bariatric Surgery-Induced Weight Loss. Diabetes, 59, 3049-3057. https://doi.org/10.2337/db10-0253
- 25. Collado, M.C., Isolauri, E., Laitinen, K. and Salminen, S. (2008) Distinct Composition of Gut Microbiota during Pregnancy in Overweight and Normal-Weight Women. American Journal of Clinical Nutrition, 88, 894-899.https://doi.org/10.1093/ajcn/88.4.894
- 26. Zuo, H.J., Xie, Z.M., Zhang, W.W., Li, Y.R., Wang, W., Ding, X.B. and Pei, X.F. (2011) Gut Bacteria Alteration in Obese People and Its Relationship with Gene Polymorphism. World Journal of Gastroenterology, 17, 1076-1081.https://doi.org/10.3748/wjg.v17.i8.1076
- 27. Zhang, H., DiBaise, J.K., Zuccolo, A., Kudrna, D., Braidotti, M., Yu, Y., Parameswaran, P., Crowell, M.D., Wing, R., Rittmann, B.E. and Krajmalnik-Brown, R. (2009) Human Gut Microbiota in Obesity and after Gastric Bypass. Proceedings of the National Academy of Sciences of the United States of America, 106, 2365-2370.https://doi.org/10.1073/pnas.0812600106
- 28. Duncan, S.H., Lobley, G.E., Holtrop, G., Ince, J., Johnstone, A.M., Louis, P. and Flint, H, J. (2008) Human Colonic Microbiota Associated with Diet, Obesity and Weight Loss. International Journal of Obesity, 32, 1720-1724. https://doi.org/10.1038/ijo.2008.155
- 29. Million, M., Angelakis, E., Paul, M., Armougom, F., Leibovici, L. and Raoult, D. (2012) Comparative Meta-Analysis of the Effect of Lactobacillus Species on Weight Gain in Humans and Animals. Microbial Pathogenesis, 53, 100-108.https://doi.org/10.1016/j.micpath.2012.05.007