Open Journal of Medical Psychology
Vol.1 No.3(2012), Article ID:21122,7 pages DOI:10.4236/ojmp.2012.13008
Identifying Distinct Quitting Trajectories after an Unassisted Smoking Cessation Attempt: An Ecological Momentary Assessment Study
Department of Clinical Psychology and Psychotherapy, Institute of Psychology, University of Berne, Berne, Switzerland
Email: monica.bachmann@ptp.unibe.ch
Received April 5, 2012; revised May 10, 2012; accepted June 3, 2012
Keywords: Smoking Cessation; Lapse; Relapse Process; Ecological Momentary Assessment; Self-Quitter
ABSTRACT
Objectives: This study aimed at identifying distinct quitting trajectories over 29 days after an unassisted smoking cessation attempt by ecological momentary assessment (EMA). In order to validate these trajectories we tested if they predict smoking frequency up to six months later. Methods: EMA via mobile phones was used to collect real time data on smoking (yes/no) after an unassisted quit attempt over 29 days. Smoking frequency one, three and six months after the quit attempt was assessed with online questionnaires. Latent class growth modeling was used to analyze the data of 230 self-quitters. Results: Four different quitting trajectories emerged: quitter (43.9%), late quitter (11.3%), returner (17%) and persistent smoker (27.8%). The quitting trajectories predicted smoking frequency one, three and six months after the quit attempt (all p < 0.001). Conclusions: Outcome after a smoking cessation attempt is better described by four distinct trajectories instead of a binary variable for abstinence or relapse. In line with the relapse model by Marlatt and Gordon, late quitter may have learned how to cope with lapses during one month after the quitting attempt. This group would have been allocated to the relapse group in traditional outcome studies.
1. Introduction
The definition of relapse depends on the underlying disorder model [1]. The disease model produces a binary restriction on the possible range of outcomes. A person can either be abstinent or relapsed. In the traditional outcome literature of addiction the definition of relapse is based on the disease model (outcome-related view) [2]. This approach aims to assess who relapses or what predicts relapse [3] e.g. [4,5]. A lapse is defined as a relapse [6] and individuals are either abstinent or relapsed [7-9]. However, as seen in the relapse model, lapses do not lead to a relapse in every case [2].
The relapse model of Marlatt and Gordon has a different approach. In this model, relapse is seen as a transitional process (process-oriented view). The appearance of a lapse is viewed as a fork in the road and defined as the initial use of substance or a violation of a self-imposed rule. One of the two paths leads to the former problem level (relapse or total collapse), the other path is a continuation in the positive change [2]. Shiffman defines lapse as a limited episode of smoking [3].
To assess the relapse process multiple time points are needed. Several research groups published studies using the Ecological Momentary Assessment (EMA) to study the relapse process [10-13].
Distinct patterns of the relapse process were identified in two studies [14,15]. Furthermore, another study, which focused on the cigarette use reduction process found three distinct trajectories [16]. The goal of the first two studies was to identify subgroups in the relapse process. These studies report evidence for three [15] and five [14] quitting trajectories. Quitters, reducers and persistent smokers were identified in a sample of Chinese smokers over 6 months time. This sample (N = 402) was aged 12 to 25 years, received quit line service and smoked at least 5 cigarettes per day. On average the study participants had a mild to moderate level of nicotine dependency (M = 3.3, SD = 2.2). The reducers were the largest group (56.2%), followed by 28.9% persistent smokers and 14.9% quitters. Five distinct trajectories were identified in a sample of daily female smokers, mean age 45.5 who attended an intensive nonmedication cognitive-behavioral therapy (N = 108) over one year. On average those participants had a nicotine dependency score of 5 (SD = 1.2). 27% of the sample maintained abstinent, 8% were low-level users, 17% moderate users, 15% slow-returners, and 33% quick-returners after one year. As this approach is explorative, the examination of how the classes related to a distal outcome variable i.e. frequency of smoking in a follow-up is a good way to validate the classes. Both studies did not validate their classes further.
Based on the relapse model and prior evidence, we assume that more than two classes (abstinent/relapsed) exist among self-quitters in their relapse process. Our primary aim of this study is to identify trajectories of the relapse process in self-quitters. Furthermore we want to assess if these trajectories predict smoking frequency one, three and six months after the quit attempt.
2. Method
2.1. Participants and Procedure
Participants aged 20 - 40 years were recruited through newspapers, magazines, radio, the Internet, Facebook, our study homepage, mailing lists, and flyers. The smoking prevalence among 20 - 24-year-olds is the highest and declines afterwards [17]. All pertinent study information was available via our homepage. Individuals provided informed consent prior to participating. Inclusion criteria were: 1) smoking at least 10 cigarettes per day over a minimum of one year; and 2) intending to make an unassisted quit attempt in the next 30 days. After enrolling into the study, participants completed online questionnaires. The first questionnaire was filled in at baseline, the second one month after the quit attempt, followed by 3 and 6 months after the quit attempt. All participants received 100 Swiss Francs if they participated to the end of the study.
The data collection for the EMA combined timeand event sampling strategies. Participants used their mobile phones and were prompted to complete a short questionnaire at three random times a day. In situations where participants experienced an intense urge to smoke or smoked they were directed to download a short questionnaire (event sampling). The ambulant measurement took place over 29 days.
A total of N = 269 study participants who made a quit attempt were included. Of these 269 self-quitters, only those 230 self-quitters who had answered text messages at least for 3 days during 29 days were included into the current analysis. This is the minimum number of measurement points to estimate linear growth curves. The average number of answered text messages per participant was 20.92 (range 3 to 29).
The majority of the participants were men (76%), with a mean age of 28.0 years (SD = 5.57). Most had a Swiss citizenship (91.7%), were not married (83.9%), had experienced a previous quit attempt (83.5%) and had a low to very low nicotine dependency score (M = 3.7, SD = 1.8) (67.9%).
2.2. Measures
At baseline (T1), study participants completed an online questionnaire containing sociodemographic variables including gender, age, nationality, marital status, and smoking history such as previous quit attempt, and nicotine dependency.
In the ecological momentary assessment after the quit attempt one variable assessed the outcome variable. Have you smoked since the last text message? The response was either yes or no. If participants smoked in one of the three measurement points, then participants were given the value smoking (yes) at that day.
One, three and six months after the smoking cessation attempt, participants reported the frequency of smoking in the last month. Response categories were 1 = “never”, 2 = “one to three times a month”, 3 = “one to six times a week”, and 4 = “daily”.
2.3. Data Analysis
To identify discrete classes with similar patterns in smoking over 29 days, Latent Class Growth Model with binary outcome (LCGM) was used (Mplus 6.1.1.) [18]. Firstly, the typical trajectories of smoking cessation process were identified based on the assumption of linear relationship. Linear, quadratic and cubic models were estimated. As the quadratic and cubic term was not significant in any of the four trajectories, the linear model was applied.
To choose the number of classes, every model fit was evaluated using different criteria. The BootstrappedLikelihood Ratio Test (BLRT), the Bayesian Information Criterion (BIC), the Entropy, the average posterior probabilities for class membership, the greater drop from one to the other model in the model fit indices, and the number of participants in each class were taken into account.
Regression analysis was used to test whether class membership of the quitting trajectories predicts the frequency of smoking one, three and six months after the quit attempt.
3. Results
3.1. Descriptive Results
Of the 230 participants 18.7% (n = 43) did not smoke over 29 days of EMA. More males (14.4%) than females (4.3%) did not smoke. The majority (61.3%) of the 230 participants did not smoke on the first day after quitting; these were 18.3% female and 43% male compared to 14.8% female and 23.9% male who smoked.
3.2. Identification of Distinct Quitting Trajectories
A two-, three-, fourand five-class model was tested. Based on the goodness-of-fit indices, the theoretical background, the interpretability and the size of the classes, we preferred the four-class model as the best fitting model. As presented in Table 1 the BIC steadily decreased from twothrough five-class-model as well as the Entropy. The BLRT also slightly favored a five-class solution (four vs. five: p < 0.001). However a larger drop in all goodness-of-fit indices of the LCGM occurred from the threeto the four-class model compared to the drop from the fourto the five-class model. Furthermore in the five-class solution, the additional small class (8.1% of the participants) was characterized by the same course, but a slightly higher intercept than the quitter class. Therefore we preferred the more parsimonious four-class solution which identified distinct and meaningful trajectories that had high average probabilities for class membership (0.83 to 0.93) and also consisted of enough large grouping sizes (12.5% to 42%).
Figure 1 illustrates the four quitting trajectories. Quitters (n = 101, 43.9%) included individuals with persistent abstinence over 29 days. They had consistently low probabilities of smoking over 29 days. Participants in the late quitters class (n = 26, 11.3%) had a later onset of not smoking. This group had initially a high probability of smoking, however, the probability decreased gradually. Those in the returners class (n = 39, 17%) included individuals with increasing smoking. Those participants had an initially modest probability of smoking that increased over 29 days after the quit attempt. Finally, persistent smokers (n = 64, 27.8%) smoked over 29 days with a consistently high probability of smoking.
The quitting trajectories did not differ in terms of gender, marital status, nationality, previous quit attempt, and nicotine dependency (all p > 0.10). Only age resulted in a significant effect on quitting trajectories, F(3, 226) = 5.57, p < 0.01. Quitters (M = 26.4, SD = 4.7) were younger than persistent smokers (M = 29.5, SD = 6.0) and late quitters (M = 29.9, SD = 6.2).
3.3. Predictive Validity of Quitting Trajectories
Regression analysis1 showed that the trajectories significantly predicted smoking frequency one month, (β = .83, p < 0.001) three (β = .64, p < 0.001) and six months (β = .48, p < 0.001) after the quit attempt. The returners smoked less frequently than persistent smokers (one month: β = –.57, p < 0.001; three month: β = –.25, p < 0.05; six month: β = –.21, p = 0.09). Late quitters smoked more than quitters (one month: t1: β = .56, p < 0.001; three month: β = .21, p < 0.05; six month: β = .16, p = 0.14).
Table 2 specifies the smoking frequency in the distinct trajectory groups. Quitters have a probability of 55% of being abstinent at one month, 47% at three months and 40% at six months after the quit attempt. In persistent smokers the probability of daily smoking increased over time (66% to 80%). In the returner group most participants (96%) were occasional smokers and smoked one to six times a week one month after the quit attempt. At three and six months after the quit attempt the probability of daily smoking increased from 41.6% to 51.1% and decreased in smoking one to six times a week from 50.4% to 34.4%. Most of the late quitter (66.3%) smoked one to three times in the last month prior to the quit attempt. Three and six months after the quit attempt late quitters either smoked on a daily basis or did not smoke.
4. Discussion
This study identified four distinct quitting trajectories during one month after an unassisted smoking cessation attempt. These quitting trajectories were a good predictor for smoking frequency up to six months later. Almost half of the participants were in the stable quitter’s class (43.9%) and 27.8% in the class of persistent smokers. About 28% of the self-quitters showed unstable quitting trajectories. Returners (17%) started with a low probability of smoking, similar to the probability of stable quitters
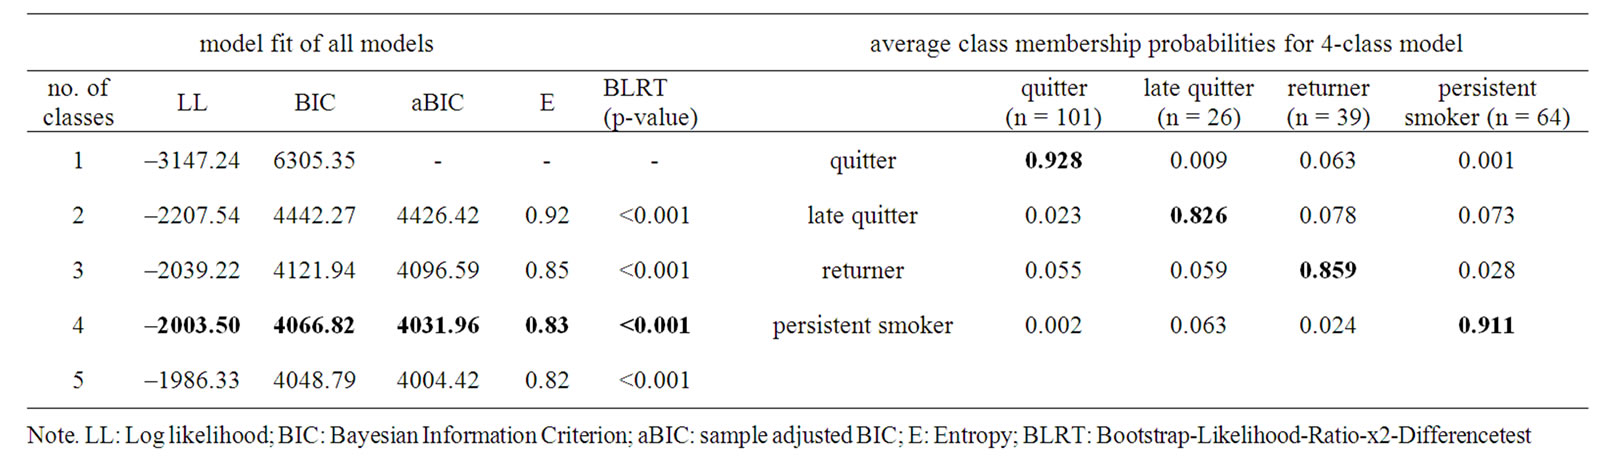
Table 1. Model fit of all growth mixture models and average class membership probability for the final four-class model.
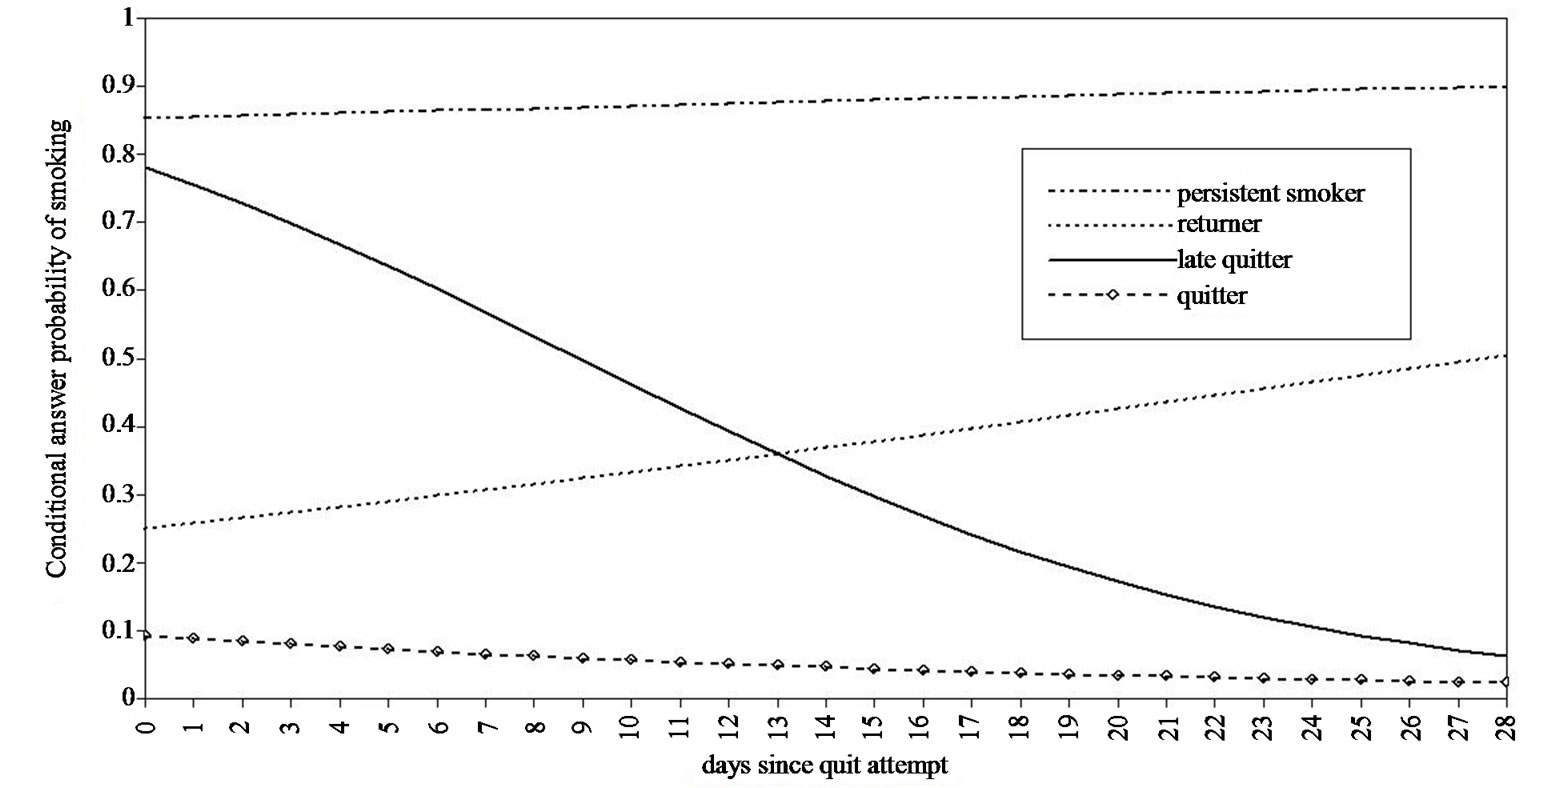
Figure 1. Quitting trajectories of self-quitters over 29 days.
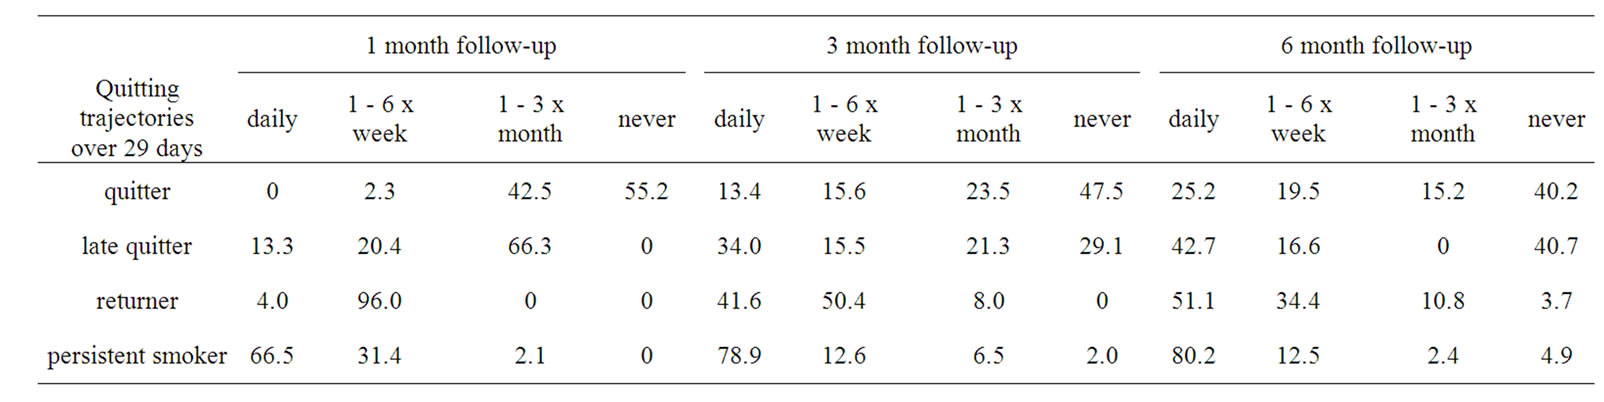
Table 2. Smoking frequency at follow-ups related to the distinct quitting trajectories (proportions of members of the trajectories).
and increased their smoking risk over 29 days after the smoking cessation attempt. Late quitters (11.3%) started with a high probability of smoking at the beginning of the quit attempt and had then a later onset of not smoking. These results support our assumption that more than two quitting trajectories exist, which differ compared to outcome studies. In those studies individuals are either abstinent or have relapsed [6-9]. In outcome studies the abstinence rate one month after the quit attempt varies between 14.6% and 42.1% [4,9]. Three months after the quit attempt 20.2% were abstinent when participating in a smoking cessation course and 8.5% as self-quitters [4]. Depending on the definition of relapse in outcome studies, in our study 43.9% were abstinent (quitters) 29 days after the quit attempt. When implementing the definition of Marlatt and Gordon, then 55.2% (quitters and late quitters) were abstinent. A smaller percentage (44.8%) of participants relapsed; these were persistent smokers and returners. Based on the two different definition of relapse, a higher percentage of abstinence exists in the relapse model compared to the disease model (55.2% to 43.9%). The disease model and the outcome studies have a more absolute way of defining the assignment to one of the two extreme groups compared to the relapse model. The dichotomous operationalization regarding the disease model is simple as even a single draw on a cigarette is already seen as a failure as there was a loss of control. The relapse model on the other hand takes lapses in the relapse process into account. Lapses might lead to a relapse or to abstinence and might be a warning signal indicating that the target goal is in danger [2]. This approach pictures the relapse process more adequately. In our case, four different quitting trajectories illustrate the relapse process. Especially the two unstable trajectories are of interest as these show variation in their behavior.
This study built on previous work on quitting trajectories [14,15] compared to the disease model, where trajectory analysis identified homogeneous subpopulations. However our trajectory-results differ from previous research, which distinguished three and five quitting trajectories. Overall, similar extreme groups (abstinent and relapsed) were identified in all three studies but the unstable trajectories are different in all studies. The returner-class in our study is comparable with the reducerclass [15] and the moderate users-class [14]. Late quitter is a newly identified group compared to both other studies. As we can see from our follow-up data, a lapse does not always lead to a permanent relapse. This group should be carefully analyzed, as a lapse might be a warning signal for them indicating that the target goal is in danger [2]. They show some smoking at the beginning of the quitting process but then get on the path with a positive change [2] and do not experience the abstinence violation effect [2].
The different results regarding quitting trajectories could be explained through the following differences. Firstly, a different operationalization of the dependent smoking variable i.e. the percentage of change in daily cigarette consumption [15] was used. Secondly the time frame between measurements and over the whole study, i.e. 6 to 12 months time frame [14,15] is different. Thirdly the sample characteristics could influence the results, i.e. 12 to 25 year old daily smokers who called the smoking cessation hotline (M = 18.7 years, SD = 3.7) [15] or weight-concerned female smokers who received intensive nonmedication cognitive-behavioral therapy (M = 45.5, SD = 10.4) [14]. Finally, different methods of data collection i.e. retrospective self-report [15] have been shown to influence results due to recall bias. Despite the differences regarding the number of classes, the mentioned studies and our own work support the assumption that subpopulations exist in the relapse process.
As opposed to our real-time approach, both studies [14,15] used a retrospective approach. This approach is more prone to memory and to cognitive judgment biases then the EMA-approach. As data are assessed retrospecttively and on a daily basis by averaging the number of cigarettes smoked in the past 30 days, short-term changes in smoking behavior between the follow-ups were not taken into account [15]. The first days after the quit attempt are however very important, as the majority of smokers relapsed within eight days [19]. Therefore an investigation with a high temporal resolution at the beginning of the quit attempt is beneficial as the relapse process is assessed at greater detail and more accurately.
Based on our design, the quitting trajectories were validated by the frequency of smoking one month after the smoking cessation attempt. The returners smoked significantly less frequently than persistent smokers and late quitters smoked significantly more than quitters. The quitting trajectories also predicted the frequency of smoking in the three and six month follow-up. As neither study [14,15] performed these additional analyses, this research supports the validity of distinct quitting trajectories. In the trajectories, a clear pattern regarding smoking frequency one month after the quit attempt was found. Never smoking was only present in abstinent smokers. Late quitters smoked mostly one to three times a month. This group might have lapsed but successfully coped and have a positive outcome in the real time data 29 days after the quit attempt. Returners can be described as participants who reduced their smoking behavior to one to six times per week. Persistent smokers mainly continued smoking daily. At the three months follow up, most persistent smokers smoked daily, and most quitters did not smoke. Returners mostly smoked one to six times a week and on a daily basis six months later. In late quitters the pattern was less clear with nearly the same amount of participants smoking daily or never.
Knowledge about the four distinct quitting trajectories over 29 days may help tailoring smoking cessation interventions. In our study sociodemographic variables, apart from age, did not differ between quitting trajectories. Quitters were significantly younger than persistent smokers and late quitters. In young smokers for example, the ability to quit smoking, attitude towards smoking, and daily consumption were related to quitting trajectories [15]. These predictive variables should be assessed in a next step. Based on these variables, a prediction of the quitting trajectories membership is possible.
The majority of our sample had a low to a very low nicotine dependency score, which is similar to the results of the study of Wong et al. [15]. In the study of Conklin et al. [14] the level of nicotine dependency was higher. Studies show that smoking fewer cigarettes per day [20,21] and lower level of nicotine dependency predict successful quitting. Based on these results, we assume that higher nicotine dependency lead to a smaller group of quitters. However, more dependent smokers are more likely to undertake treatment while quitting compared to less dependent smokers [22].
This study has several limitations that should be mentioned. Results of this study may have been influenced by the self-selective sample even though a broad recruitment strategy was used. Smoking behavior was assessed by self-report and not validated by biochemical tests. As social acceptance of smoking is steadily declining, we cannot exclude the possibility of participants over-reporting successful self-quitting for reasons of social desirability. Further, the EMA data were only available over a month’s time. However based on the burden for the participants, this limited time frame was chosen to reduce the drop out. It would be of interest to assess the relapse process over a longer period of time. Further analyses with different and larger samples should be carried out in order to verify the generalizability of the results and the classes identified.
This is the first study to examine quitting trajectories in self-quitters with EMA. Our findings underline the importance of identifying distinct quitting trajectories in the relapse process, as four different subgroups exist and these predict smoking frequency at follow ups. Our results show that quitting is more complex and that not only abstinent and relapsed self-quitters exist as presented in various studies based on the disease model.
5. Acknowledgements
We would like to thank Michel Hosmann for the IT support, and Esther Wandeler for her help with the recruitment. We also thank the Swiss National Science Foundation for funding this study (grant number SNF 100014_ 126648/1).
REFERENCES
- N. Knoll, U. Scholz and N. Rieckmann, “[Introduction into Health Psychology] Einführung in Die Gesundheitspsychologie,” Ernst Reinhardt Verlag, München, 2005.
- G. A. Marlatt, “Relapse Prevention: Theoretical Rationale and Overview of the Model,” In: G. A. Marlatt and J. R. Gordon, Eds., Relapse Prevention, Guilford Press, New York, 1985, pp. 3-70.
- S. Shiffman, “Reflections on Smoking Relapse Research,” Drug and Alcohol Review, Vol. 25, No. 1, 2006, pp. 15-20. doi:10.1080/09595230500459479
- I. Elfeddali, C. Bolman, M. J. J. M. Candel, R. W. Wiers and H. De Vries, “The Role of Self-Efficacy, Recovery Self-Efficacy, and Preparatory Planning in Predicting Short-Term Smoking Relapse,” British Journal of Health Psychology, Vol. 17, No. 1, 2012, pp. 185-201. doi:10.1111/j.2044-8287.2011.02032.x
- T. Kinnunen, K. Doherty, F. S. Militello and A. J. Garvey, “Depression and Smoking Cessation: Characteristics of Depressed Smokers and Effects of Nicotine Replacement,” Journal of Consulting and Clinical Psychology, Vol. 64, No. 4, 1996, pp. 791-798. doi:10.1037/0022-006X.64.4.791
- J. L. Westmaas and K. Langsam, “Unaided Smoking Cessation and Predictors of Failure to Quit in a Community Sample: Effects of Gender,” Addictive Behaviors, Vol. 30, No. 7, 2005, pp. 1405-1424. doi:10.1016/j.addbeh.2005.03.001
- A. Hyland, Q. Li, J. E. Bauer, G. A. Giovino, C. Steger and K. M. Cummings, “Predictors of Cessation in a Cohort of Current and Former Smokers Followed over 13 Years,” Nicotine & Tobacco Research, Vol. 6, No. 6, 2004, pp. 363-369. doi:10.1080/14622200412331320761
- K. M. Menninga, A. Dijkstra and W. A. Gebhardt, “Mixed Feelings: Ambivalence as a Predictor of Relapse in Ex-Smokers,” British Journal of Health Psychology, Vol. 16, No. 3, 2011, pp. 580-591. doi:10.1348/135910710X533219
- I. Berlin and L. S. Covey, “Pre-Cessation Depressive Mood Predicts Failure to Quit Smoking: The Role of Coping and Personality Traits,” Addiction, Vol. 101, No. 12, 2006, pp. 1814-1821. doi:10.1111/j.1360-0443.2006.01616.x
- S. Shiffman and A. J. Waters, “Negative Affect and Smoking Lapses: A Prospective Analysis,” Journal of Consulting and Clinical Psychology, Vol. 72, No. 2, 2004, pp. 192-201. doi:10.1037/0022-006X.72.2.192
- L. Cofta-Woerpel, J. B. McClure, Y. Li, D. Urbauer, P. M. Cinciripini and D. W. Wetter, “Early Cessation Success or Failure among Women Attempting to Quit Smoking: Trajectories and Volatility of Urge and Negative Mood during the First Postcessation Week,” Journal of Abnormal Psychology, Vol. 120, No. 3, 2011, pp. 596-606. doi:10.1037/a0023755
- T. M. Piasecki, D. E. Jorenby, S. S. Smith, M. C. Fiore and T. B. Baker, “Smoking Withdrawal Dynamics: I. Abstinence Distress in Lapsers and Abstainers,” Journal of Abnormal Psychology, Vol. 112, No. 1, 2003, pp. 3-13. doi:10.1037//0021-843X.112.1.3
- R. M. Van Zundert, S. G. Ferguson, S. Shiffman and R. Engels, “Dynamic Effects of Craving and Negative Affect on Adolescents Smoking Relapse,” Health Psychology, Advance Online Publication, 2011. doi:10.1037/a0025204
- C. A. Conklin, K. A. Perkins, A. J. Sheidow, B. L. Jones, M. D. Levine and M. D. Marcus, “The Return to Smoking: 1-Year Relapse Trajectories among Female Smokers,” Nicotine & Tobacco Research, Vol. 7, No. 4, 2005, pp. 533-540. doi:10.1080/14622200500185371
- D. C. N. Wong, S. S. C. Chan, D. Y. T. Fong, A. Y. M. Leung, D. O. B. Lam and T.-H. Lam, “Quitting Trajectories of Chinese Youth Smokers Following Telephone Smoking Cessation Counseling: A Longitudinal Study,” Nicotine & Tobacco Research, Vol. 13, No. 9, 2011, pp. 848-879. doi:10.1093/ntr/ntr086
- B. B. Hoeppner, M. S. Goodwin, W. F. Velicer, M. E. Mooney and D. K. Hatsukami, “Detecting Longitudinal Patterns of Daily Smoking Following Drastic Cigarette Reduction,” Addictive Behaviors, Vol. 33, No. 5, 2008, pp. 623-639. doi:10.1016/j.addbeh.2007.11.005
- R. Keller, T. Radke, H. Krebs and R. Hornung, “[Tobacco Consumption in the Swiss Population between 2001 and 2010] Der Tabakkonsum in der Schweizer Bevölkerung in den Jahren 2001 bis 2010,” Universität Zürich, Psychologisches Institut, Sozial-und Gesundheitspsychologie, Zürich, 2011.
- L. K. Muthén and B. O. Muthén, “Mplus User’s Guide,” Muthén & Muthén, Los Angeles, 1998-2011.
- J. R. Hughes, J. Keely and S. Naud, “Shape of the Relapse Curve and Long-Term Abstinence among Untreated Smokers,” Addiction, Vol. 99, No. 1, 2004, pp. 29-36. doi:10.1111/j.1360-0443.2004.00540.x
- S. J. Japuntich, A. M. Leventhal, M. E. Piper, D. M. Bolt, L. J. Roberts, M. C. Fiore and T. B. Baker, “Smoker Characteristics and Smoking-Cessation Milestones,” American Journal of Preventive Medicine, Vol. 40, No. 3, 2011, pp. 286-294. doi:10.1016/j.amepre.2010.11.016
- J. K. Ockene, K. M. Emmons, R. J. Mermelstein, K. A. Perkins, D. S. Bonollo, C. C. Voorhees and J. F. Hollis, “Relapse and Maintenance Issues for Smoking Cessation,” Health Psychology, Vol. 19, No. 1S, 2000, pp. 17- 31. doi:10.1037//0278-6133.19.Suppl1.17
- S. Shiffman, S. E. Brockwell, J. L. Pillitteri and J. G. Gitchell, “Individual Differences in Adoption of Treatment for Smoking Cessation: Demographic and Smoking History Characteristics,” Drug and Alcohol Dependence, Vol. 93, No. 1-2, 2008, pp. 121-131. doi:10.1016/j.drugalcdep.2007.09.005
NOTES
1The regression analysis was carried out based on the smoking severity of the quitting trajectories, with 1 = “abstinent”, 2 = “late quitter”, 3 = “returner”, and 4 = “persistent smoker”.