American Journal of Analytical Chemistry
Vol.07 No.11(2016), Article ID:71906,19 pages
10.4236/ajac.2016.711071
Identification, Isolation and Structure Confirmation of Forced Degradation Products of Sofosbuvir
Vasudev Pottabathini1, Vijayacharan Gugulothu1, Muralidharan Kaliyaperumal2, Satyanarayana Battu1*
1Department of Chemistry, University College of Science, Osmania University, Hyderabad, Telangana, India
2GVK Bio Sciences Pvt. Ltd., Hyderabad, Telangana, India

Copyright © 2016 by authors and Scientific Research Publishing Inc.
This work is licensed under the Creative Commons Attribution International License (CC BY 4.0).
http://creativecommons.org/licenses/by/4.0/


Received: September 30, 2016; Accepted: November 7, 2016; Published: November 10, 2016
ABSTRACT
A new stability indicating reverse phase chromatographic method was developed for the analysis of Heptisis C Drug Sofosbuvir. The developed UPLC method was superior in technology to conventional RP-HPLC with respect to resolution, speed, solvent consumption and analysis cost. Sofosbuvir was subjected to the thermal, hydrolytic, oxidative, and photolytic degradation, according to ICH guidelines. The drug depicted degradation in acidic, basic and oxidative conditions and it was stable to other stress conditions (thermal and photolytic). Identified degradation products were isolated using mass supported auto purification system and characterized by NMR techniques (1H NMR, D2O Exchange, 13C NMR, 31P NMR, 19F NMR, HSQC and HMBC) and HRMS experiments. Isolated acid degradation impurity was showing molecular weight of 416.08, molecular formula C16H18FN2O8P and its name as (R)-((2R, 3R, 4R, 5R)-5-(2,4-dioxo-3,4-dihydropyrimidin-1(2H)-yl)-4-fluoro-3-hy- droxy-4-methyltetrahydrofuran-2-yl)methyl phenyl hydrogen phosphate. Isolated base degradation impurity-A was showing molecular weight of 453.13, molecular formula C16H25FN3O9P and its name as (S)-isopropyl 2-((R)-(((2R, 3R, 4R, 5R)-5-(2, 4-dioxo-3,4-dihydropyrimidin-1(2H)-yl)-4-fluoro-3-hydroxy-4-methyltetrahydrofuran-2-yl)methoxy)(hydroxy)phosphorylamino)propanoate. Isolated base degradation impurity-B was showing molecular weight of 411.08, molecular formula C13H19FN3O9 P and its name as (S)-2-((R)-(((2R, 3R, 4R, 5R)-5-(2,4-dioxo-3,4-dihydropyrimidin-1 (2H)-yl)-4-fluoro-3-hydroxy-4-methyltetrahydrofuran-2-yl)methox-y)(hydroxy)phos- phorylamino)propanoic acid. In oxidative degradation study, degradation was observed very less and with obtained quantity (less than 2 mg) recorded 1H NMR and HRMS analysis. From the spectral data degradation product was showing molecular weight of 527.15, molecular formula C22H27FN3O9P and its name as (S)-isopropyl 2-((S)-(((2R, 4S, 5R)-5-(2,4-dioxo-3,4-dihydropyrimidin-1(2H)-yl)-4-fluoro-4-me- thyl-3-oxotetrahydrofuran-2-yl)methoxy)(phenoxy)phosphorylamino)propanoate. The developed chromatographic method was validated as per ICH guidelines and proved suitable for the stability testing and quality control of the drug Sofosbuvir.
Keywords:
Sofosbuvir, Forced Degradation, Unknown Impurities, Isolation, Characterization

1. Introduction
Sofosbuvir, whose chemical name is Isopropyl (2S)-2-[[[(2R, 3R, 4R, 5R)-5-(2,4-dio- xopyrimidin-1-yl)-4-fluoro-3-hydroxy-4-methyl-tetrahydrofuran-2-yl]methoxy-phenoxy- phosphorryl]amino] propanoate, has molecular formula and the weight of C22H29FN3O9P & 529.16 g/mol, respectively. Sofosbuvir is a direct acting pyrimidine nucleotide analog representing the first NS5B HCV polymerase inhibitor [1] . The drug was recently approved by the US FDA and the European Medicines Agency and has become commercially available for the treatment of Hepatitis C in the US in late 2013 and in several European countries in early 2014 [2] . Sofosbuvir is administered at a dosage of 400 mg once daily, taken with or without food, and has an effective activity against all HCV genotypes. Sofosbuvir is also available as a fixed-dose combination (co-formulation in one tablet) with ledipasvir, HCV NS5A inhibitor, with effective anti-HCV activity. The WHO Guidelines for the screening and treatment of persons with hepatitis C infection recommend Sofosbuvir in combination with ribavirin in genotypes 1, 2, 3 and 4 HCV infection, either with or without pegylated interferon (depending on the HCV genotype) [3] [4] . Sofosbuvir is used in the treatment of chronic HCV genotype 1, 2, 3, or 4 infections in adults, including those with hepatocellular carcinoma awaiting liver transplantation and those with HIV co-infection. Limited data is available for treatment of chronic HCV infection caused by genotype 5 or 6 [5] [6] [7] .
Sofosbuvir is a pro drug. It is metabolized in the liver to form the pharmacologically an active nucleotide analogue tri-phosphate GS-461203. The metabolic activation pathway involves sequential hydrolysis of the carboxyl ester moiety catalyzed by human cathepsin A or carboxyl esterase 1 and phosphoramidate cleavage by histidine triad nucleotide-binding protein 1 followed by phosphorylation by the pyrimidine nucleotide bio- synthesis pathway [8] .
A review of the literature survey did not reveal the presence of assay method for the Sofosbuvir dosage form by using UPLC technique; nowhere reported degradation pathways and degradation products. Few UPLC-ESI MS/MS methods [9] [10] [11] are available for the quantification of Sofosbuvir and its metabolites in plasma and some others are combined with ribavarin and lidipasvir. These methods are developed using various internal standards and applicable to pharmacokinetic and bio-equivalence study. There is no method available for the routine analysis of Sofosbuvir in bulk and formulations in pharmaceutical industries. The present work deals with the development and validation of simple UPLC method for the quantification of Sofosbuvir, identification and isolation of forced degradation products of drug and this method can be used for the regular analysis of the Sofosbuvir in bulk and formulation industries. Chemical structure of Sofosbuvir was shown in Figure 1.
2. Experimental
2.1. Materials
The investigated drug Sofosbuvir 400 mg tablets were procured from local pharmacy. Buffers and solvents used for analysis were HPLC grade and purchased from Sigma Aldrich. Water used was Milli-Q grade.
2.2. Equipment
The UPLC system from waters was used for the method development and method validation consists of quaternary gradient pumps with auto sampler and auto injector connected with photo diode array detector controlled with Empower software. X- Bridge BEH C18 (100 × 4.6) mm 2.5 µ column was used from waters. Waters Mass mediated purification system was used to purify the degradation products. Mass mediated preparative HPLC equipped with waters pump module 2545, UV detector module 2996, mass detector module 3100, sample manager module 2767 and Masslynx data handling system was used. 0.1 % formic acid was used as makeup solution for purification. Xtimate C 18 (250 × 20) mm 5 µ column was used for purification of degradation products from Welch. Thermo fisher Exactive plus EMR Orbitrop was used for HRMS analysis of degradation products with X Caliber software. To record the NMR spectrums for the degradation products, Bruker 400 MHz advance NMR spectrometer was used. FT-IR spectrums were recorded using Shimadzu IR Affinity-1 FT IR spectrophotometer.
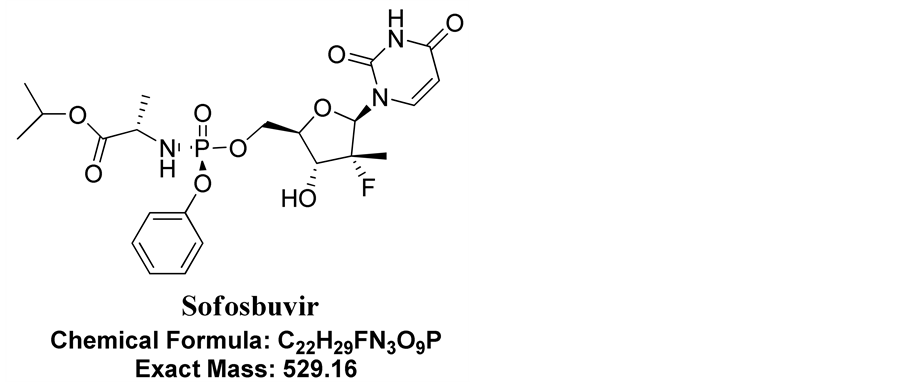
Figure 1. Chemical structure of Sofosbuvir.
2.3. Methods
Based on all the method development trials, X-Bridge TMBEH C18 (100 × 4.6) mm 2.5 µ column was used for the method development and validation. Combination of acetonitrile and 0.1% formic acid was selected as mobile phase with gradient elution. Gradient program was 0/10, 0.8/10, 1.5/35, 6.5/90, 8/90, 8.1/10, 10/10 with a flow rate of 0.6 mL/min at 35˚C temperature. The sample injection volume was 2.5 µL and all chromatograms were monitored at 260 nm wavelength.
Purification of all forced degradation products was carried out using Xtimate C 18 (250 × 20) mm 5 µ column with 0.1% formic acid as mobile phase with gradient elution. Gradient program was 0/5, 3/5, 10/40, 15/90, 15.1/5, 18/5 with a flow rate of 20 mL/min at ambient temperature. All crude degradation products were dissolved in mobile phase (50:50) and injection volume was 300 µL. All purification chromatograms were monitored at 260 nm wavelength.
Nuclear magnetic resonance (NMR) spectra were recorded at 400 MHz for 1H, 13C, 31P and 19F NMR. All degradation products spectrums were recorded in DMSO-d6 except Base degradation product-B. Base degradation product-B spectrums were recorded in MeOD due to less soluble in DMSO-d6. Carbon-Proton connectivity was evidenced by HSQC and HMBC experiments. The protons attached with hetero atoms were further confirmed with D2O exchange experiments.
To find out the exact molecular weights and molecular formulae of the degradation products High resolution mass spectrometry (HRMS) analysis was carried out using Orbitrop spectrometer. Data was acquired in positive.
To obtain the information about the presence of different functional groups in the degradation products, Infrared spectra (IR) were determined in the solid state as KBr dispersion medium.
2.4. Sample Preparation
2.4.1. Preparation of Standard and Sample Solutions
A stock solution of Sofosbuvir (100 µg∙mL−1) was prepared by dissolving an appropriate amount in the methanol and mobile phase. The concentrations of 5.0, 10.0, 15.0, 20.0, 25.0 µg∙mL−1 of Sofosbuvir solutions were prepared for calibration from stock solution.
Ten tablets were weighed to determine the average tablet weight and powdered in a mortar. Powder equivalent to 400 mg of Sofosbuvir was transferred into a 200 mL volumetric flask. Sample solution kept on a rotary shaker for 1 hr to disperse the material completely, followed by sonication for 30 min, cooled to room temperature and mixed well. The sample solution was filtered through a 0.45 μm Nylon-66 membrane syringe filter, and 1.5 mL of this solution was taken in a 200 mL volumetric flask and made up to volume with mobile phase (50:50) to the concentration 15 µg∙mL−1.
2.4.2. Generation of Stress Samples
As per ICH stability guidelines, different kinds of stress conditions i.e. heat, acidic, basic, oxidation and photolytic were employed [12] [13] . Acid decomposition of Sofosbuvir was conducted at 80˚C reflux in 1 N HCl solution for 10 h. Base degradation was conducted at 60˚C in 0.5 N NaOH solution for 24 h. For oxidative stress studies, drug was dissolved in 30% H2O2 at 80˚C for two days. Photolytic study of the dry drug was performed by exposure to 254 nm for 24 hr.
2.4.3. Preparation of Degradation Samples for Purification
Degradation was observed in acid, base and slightly in oxidative conditions. Directly 200 mg of Sofosbuvir was dissolved in 5 mL of 1 N HCl solution and reflux for 10 h. Degraded sample was neutralized with ammonium bicarobonate solution and resultant solution lyophilized to get crude solid sample, same was dissolved in 4 mL of mobile phase (50:50). For base degradation, 200 mg of Sofosbuvir was dissolved in 5 mL of 0.5 N NaOH solution and degraded sample was neutralized with HCl solution. Resultant solution was evaporated to get free solid and same sample was dissolved in 5 mL of mobile phase (50:50). For Oxidative degradation 200 mg sample was dissolved in 5 mL of 30% H2O2 at 80˚C for two days. Resultant solution was evaporated to get solid and dissolved in 5 mL of mobile phase (50:50).
3. Results and Discussions
3.1. Method Development of Chromatographic Conditions for Analysis of Sofosbuvir and Isolation of Degradation Products
The main object of this work was to develop new stability indicating analytical method for analysis of Sofosbuvir and isolation, characterization of degradation products. Forced degradation studies were carried out to identify the degradation products and prove the stability indicating nature of reverse chromatographic method. To achieve the objectives of the method, development was carried out as follows.
From the literature survey and based on functional groups of the compound it has been observed that drug Sofosbuvir is UV active compound. Photo diode array detector was selected to develop the stability indicating method and isolation of degradation products. From the initial experiments, the wavelength 260 was selected to identify the drug and degradation products.
To get separation of Sofosbuvir from its degradation products different chromatographic methods were tried using different stationary phases like C18, C8, Phenyl, Phenyl hexyl, cyano, RP C18, PFP. From the all trials it has been observed that X- Bridge C18 (100 × 4.6) mm 2.5 µ seems to be better eluting all peaks with good separation and peak shape.
For purification of degradation products different preparative columns were tried like X-Select CSH C18 (150 × 19) mm 5 µ, X-Bridge C18 (150 × 19) mm 5 µ, YMC Triart C18 (150 × 20) mm 10 µ Packed, X-Select CYANO (250 × 19) mm 5 µ, Xtimate C18 (250 × 20) mm 5 µ. Xtimate (250 × 20) mm 5 µ column was only showing good peak shape with elution time less than 1.5 minutes. Based on all experimental trails, Xtimate column was selected for purification.
To select the organic solvent for method development methanol and acetonitrile were tried. Compare to methanol, acetonitrile was showing good separations and less column back pressure so acetonitrile was selected as organic modifier for the method development. As we need to purify the degradation products, tried with volatile aque- ous mobile phases like ammonium acetate, ammonium bicarbonate, formic acid, trifluroacetic acid. Initial development was started with basic buffers like ammonium acetate and ammonium bicarbonate but peak was splitting in these conditions. In acidic conditions drug was showing good peak shape and separating all degradation products from drug. Finally 0.1% formic acid buffer was selected as aqueous buffer for good peak shape and system suitability results. Combination of acetonitrile and 0.1% Formic acid buffer achieved good separation, peak shape and good recovery of degradation products. Standard chromatogram of Sofosbuvir was shown in Figure 2.
3.2. Degradation Behavior of Sofosbuvir
Degradation was not found in thermal, photolytic condition which confirms that Sofosbuvir was found to be stable to thermal and photolytic degradation. The drug was found to be liable to acid hydrolysis as a total of 8.66% degradation was found (1N HCl 80˚C, up to 10 h reflux). The drug degradation was also found in base degradation of 45.97% (0.5 N NaOH 60˚C, 24 h) with an individual degradation product of 28.80% and 17.17%. Very less degradation was observed in oxidative degradation (0.79% degradation product was observed). Degradation details were shown in Table 1. Acid, base and oxidative degradation chromatograms were shown in Figures 3-5.
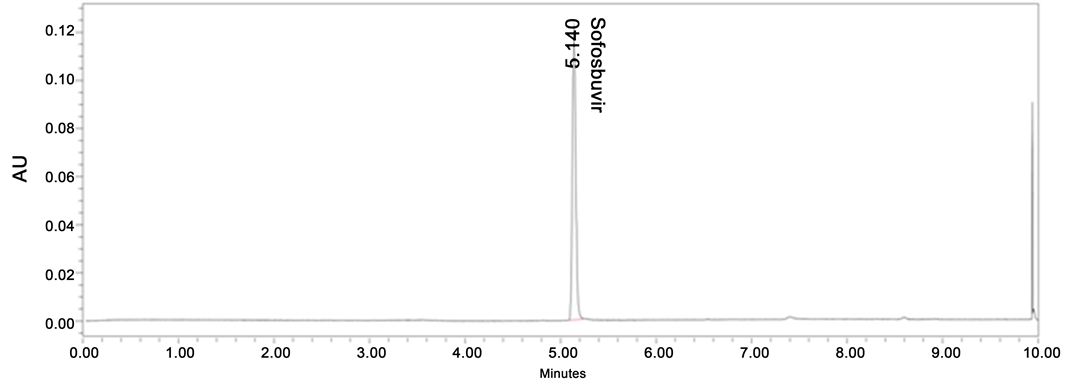
Figure 2. Standard chromatogram of Sofosbuvir.

Table 1. Degradation results of Sofosbuvir.
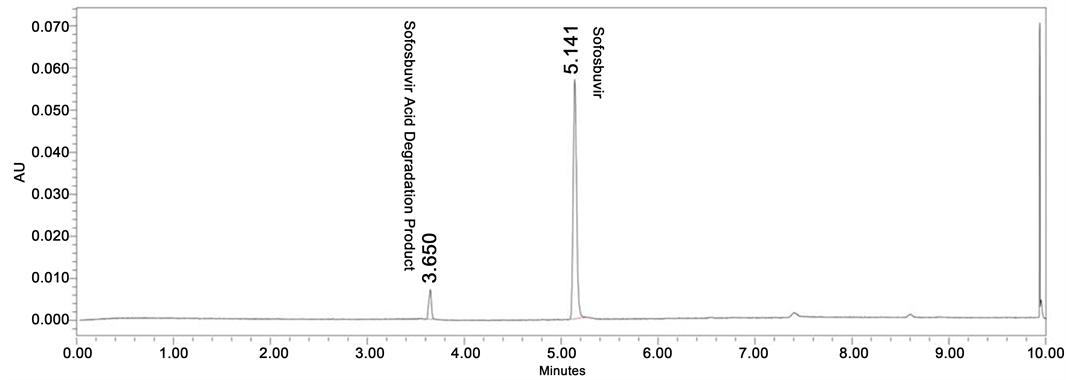
Figure 3. Acid degradation chromatogram of Sofosbuvir.
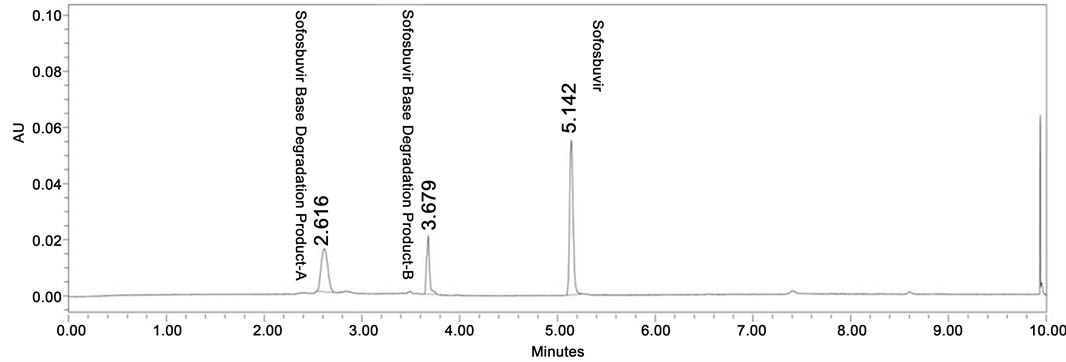
Figure 4. Base degradation chromatogram of Sofosbuvir.
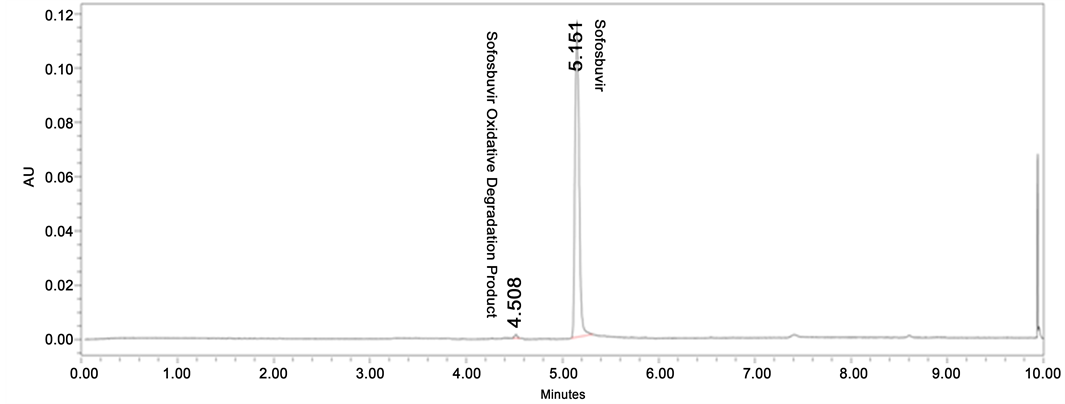
Figure 5. Oxidative degradation chromatogram of Sofosbuvir.
3.3. Isolation of Degradation Products of Sofosbuvir
The degradation was observed in acid, base and oxidative stress conditions. Purification was carried out by using the 0.1% formic acid buffer and acetonitrile as a mobile phase with Xtimate C18 (250 × 20) mm 5 μ. Crude sample solutions were injected in consecutive injections. The fractions had been collected on the basis of mass threshold parameters of total ion chromatogram. After completion of acid degradation crude sample purification collected all the fractions of mass 417.09 (M + H), pooled together and lyophilized to get free solid. In base degradation, fractions of mass 454.13 (M + H), mass 412.08 (M + H), pooled together separately and lyophilized to get free solids. In Oxidative degradation fractions of mass 528.15 (M + H), pooled together and lyophilized to get free solid.
3.4. Structure Confirmation of Degradation Products
To get structural imminent, the HRMS analysis was carried out on isolated acid degradation sample. Acid degradation product mass spectrum thus obtained was shown the protonated molecular ion m/z 417.0843, molecular formula C16H19FN2O8P with less error −3.5907 ppm. From the above data it is matching with expected structure of the acid degradation product. Structure of acid degradation product was further confirmed with spectroscopy techniques like 1H NMR, D2O Exchange, 13C, 31P, 19F NMR, HMBC, HSQC and FT-IR. NMR chemical shifts of degradation products were compared with the values of drug Sofosbuvir. In Proton NMR degradation product was showing only one methyl (doublet) group protons where as in drug four methyl groups present. From HSQC, methyl group attached carbon showing pattern of doublet. From this data it was confirmed that observed methyl group was attached to fluorine substituted furan ring. Presence of fluorine (From 19F spectra), phosphorous (From 31P spectra), aromatic five protons, substituted furan ring and substituted pyrimidine ring indicates breakage of Phosphorous and aliphatic chain attached NH bond. D2O Exchange proton spectrum clearly indicates presence of three heteroatom attached protons. Assigned structure, from the HMBC, HSQC correlations was exactly matching the structure of the degradation product. FT-IR major frequency values further confirmed the hydroxyl, amine and keto functional groups of the compound.
To get the structure confirmation, the HRMS analysis was carried out on isolated base degradation product-A. Base degradation product-A mass spectrum thus obtained was shown the protonated molecular ion m/z 454.1369, molecular formula C16H26FN3 O9P with less error −3.6314 ppm. From the above data it is matching with expected structure of the base degradation product-A. Structure of base degradation product-A was further confirmed with spectroscopy techniques like 1H NMR, D2O Exchange, 13C, 31P, 19F NMR, HMBC, HSQC and FT-IR. NMR chemical shifts of degradation products were compared with the values of drug Sofosbuvir. Degradation product was not showing five aromatic protons in proton NMR and five aromatic carbons in 13C NMR Spectrums. Remaining structure of the base degradation product-A was perfectly matching with the structure of the drug compound. From this it is clearly indicates the breakage of benzene ring from the phosphorous oxygen linkage. D2O Exchange proton spectrum clearly indicates presence of four heteroatom attached protons. Presence of fluorine (From 19F spectra), phosphorous (From 31P spectra), substituted furan ring and substituted pyrimidine ring were confirmed with HMBC and HSQC Correlations. FT- IR major frequencies further confirmed the presence of amine, hydroxyl and keto functional groups.
The HRMS analysis was carried out on isolated base degradation product-B, to confirm the structure. Base degradation product-B mass spectrum thus obtained was shown the protonated molecular ion m/z 412.0900, molecular formula C13H20FN3O9P with less error −3.7454 ppm. From the above data it is matching with expected structure of the base degradation product-B. Structure of base degradation product-B was further confirmed with spectroscopy techniques like 1H NMR, D2O Exchange, 13C, 31P, 19F NMR, HMBC, HSQC and FT-IR. NMR chemical shifts of degradation products were compared with the values of drug Sofosbuvir. Degradation product was not showing five aromatic protons in Proton NMR and five aromatic carbons in 13C NMR Spectrums. Isopropyl group protons and carbons were missing in degradation product. Remaining structure of the based degradation product-B was perfectly matching with the structure of the drug compound. From this it is clearly indicates the breakage of benzene ring from the phosphorous oxygen linkage and cleavage of ester linkage. As compound was only soluble in methanol, analysis was carried out in MeOD, so that hetero atom attached protons were replaced. Presence of fluorine (From 19F spectra), phosphorous (From 31P spectra), substituted furan ring and substituted pyrimidine ring were confirmed with HMBC and HSQC Correlations. FT-IR major frequencies, further confirmed the presence of acid, amino, hydroxyl and keto functional groups.
As degradation was observed very less in oxidative degradation condition, recovery of the product obtained was very less in quantity (less than 2 mg). To get the structure confirmation of degradation product, HRMS and 1H NMR analysis were carried out with available quantity. Oxidative degradation product mass spectrum thus obtained was shown the protonated molecular ion m/z 528.1525, molecular formula C22H28FN3 O9P with less error −3.1121 ppm. From the above data it is matching with expected structure of the oxidative degradation product. Structure of oxidative degradation product was further confirmed with 1H NMR, 31 P, and 19F NMR. NMR chemical shifts of degradation products were compared with the values of drug Sofosbuvir. Oxidative degradation was further confirmed with the loss of two mass units and missing of two protons in NMR. The lost two protons were hydroxyl proton and adjacent carbon attached proton, it indicates the formation of keto functional group on substituted furan ring.
Assigned structures of acid degradation product, base degradation product-A, base degradation product-B and oxidative degradation product were shown in Figure 6. NMR spectral data of degradation products were shown in Figures 7-13.
3.4.1. Acid Degradation Product Characterization
HRMS m/z 417.0843 [M + H]; 1H NMR: δ (DMSO-d6) 7.650 (1 H, d, H-2), 5.483 (1H, d,
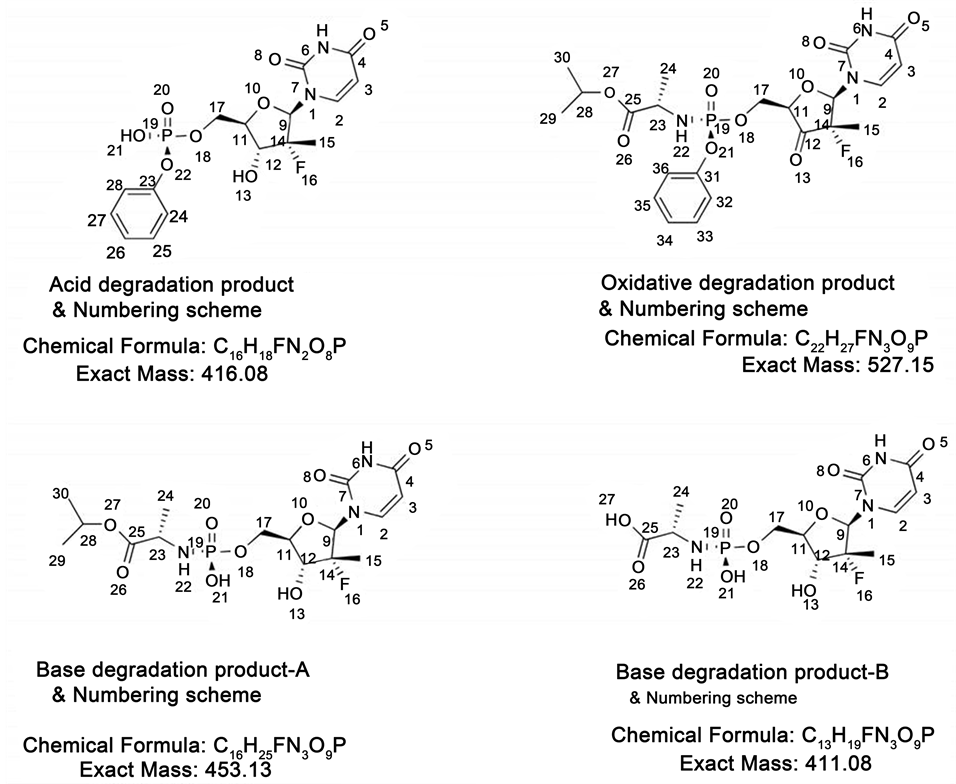
Figure 6. Chemical structures of Sofosbuvir degradation products and their numbering scheme.
H-3), 11.485 (1H, s, H-6), 6.012 (1H, d, H-9), 3.963 (1H, dd, H-11), 3.818 (1H, ddd/m, H-12), 3.523 (1H, d, H-13), 1.253 (3H, d, H-15), 4.171,4.274 (1H, dd, H-17), 5.981 (1H, d, H-21), 7.178 (1H, d, H-24), 7.297 (1H, t, H-25), 7.081 (1H, t, H-26), 7.297 (1H, t, H-27), 7.178 (1H, d, H-28); 13C NMR δ (DMSO-d6) 139.7 (C-2), 102.154 (C-3), 162.714 (C-4), 150.453 (C-7), 88.24 (C-9), 79.811 (C-11), 71.258 (C-12), 101.195 (C-14), 16.331 (C-15), 64.141 (C-17), 151.941 (C-23), 120.002 (C-24), 129.321 (C-25), 123.516 (C-26), 129.321 (C-27), 120.002 (C-28); 19F NMR δ (DMSO-d6)-159.365 (F-16); 31P NMR δ (DMSO-d6)-6.790 (P-19); HSQC (7.650-1H, 139.7-13C), (5.483-1H, 102.15-13C), (6.012- 1H, 88.24-13C), (3.963-1H, 79.811-13C), (3.818-1H, 71.258-13C), (1.253-1H, 16.331-13C), (4.171,4.274-1H, 64.141-13C), (7.178-1H, 120.002-13C), (7.297-1H, 129.321-13C), (7.081- 1H, 123.516-13C), (7.297-1H, 129.321-13C), (7.178-1H, 120.002-13C); HMBC (7.650-1H, 162.714, 150.453-13C), (1.253-1H, 71.258, 88.24, 101.195-13C), (7.178-1H, 151.941, 120.002, 123.516-13C), (7.297-1H, 151.941, 129.321-13C), (7.081-1H, 120.002, 129.321-13C), (7.297- 1H, 151.941, 129.321-13C), 7.178-1H, 151.941, 120.002, 123.516-13C); FT-IR (KBr): 3437.30, 3102.63 (Hydroxy), 3066.95 (Amine), 1691.64 (Keto) cm−1.
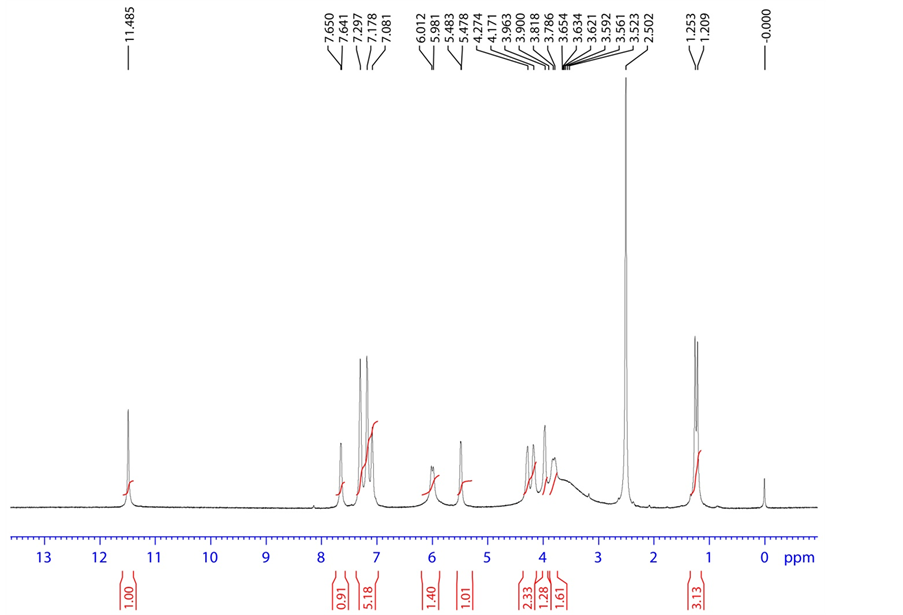
Figure 7. 1H NMR spectrum of acid degradation product.
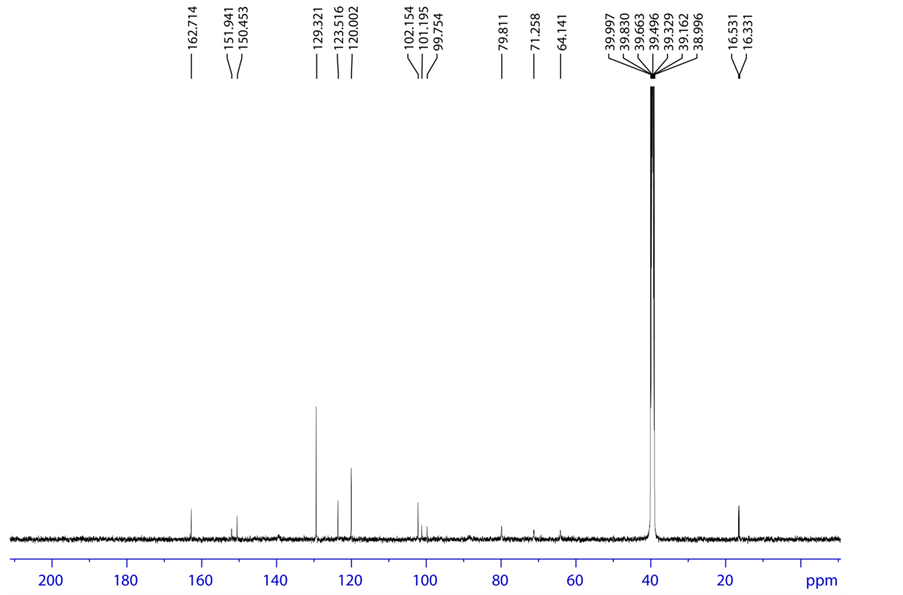
Figure 8. 13C NMR spectrum of acid degradation product.
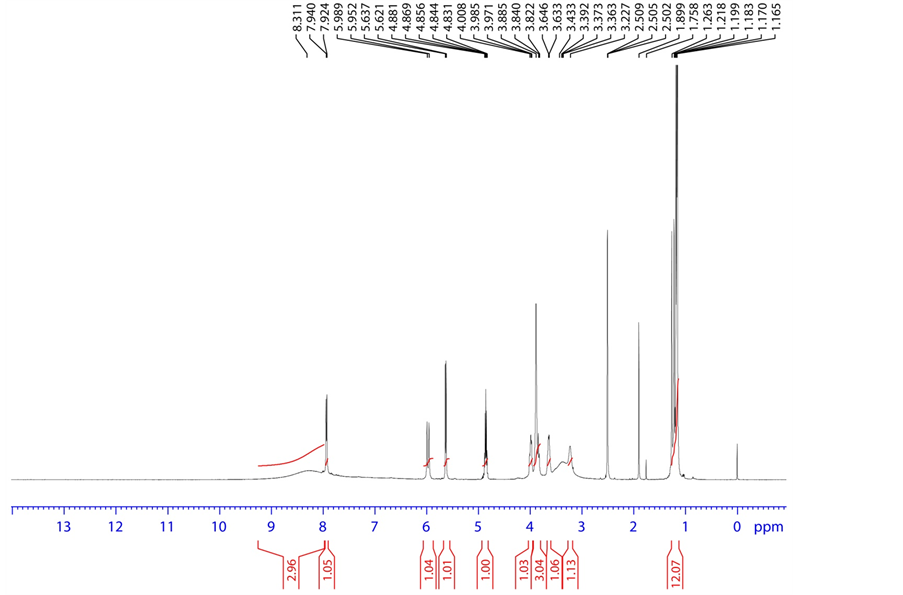
Figure 9. 1H NMR spectrum of base degradation product-A.
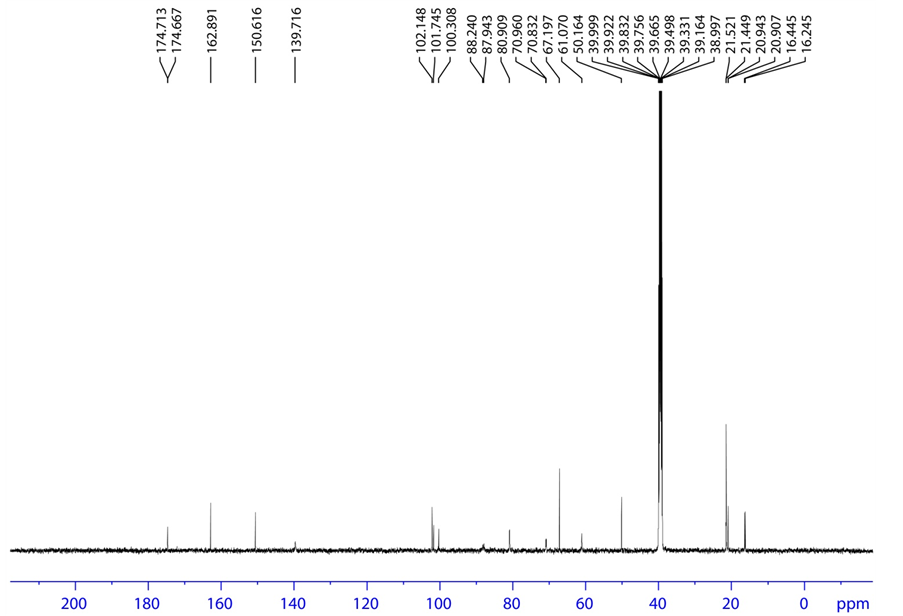
Figure 10. 13C NMR spectrum of base degradation product-A.
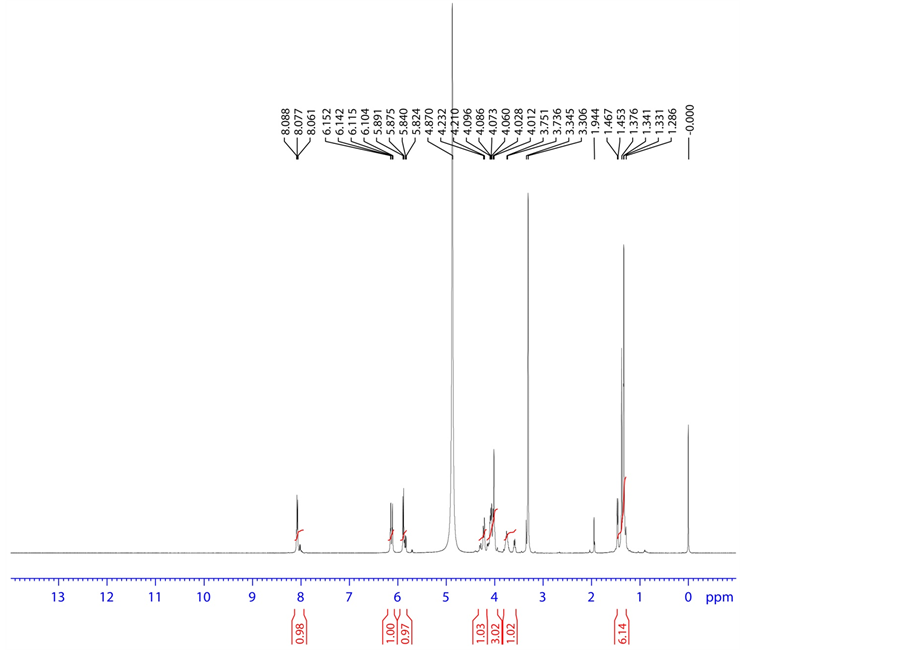
Figure 11. 1H NMR spectrum of base degradation product-B.
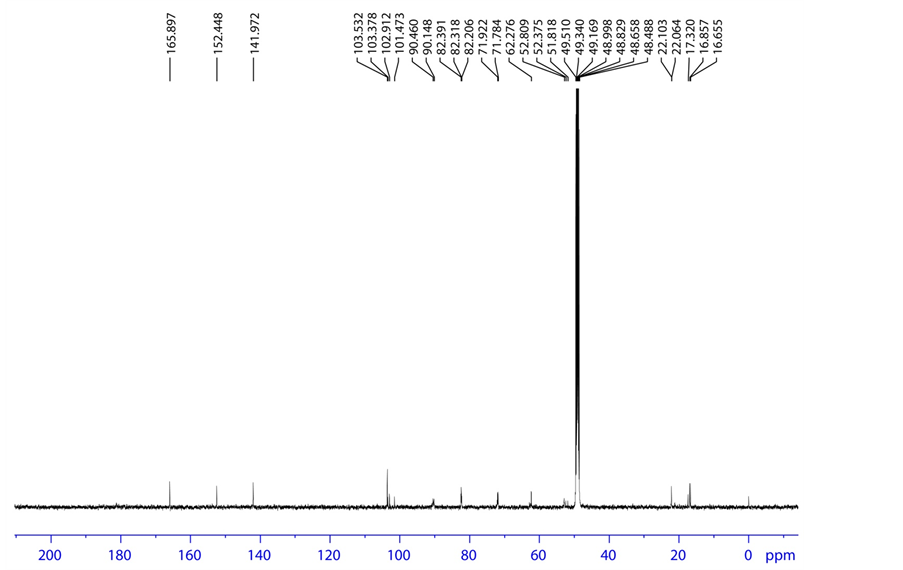
Figure 12. 13C spectrum of base degradation product-B.
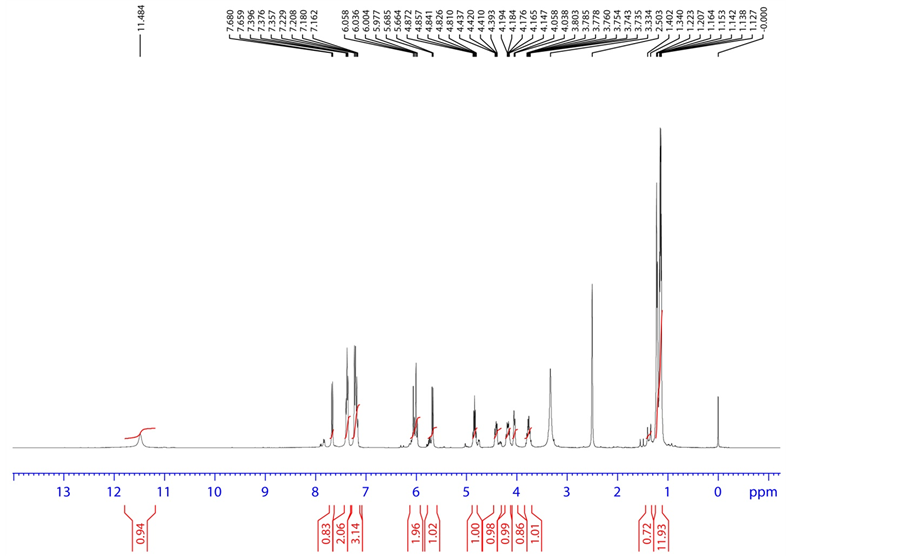
Figure 13. 1H NMR spectrum of oxidative degradation product.
3.4.2. Base Degradation Product-A Characterization
HRMS m/z 454.1369 [M + H]; 1H NMR: δ (DMSO-d6) 7.940 (1 H, d, H-2), 5.637 (1H, d, H-3), 8.311 (1H, Broad, H-6), 5.989 (1H, d, H-9), 3.885 (1H, dd, H-11), 3.840 (1H, ddd/m, H-12), 3.227 (1H, Broad, H-13), 1.263 (3H, d, H-15), 3.985, 4.008 (1H, dd, H-17), 8.311 (1H, Broad, H-21), 8.311 (1H, Broad, H-22), 3.646 (1H, q, H-23), 1.165 (3H, d, H-24), 4.856 (1H, m, H-28), 1.199 (3H, d, H-29), 1.199 (3H, d, H-30); 13C NMR δ (DMSO-d6) 139.716 (C-2), 102.148 (C-3), 162.891 (C-4), 150.616 (C-7), 88.240 (C-9), 80.909 (C-11), 70.960 (C-12), 101.745 (C-14), 16.445 (C-15), 61.070 (C-17), 50.164 (C-23), 20.907 (C-24), 174.713 (C-25), 67.197 (C-28), 21.5 (C-29), 21.5 (C-30); 19F NMR δ (DMSO-d6)-160.465 (F-16); 31P NMR δ (DMSO-d6) 3.671 (P-19); HSQC (7.940-1H, 139.716-13C), (5.637-1H, 102.148-13C), (5.989-1H, 88.240-13C), (3.885-1 H, 80.909-13 C), (3.84-1H, 70.960-13C), (1.263-1H, 16.445-13C), (3.985,4.008-1H, 61.070-13C), (3.646-1H, 50.164-13C), (1.165-1H, 20.907-13C), (4.856-1H, 67.197-13C), (1.199-1H, 21.5-13C), (1.199-1H, 21.5-13C); HMBC (7.940-1H, 102.148, 88.240-13C), (5.637-1H, 139.716, 162.891-13C), (5.989-1H, 150.616, 139.716, 101.745-13C), (3.885-1H, 101.745, 70.960, 61.070-13C), (3.84-1H, 80.909, 61.070-13C), (1.263-1H, 88.240, 101.745, 70.960-13C), (3.985, 4.008-1H, 70.960, 80.909-13C), (3.646-1H, 174.713, 20.907-13C), (1.165-1H, 174.713,50.164-13C), (4.856-1H, 174.713, 21.5-13C), (1.199-1H, 21.5, 67.197-13C), (1.199-1H, 21.5, 67.197-13C); FT-IR (KBr): 3441.16 (Hydroxy, Amine), 2810.41, 2740.0 (Alkyl C-H), 1687.79, 1631.89 (Keto) cm−1.
3.4.3. Base Degradation Product-B Characterization
HRMS m/z 412.0900 [M + H]; 1H NMR: δ (MeOD) 8.088 (1 H, d, H-2), 5.891 (1H, d, H-3), 6.142 (1H, d, H-9), 4.012 (1H, dd, H-11), 4.060 (1H, ddd/m, H-12), 1.341 (3H, d, H- 15), 4.073, 4.232 (1H, dd, H-17), 3.751 (1H, q, H-23), 1.467 (3H, d, H-24); 13C NMR δ (MeOD) 141.972 (C-2), 103.532 (C-3), 165.897 (C-4), 152.448 (C-7), 90.460 (C-9), 82.318 (C-11), 71.922 (C-12), 102.912 (C-14), 16.857 (C-15), 62.276 (C-17), 51.818 (C-23), 22.064 (C-24), 180.5 (C-25); 19F NMR δ (MeOD)-163.599 (F-16); 31P NMR δ (MeOD) 6.614 (31P) (P-19); HSQC (8.088-1H, 141.972-13C), (5.891-1H, 103.532-13C), (6.142-1H, 90.460-13C), (4.012-1H, 82.318-13C), (4.060-1H, 71.922-13C), (1.341-1H, 16.857-13C), (4.073,4.232-1 H, 62.27-13C), (3.751-1H, 51.818-13C), (1.467-1H, 22.064-13C); HMBC (8.088-1H, 152.448,103.532,165.897-13C), (5.891-1H, 165.897,141.972-13C), (6.142-1H, 16.857, 102.912, 71.922, 82.318-13C), (4.012-1H, 90.460, 102.912, 62.276-13C), (4.060-1H, 90.460, 102.912, 62.276-13C), (1.341-1H, 90.460, 71.922, 102.912-13C), (4.073, 4.232-1H, 71.922, 82.318-13C), (3.751-1H, 180.5, 22.064-13C), (1.467-1H, 180.5, 51.818-13C); FT-IR (KBr): 3700.59 3694.81, 3680.34 3662.98, 3408.36 (Hydroxy, Amine), 1689.72 (Keto) cm−1.
3.4.4. Oxidative Degradation Product Characterization
HRMS m/z 528.1525 [M + H]; 1H NMR: δ (DMSO-d6) 7.68 (1 H, d, H-2), 5.68 (1H, d, H-3), 11.484 (1H, s, H-6), 6.03 (1H, d, H-9), 4.01 (1H, dd, H-11), 1.16 (3H, d, H-15), 4.19, 4.43 (1H, dd, H-17), 6.035 (1H, t, H-22), 3.754 (1H, q, H-23), 1.23 (3H, d, H-24), 4.85 (1H, m, H-28), 1.14 (3H, d, H-29), 1.14 (3H, d, H-30) 7.208 (1H, d, H-32), 7.357 (1H, t, H-33), 7.180 (1H, t, H-34), 7.396 (1H, t, H-35), 7.229 (1H, d, H-36); 19F NMR δ (DMSO-d6)-146.983 (F-16); 31P NMR δ (DMSO-d6) 3.895 (P-19). FT-IR (KBr): 3401.61 (Amine), 1710.93 (Keto) cm−1.
3.5. Method Validation
The developed UPLC method is taken up for validation in terms of sensitivity, linearity, specificity, accuracy, and precision in accordance with ICH guidelines [14] .
For system suitability, six replicates of the working standard samples were injected and the parameters like plate number (N), retention time (Rt), and peak asymmetry of samples were calculated and given in Table 2.
Table 2. System suitability results of Sofosbuvir.
Prepared standard and sample solutions were injected into the developed chromatographic conditions and % of assay was calculated and the % of assay was found to be 99.84. The sensitivity of the developed method was determined in terms of the LOD and LOQ. The calculations were based on the standard deviations (SD) of the response and the slope of the calibration plot using the formulae


where, σ = the standard deviation of the response
S = slope of the calibration curve.
The detection and quantification limits of the Sofosbuvir were found to be 0.27 μg∙mL−1, 0.83 μg∙mL−1 respectively. Excellent linearity was observed for drug Sofosbuvir in the concentration range of 5 - 25 μg∙mL−1. The linear regression equation and correlation coefficient (r) were y = 21100x − 8313, 0.999 respectively. Linearity curve of Sofosbuvir was shown in Figure 14.
The precision (intra and inter day) was evaluated using assay method by carrying out six independent assays of Sofosbuvir test sample against standard sample and RSD of six consecutive assays was below 1%. Results showed insignificant variation in measured response, which demonstrated that the method was repeatable with RSD below 1%. The accuracy of method was measured using assay method. Three different concentrations were used and the assay of the drug was calculated. The assay values for 50%, 100% and 150% concentrations were 99.62, 99.73 and 99.65 respectively. The stability of Sofosbuvir was assessed during analysis and storage. No significant changes were observed in the content of Sofosbuvir in mobile phase stability experiments. The standard, sample solutions prepared in clear volumetric flasks were stable up to 30 days in temperature from 2˚C to 8˚C. Robustness as a measure of method capability to remain unaffected by small, but deliberate changes in chromatographic conditions was studied by testing influence of small changes in mobile phase pH (±0.2),organic phase composition (90% to 110%), column temperature (±5˚C) and flow rate (±0.2 mL∙ min−1). The effect of different column, different analyst, and different system was also studied as part of the ruggedness of the method. System suitability parameters were checked and they found to be within the limits. Precision, accuracy and robustness results were shown in Tables 3-5.
The specificity of the method was determined by injecting acid, base, thermal, oxidative and photo degradation solutions of Sofosbuvir. Developed method was able to separate all degradation products from drug compound and the method was found to be
Table 3. Precision results for Sofosbuvir.
Table 4. Accuracy results for Sofosbuvir.
Table 5. Robustness results for Sofosbuvir.
specific so it can be employed as stability indicating method. Degradation results were shown in Table 6.
4. Conclusion
A new RP-UPLC method was developed and validated for the quantification of Sofosbuvir in bulk and tablet dosage form. The developed method is simple, precise and accurate and satisfactory results were obtained through the method validation data. The present method can be easily applicable for routine drug analysis in laboratories and pharmaceutical industry. Forced degradation studies were performed to assess the stability of the compound and prove the stability indicating nature of the developed chromatographic method. All degradation products were isolated. From results obtained from the spectral data acid degradation product was confirmed to have a mass of
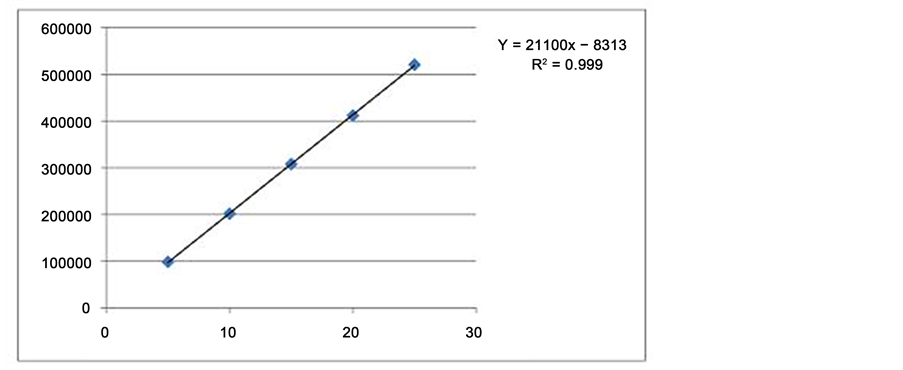
Figure 14. Linearity curve of Sofosbuvir.
Table 6. Degradation and system suitability results of Sofosbuvir.
416.08 with molecular formula of C16H18FN2O8P and have chemical name of (R)-((2R, 3R, 4R, 5R)-5-(2,4-dioxo-3,4-dihydropyrimidin-1(2H)-yl)-4-fluoro-3-hydroxy-4-me- thyltetrahydrofuran-2-yl)methyl phenyl hydrogen phosphate. In base degradation study two impurities were observed and were isolated. Isolated base degradation impurity-A was showing molecular weight of 453.13, molecular formula C16H25FN3O9P and its name as (S)-isopropyl 2-((R)-(((2R, 3R, 4R, 5R)-5-(2,4-dioxo-3,4-dihydropy- rimidin-1(2H)-yl)-4-fluoro-3-hydroxy-4-methyltetrahydrofuran-2-yl)methoxy)(hy- droxy)phosphorylamino) propanoate. Isolated base degradation impurity-B was showing molecular weight of 411.08, molecular formula C13H19FN3O9P and its name as (S)-2-((R)-(((2R, 3R, 4R, 5R)-5-(2,4-dioxo-3,4-dihydropyrimidin-1 (2H)-yl)-4-fluoro- 3-hydroxy-4-methyltetrahydrofuran-2-yl)methoxy)(hydroxy)phosphorylamino) propanoic acid. From the spectral data observed oxidative degradation product was showing molecular weight of 527.15, molecular formula C22H27FN3O9P and its name as (S)-isopropyl 2-((S)-(((2R, 4S, 5R)-5-(2,4-dioxo-3,4-dihydropyrimidin-1(2H)-yl)-4- fluoro-4-methyl-3-oxotetrahydrofuran-2-yl)methoxy)(phenoxy)phosphorylamino)
propanoate. The method was validated as per ICH guidelines and separating all degradation products from drug. Hence, the method proved suitable for stability testing and quality control of the drug Sofosbuvir in bulk and formulation industries.
Cite this paper
Pottabathini, V., Gugulothu, V., Kaliyaperumal, M. and Battu, S. (2016) Identification, Isolation and Structure Confirmation of Forced Degradation Products of Sofosbuvir. American Journal of Analytical Chemistry, 7, 797-815. http://dx.doi.org/10.4236/ajac.2016.711071
References
- 1. www.drugbank.ca/drugs/DB008934
- 2. Keating, G.M. and Vaidya, A. (2014) Sofosbuvir: First Global Approval. Drugs, 74, 273-282.
http://dx.doi.org/10.1007/s40265-014-0179-7 - 3. Sofosbuvir Full Prescribing Information (2014). www.Gilead.com
- 4. Herbst Jr, D.A. and Reddy, K.R. (2013) Sofosbuvir, A Nucleotide Polymerase Inhibitor, for the Treatment of Chronic Hepatitis C Virus Infection. Expert Opinion on Investigational Drugs, 22, 527-536.
http://dx.doi.org/10.1517/13543784.2013.775246 - 5. Spina, A., Eramova, I. and Lazarus, J.V. (2014) Policy Responses to Viral Hepatitis B and C among People Who Inject Drugs in Member States of the WHO European Region: A Sub-Analysis of the WHO 2013 Global Hepatitis Policy Survey. BMC Infectious Diseases, 14, 1.
http://dx.doi.org/10.1186/1471-2334-14-S6-S15 - 6. Lawitz, E., Mangia, A., Wyles, D., Rodriguez-Torres, M., Hassanein, T., Gordon, S.C., Schultz, M., Davis, M.N., Kayali, Z., Reddy, K.R. and Jacobson, I.M. (2013) Sofosbuvir for Previously Untreated Chronic Hepatitis C Infection. New England Journal of Medicine, 368, 1878-1887.
http://dx.doi.org/10.1056/NEJMoa1214853 - 7. Spradling, P.R., Rupp, L., Moorman, A.C., Lu, M., Teshale, E.H., Gordon, S.C., Nakasato, C., Boscarino, J.A., Henkle, E.M., Nerenz, D.R. and Denniston, M.M. (2012) Hepatitis B and C Virus Infection among 1.2 Million Persons with Access to Care: Factors Associated with Testing and Infection Prevalence. Clinical Infectious Diseases, 55, 1047-1055.
http://dx.doi.org/10.1093/cid/cis616 - 8. Chae, H.B., Park, S.M. and Youn, S.J. (2013) Direct-Acting Antivirals for the Treatment of Chronic Hepatitis C: Open Issues and Future Perspectives. The Scientific World Journal, 2013, Article ID: 704912.
http://dx.doi.org/10.1155/2013/704912 - 9. Rezk, M.R., Basalious, E.B. and Karim, I.A. (2015) Development of a Sensitive UPLC-ESI- MS/MS Method for Quantification of Sofosbuvir and Its Metabolite, GS-331007, in Human Plasma: Application to a Bioequivalence Study. Journal of Pharmaceutical and Biomedical Analysis, 114, 97-104.
http://dx.doi.org/10.1016/j.jpba.2015.05.006 - 10. Pan, C., Chen, Y., Chen, W., Zhou, G., Jin, L., Zheng, Y., Lin, W. and Pan, Z. (2016) Simultaneous Determination of Ledipasvir, Sofosbuvir and Its Metabolite in Rat Plasma by UPLC-MS/MS and Its Application to a Pharmacokinetic Study. Journal of Chromatography B, 1008, 255-259.
http://dx.doi.org/10.1016/j.jchromb.2015.11.056 - 11. Shi, X., Zhu, D., Lou, J., Zhu, B., Hu, A.R. and Gan, D. (2015) Evaluation of a Rapid Method for the Simultaneous Quantification of Ribavirin, Sofosbuvir and Its Metabolite in Rat Plasma by UPLC-MS/MS. Journal of Chromatography B, 1002, 353-357.
http://dx.doi.org/10.1016/j.jchromb.2015.08.038 - 12. ICH (2003) Stability Testing of New Drug Substances and Products Q1A (R2). International Conference on Harmonization, IFMPA, Geneva.
- 13. TPD (1997) Stability Testing of Existing Drug Substances and Products Directorate Ottawa.
- 14. ICH (2005) Q2 (R1); Validation of Analytical Procedures: Text and Methodology.