American Journal of Analytical Chemistry
Vol.06 No.04(2015), Article ID:54589,7 pages
10.4236/ajac.2015.64029
Analysis of ATR-FTIR Absorption-Reflection Data from 13 Polymeric Fabric Materials Using Chemometrics
Innocent Pumure1*, Shannon Ford1, Jessica Shannon1, Christopher Kohen1, Amanda Mulcahy1, Kelvin Frank1, Sheri Sisco1, Nhamo Chaukura2
1College of Heath, Science and Technology, School of Environmental, Physical and Applied Sciences, University of Central Missouri, Warrensburg, MO, USA
2Department of Polymer Science & Engineering, Harare Institute of Technology, Belvedere, Harare, Zimbabwe
Email: *pumure@ucmo.edu
Copyright © 2015 by authors and Scientific Research Publishing Inc.
This work is licensed under the Creative Commons Attribution International License (CC BY).
http://creativecommons.org/licenses/by/4.0/


Received 30 January 2015; accepted 10 March 2015; published 12 March 2015
ABSTRACT
We used both correlation and covariance-principal component analysis (PCA) to classify the same absorption-reflectance data collected from 13 different polymeric fabric materials that was obtained using Attenuated Total Reflectance-Fourier Transform Infrared spectroscopy (ATR-FTIR). The application of the two techniques, though similar, yielded results that represent different chemical properties of the polymeric substances. On one hand, correlation-PCA enabled the classification of the fabric materials according to the organic functional groups of their repeating monomer units. On the other hand, covariance-PCA was used to classify the fabric materials primarily according to their origins; natural (animal or plant) or synthetic. Hence besides major chemical functional groups of the repeat units, it appears covariance-PCA is also sensitive to other characteristic chemical (inorganic and/or organic) or biochemical material inclusions that are found in different samples. We therefore recommend the application of both covariance-PCA and correlation-PCA on datasets, whenever applicable, to enable a broader classification of spectroscopic information through data mining and exploration.
Keywords:
Data Mining, Principal Component Analysis, ATR-FTIR, Polymeric Materials, Chemometrics

1. Introduction
An isolated non-linear molecule containing N atoms can undergo 3N-6 normal vibrational modes each often consisting of complex mixture of bond stretches and other deformations. In a polymeric substance, vibrational modes of a polymer depend on the chemical nature of the repeating monomer units. The resulting frequencies and intensities of the vibrational modes are sensitive to chemical structure and therefore provide essential information that can be used to characterize chemical substances [1] . ATR-FTIR is a technique that can be used to collect absorption-reflection data that is resonant with allowed vibrational transitions of a variety of chemical functional groups. Analysis of the collected data can be done using univariate or selective group frequency assignments or by means of multivariate statistical methods of analysis such as Principal component analysis (PCA). Martin et al. [2] used FTIR and covariance-PCA to classify vegetable oils. Kraft et al. [3] used first derivatives of normalized spectra to classify different polymers using spectral imaging in an online process. Brereton et al. [4] applied dynamic mechanical analysis of polymer properties as temperature is changed. The method involved chemometric analysis of the damping factor (tan δ) as a function of temperature. It was demonstrated that thermal analysis together with chemometrics provides excellent discrimination, representing an approach for characterization of polymers [4] -[6] .
PCA is an unsupervised non-parametric multivariate statistical technique that is frequently used in data mining to unveil or confirm relationships and similarities between samples and measured parameters. PCA is used to reduce data dimensionality [7] -[11] by identifying similar patterns between samples and introducing new latent variables which are linear combinations of the measured variables. This allows for pattern recognition and streamlining of large data sets to smaller datasets while still retaining the original chemical meaning of the data. Correlation PCA begins with normalization followed by standardization of data to give appropriate weighting. On the other hand covariance PCA involves standardization of data matrix excluding the normalization step. Standardization is the transformation of measured data to give a mean of zero and a standard deviation of 1. Hence standardization transforms all data into z scores. Prior to normalization and standardization the raw data can be pre-processed by performing preliminary transformations that include taking logarithms, inverses, squares or square roots of the raw data. Z scores will then be obtained from the standardization of the transformed but related data. A plot of the z scores between any two data sets will lead to existing or new linear relationships/combinations or clustering of data points of samples with similar attributes. The new linear combinations are known as principal components (PCs). The generated PCs are usually orthonormal to each other. Placing a meaning on the derived PCs or clusters requires a thorough knowledge of the chemistry and the physical properties of the samples analyzed. There may be prior or apriori knowledge about the clustering or data classification before the application of PCA.
Ideally, combined variance from all PCs used should explain at least 80% of the total variance observed. However in most situations the first two PCs that explain the largest total variance are frequently used to interpret data. A plot of the PCs over the sample space is called a Score plot which shows physicochemical connectivities between the samples. A plot of PCs over the variable space is called a Loading plot that yields connectivities among the variables. Superimposition of a score plot onto a Loading plot is known as a biplot which often provide direct details on the relationships between samples and variables. In this study, we show the difference in the physicochemical information that is obtainable by applying both correlation and covariance PCA to the same set of data obtained using ATR-FTIR spectroscopy for 13 different polymeric fabric materials.
2. Materials
2.1. Fabric Materials
Fabric materials were obtained from Test Fabrics Inc. and were analyzed without any pretreatment. No sample pretreatment was considered necessary to be done before analysis. A swatch of the polymeric materials is shown in Figure 1. It appears, the polymeric binder material that runs perpendicular to the fibers of interest did not affect classification using PCA. Inspection of the ATR-FTIR spectra showed the expected peaks that are attributable to the major functional groups in the repeating monomer units of the polymers. This shows the robustness of the analytical method and PCA methods used.
2.2. Nicolet ATR-FTIR Instrument
The instrument was set to record absorption-reflection data for the fabric samples from 525 to 4000 cm−1 spec-

Figure 1. A strip containing all 13 different fabric materials as obtained from Test Fabrics Inc. The chemical formula of the repeating units of the polymers are shown in Table 1.
tral region. Instrument parameters include the following; number of averaged scans 32, resolution 2, data spacing 0.964 cm−1 and Happ-Genzel signal apodization. A background scan was always recorded before performing any analysis. When a sample is analyzed, the Nicolet ATR-FTIR instrument used records a ratio between analytical signals and background signals at each wavenumber to counter variations in source intensity. A thin film of polystyrene was used for quality control (QC) and quality assurance (QA) purposes. QC data was collected and analyzed before samples were analyzed. An average score of 98.17% ± 1.32% of the polystyrene QC standard obtained against an internal reference Styrofoam standard was considered to be satisfactory. The 1.32 value corresponds to 3 standard deviations of the average score. The instrument was considered ready for use only after quality control conditions were met.
2.3. Analytical Procedure
Each set of fibers from a single type of a fabric material is held together by fibrils of a binder material that weave in a perpendicular direction. After the quality assurance step, ATR-FTIR spectra were recorded on each sample of the fabric material in the presence of the binder. The spectra for each individual fabric materials were run for a total five times, each spectra being recorded on a different spot. Absorption-reflection data from five runs on each fabric material were averaged and plotted in Figure 2. The ATR-FTIR data were then exported into Minitab 15.0 software for PCA analysis. Both covariance and correlation PCA techniques were then applied to the absorption-reflection data. Results from PCA are plotted in Figure 3(a) (correlation PCA), Figure 3(b) (single linkage-correlation coefficient dendrogram) and Figure 4 (covariance PCA) respectively.
3. Results
In Figure 2, the data appears clouded, unclear and the underlying relationships between the 13 different polymeric fabrics cannot be easily identified just by analyzing the ATR-FTIR data simultaneously. Even though one can use selective organic functional group frequencies to identify the nature of the individual fabric materials, it appears challenging to succinctly classify the different fabric materials. However, the data can be collectively analyzed using PCA, a multivariate statistical technique.
Interpretation of PCA data requires a thorough understanding of the chemical properties of the analyzed samples. For a regular polymer chain, vibrations occurring in the repeating monomer units result in infrared absorption-reflection bands that can be used to characterize the polymer materials. The repeating monomer units and their corresponding functional groups in the 13 polymer materials are presented in Table 1.
3.1. Correlation-PCA
Analysis of the data matrix using correlation PCA resulted in the classification of polymers materials according to their major chemical functional groups. Similar classification was also found using the single linkage-corre- lation coefficient dendrogram. This information is shown in Figure 3(a) and Figure 3(b). Classification using
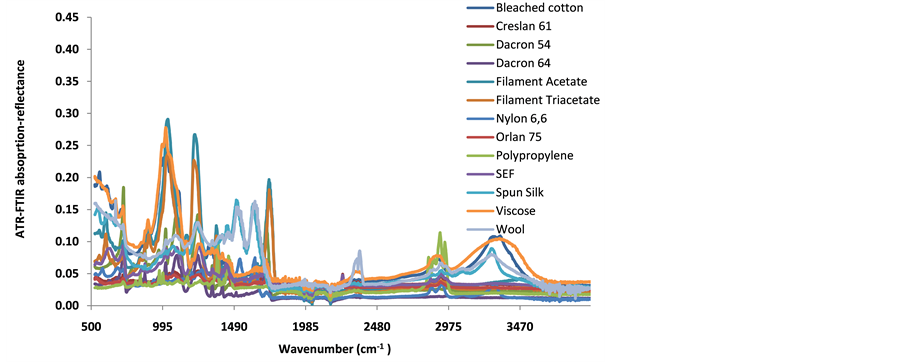
Figure 2. ATR-FTIR data for 13 different fabric materials.
 (a)
(a)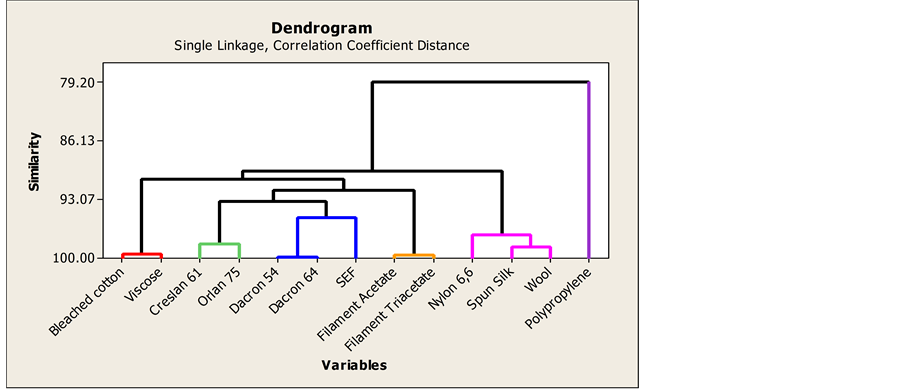 (b)
(b)
Figure 3. (a) Data from correlation PCA; (b) single linkage-correlation coefficient dendrogram.

Table 1. Repeating monomer units in the polymers.
correlation PCA is so powerful that polymers having identical or similar major chemical functional groups in their repeating monomer units are clustered together even though they might have different chemical origins. Although correlation does not necessarily mean causation [5] , the clustering of the fabric materials on the PCA plot can be related to chemical properties of the fabric materials. All characteristic group frequencies for organic functional groups were obtained from Principles of Instrumental Analysis, 7th edition by Skoog, Holler and Crouch [12] .
Spun silk, Wool and Nylon 6,6 are condensation polyamide polymers. They all have the polyamide backbone in spite of having different three dimensional structural properties. The amide group is characterized by absorption reflection intensities for C-N at 1223, 1229 and 1243 cm−1 and for N-H at 3268, 3251 and 3289 cm−1 and C=O at 1620, 1633 and 1629 cm−1 for Spun silk, Wool and Nylon respectively. Spun Silk and wool are derived from animal protein, a natural origin, but Nylon 6,6 is a synthetic polyamide. Correlation PCA grouped these three polymers together most likely because they share a common amide functional group in their repeating monomer units.
Dacron is essentially a poly (ethylene terephthalate) polyester [13] . The two varieties of Dacron polymers, Dacron 54 and Dacron 64, are both synthetic polyesters. The two share an ester functional group and that could be the primary reason why they were grouped together using correlation PCA. The characteristic vibrational stretch frequencies associated with ester functional group are 1083 cm−1 (Dacron 54) and 1085 cm−1 (Dacron 64) for the C-O-C ether linkage and with 1713 cm−1 (Dacron 54) and 1709 cm−1 (Dacron 64) for the carbonyl group.
Orlan 75 and Creslan 61 represent different versions of polyacrylonitrile copolymers. They are made from the polymerization of acrylonitriles. The characteristic vibrational modes of the nitrile functional groups in the two polymers were found at 2237 cm−1 in Orlan 75 and 2241 cm−1 in Creslan 61. Poly acrylics usually contain at least 85% of polyacrylonitrile as acrylic fibers. The two were clustered together using correlation PCA most likely because they are primarily made from polyacrylonitrile monomer.
SEF (Self Extinguishing Fiber) is a polyacrylonitrile copolymer that is mixed with other polymers. SEF did not group well together with other acrylics (Orlan 75 and Creslan 61) probably because of differences in composition and the chemical nature of additional copolymers used. SEF belongs to a class of polymers that are called modacrylics. Modacrylics typically contain 35% - 85% polyacrylonitriles as acrylic fibers and the remainder is added to deliberately fine tune the overall polymer properties. However, the positioning of SEF on the sample score plot (Figure 3(a)) and on the correlation dendrogram (Figure 3(b)), is not very far away from the two other acrylics and from Dacron 54 and Dacron 64. However, Figure 3(b) shows that there is a strong similarity in composition between SEF and the polyesters. In addition to a nitrile peak at 2239 cm−1 in SEF ATR-FTIR spectrum, there is a presence of relatively strong peaks at 1082 cm−1 and 1711 cm−1 that correspond to ether linkage and carbonyl group vibrational frequencies which provides evidence for the presence of a polyester.
Viscose and bleached cotton are both cellulosic because they are derived from plant material, a natural origin. Bleached cotton is made from cotton that has been reacted with chemicals which include oxidizing agents such as hydrogen peroxide or hypochlorite to remove color. Rayon is produced by the chemical treatment of cellulosic material using NaOH and CS2 [14] . Both Bleached cotton and viscose essentially exhibit the same chemical properties. Similarity in chemical composition could be the reason why the two were grouped together using correlation PCA. Vibrational frequencies for hydroxyl groups were found at 3299 cm−1 in viscose and 3258 cm−1 in wool.
Both filament acetate and filament triacetate are made from the esterification of hydroxyl groups on cellulose using reagents such as acetic anhydride [15] . Acetylation of one hydroxyl group results in the formation of filament acetate and acetylation of all available three hydroxyl groups yields filament triacetate. Although they are derived from cellulose, they now have additional acetyl groups that are added onto the cellulosic polymeric chain. The two polymers are examples of modified natural polymers. The chemical composition of both Filament acetate and Filament Triacetate is now different from cotton and viscose due to acetylation. The characteristic peaks at 1727 cm−1 (Filament acetate) and 1731 cm−1 (Filament triacetate) indicate a strong presence of the carbonyl functional groups added through acetylation. There is also an apparent characteristic decrease in the relative intensities of OH (around 3300 cm−1) functional group due to acetylation.
Polypropylene is an addition polyolefinic polymer that is made up of a repeating unit containing saturated hydrocarbons. Polypropylene is the only polyolefinic polymer used in the study and that is why it is well separated from the other polymers as shown in Figure 3(a) and Figure 3(b). Polypropylene is also a synthetic polymer. The C-H in the repeating units have characteristic ATR-FTIR bands at 2915, 1376 and 1450 cm−1.
3.2. Covariance PCA
Covariance PCA on the other hand was used to provide additional information regarding other properties of the fabric materials not explained using correlation PCA. Covariance PCA is normally applicable to data measurements performed using a similar scale, more specifically if only one instrument is used. Covariance PCA enabled the classification of polymeric fabric materials primarily by origin and partially by functional groups. This information is shown in Figure 4. Natural impurities, residual synthetic chemicals, and additives [16] present in the fabric materials could have played a critical role in enabling the covariance PCA to classify the fabric materials according to their chemical origins. It appears natural inclusions from animal origins enabled the spun silk and wool to be grouped together. Both spun silk and wool are polyamides that have a natural animal origin. However, even though Nylon 6,6 is a polyamide that is chemically similar to wool and silk (Figure 3(a) and Figure 3(b)), it was grouped together with the other purely synthetic polymers by covariance PCA. It was really interesting to note that Nylon 6,6, a synthetic polymer, grouped with other synthetic polymers and not with other polyamides of animal origin after the application of covariance PCA.
Bleached cotton and Viscose both originate from cellulose. Results from covariance PCA and Correlation PCA are similar for the two primarily because their origin and chemical properties are essentially the same [17] . Filament acetate and Filament triacetate originate from plant materials but they have additional acetylated groups that make them different from bleached cotton and viscose.
Nylon 6,6, polypropylene, SEF, Orlan 75, Creslan 61, Dacron 64 and Dacron 54 are all synthetic polymers. Their extended group (Figure 4) is conspicuously far away from those with natural origins. Hence correlation PCA enabled the synthetic polymers to be grouped most likely because of the synthetic residual chemical inclu-

Figure 4. Data from covariance PC.
sions and other additives [18] . The closeness of SEF to Dacron 54 and Dacron 64 in both correlation and covariance PCA data provides information that the polyacrylamide in SEF could have been blended with a polyester material.
4. Conclusion
Application of both correlation PCA and covariance PCA to chemical data allows for a better interpretation of chemical and biological data hidden in a maze of ATR-FTIR data. Correlation PCA offered a way of classifying the polymers according to their chemical properties whereas covariance PCA was better at classifying the polymers according to their chemical or biological origins. Covariance PCA was able to separate Nylon 6,6 from Spun Silk and Wool because Nylon 6,6 is a synthetic polymer whereas Spun Silk and Wool are derived from animals. However, correlation-PCA was able to group all three together because they share a common polyamide backbone. The robustness of both PCA methods is also highlighted because the analyses of all the fabric materials were performed in the presence of a binder, but the binder material did not affect the chemometric classification process. Cserhati and Zoltan [19] suggested that the application of correlation matrix as a basis for the PCA may lead to slightly distorted results that strongly advocates for the use of covariance matrix in PCA. In this study we showed that the two techniques, correlation-PCA and covariance PCA complement each other and therefore are equally important. It is therefore highly encouraged that both PCA methods be applied in data analysis whenever they are both applicable to allow for a holistic approach towards data classification and interpretation.
Acknowledgements
The authors wish to thank the University of Central Missouri for providing financial support and the Test Fabrics Inc. for providing the fabric material samples.
References
- Hunt, B.J. and James, M.I. (1993) Polymer Characterization. Blackie Academic and Professionals, New York and London.
- Rusak, D.A., Brown, L.M. and Martin, S.D. (2003) Classification of Vegetable Oils by Principal Component Analysis of FTIR Spectra. Journal of Chemical Education, 80, 541. http://dx.doi.org/10.1021/ed080p541
- Kulcke, A., Gurschler, C., Spöck, G., Leitner, R. and Kraft, M. (2003) On-Line Classification of Synthetic Polymers Using Near Infrared Spectral Imaging. Journal of Near Infrared Spectroscopy, 11, 71-81. http://dx.doi.org/10.1255/jnirs.355
- Lukasiak, M.B., Faria, R., Zomer, S., Brereton, R.G. and Duncan, J.C. (2006) Pattern Recognition for the Analysis of Polymeric Materials. Analyst, 131, 73-80. http://dx.doi.org/10.1039/B510561G
- Lloyd, G.R., Brereton R.G., Faria, R. and Duncan, J.C. (2007) Learning Vector Quantization for Multiclass Classification: Application to Characterization of Plastics. Journal of Chemical Information and Modeling, 47, 1553-1563. http://dx.doi.org/10.1021/ci700019q
- Fari, R., Duncan, J.C. and Brereton R.G. (2007) Dynamic Mechanical Analysis and Chemometrics for Polymer Identification. Polymer Testing, 26,402-412. http://dx.doi.org/10.1016/j.polymertesting.2006.12.012
- Lavine, B.K. and Workman, J. (2013) Chemometrics. Analytical Chemistry, 85, 705. http://dx.doi.org/10.1021/ac303193j
- Eriksson, L., Trygg, J. and Wold, S. (2014) A Chemometrics Toolbox Based on Projectionsand Latent Variables. Journal of Chemometrics, 28, 332-346. http://dx.doi.org/10.1002/cem.2581
- Pienta, N.J. (2013) Taking a Cue from Statistics Education. Journal of Chemical Education, 90, 525. http://dx.doi.org/10.1021/ed400242f
- Sandasi, M., Kamatou, G.P.P., Gavaghan, C., Barasnka, M. and Viljoen, A.M. (2011) A Quality Control Method for Geranium Oil Based on Vibrational Spectroscopy and chemometric Data Analysis. Vibrational Spectroscopy, 57, 242- 247. http://dx.doi.org/10.1016/j.vibspec.2011.08.002
- Pumure, I., Renton, J.J. and Smart, R.B. (2011) The Interstitial Location of Selenium and Arsenic in Rocks Associated with Coal Mining Using Ultrasound Extractions and Principal Component Analysis (PCA). Journal of Hazardous Materials, 198, 151-158. http://dx.doi.org/10.1016/j.jhazmat.2011.10.032
- Skoog, D.A., Holler, F.J. and Crouch, R.S. (2007) Principles of Instrumental Analysis. 6th Edition, Chapter 17, Thompson Brookes/Cole, California, 461-463.
- Kannan, R.Y., Salacinski, H.J., De Groot, J., Clatworthy, I., Bozec, L., Horton, M., Butler, P.E. and Seifalian, A.M. (2005) The Antithrombogenic Potential of a Polyhedral Oligomeric Silsesquioxane (POSS) Nanocomposite. Biomacromolecules, 7, 215-223. http://dx.doi.org/10.1021/bm050590z
- Jha, M.K., Kumar, V., Maharaj, L. and Singh, R.J. (2004) Studies on Leaching and Recycling of Zinc from Rayon Waste Sludge. Industrial & Engineering Chemistry Research, 43, 1284-1295. http://dx.doi.org/10.1021/ie020949p
- Sikorski, P., Wada, M., Heux, L., Shintani, H. and Stokke, B.T. (2004) Crystal Structure of Cellulose Triacetate I. Macromolecules, 37, 4547-4553. http://dx.doi.org/10.1021/ma0498520
- Crompton, T.R. (1993) Practical Polymer Analysis. Plenum Press, New York.
- Letcher, T.M. and Lutseke, N.S. (1990) A Closer Look at Cotton, Rayon, and Polyester Fibers. Journal of Chemical Education, 67, 361. http://dx.doi.org/10.1021/ed067p361
- Menezes, E.A., Carapelli, R., Bianchi, S.R., Souza, S.N.P., Matos, W.O., Pereira-Filho, E.R. and Nogueira, A.R.A. (2010) Evaluation of the Mineral Profile of Textile Materials Using Inductively Coupled Plasma Optical Emission Spectrometry and Chemometrics. Journal of Hazardous Materials, 182, 325-330. http://dx.doi.org/10.1016/j.jhazmat.2010.06.033
- Cserháti, T. and Illés, Z. (1991) Comparison of Two Principal Component Analysis Methods to Evaluate Reversed- Phase Retention Data. Journal of Pharmaceutical and Biomedical Analysis, 9, 685-691. http://dx.doi.org/10.1016/0731-7085(91)80207-P
NOTES

*Corresponding author.