American Journal of Analytical Chemistry
Vol. 3 No. 6 (2012) , Article ID: 20058 , 5 pages DOI:10.4236/ajac.2012.36058
Analytical Methods in Quality Control of Scientific Publications
Department of Biology, University of Oslo, Oslo, Norway
Email: ilia.brondz@bio.uio.no
Received April 8, 2012; revised May 2, 2012; accepted May 12, 2012
Keywords: Analytical Methods in Quality Control; 13C NMR Spectroscopy; Primaquine; Quinocide
ABSTRACT
Plagiarism, fake or even falsified presentation has become a major plague for scientific publications. This paper is a response to personal appeal by David JW Lane the Editor-in-Chief of Research and Reports in Biodiversity Studies to support and promote the international author standards as developed by COPE for authors and editors-in-chief posted to me April 3rd 2012 (International standards for editors and authors http://www.dovepress.com/rrbscope.t9699812). As corresponding author for more than 100 scientific papers, dozens of scientific reviews, several chapters in scientific books, and author and editor of a book Historical Overview of Chromatography and Related Techniques in Analysis of Antimalarial Drug Primaquine, and as a reviewer of Journal of Chromatography, Journal of Chromatography A, Journal of Chromatography B: Biomedical Sciences and Applications, Lipids, Journal of General Microbiology, Journal of Clinical Microbiology, Journal of Microbiological Methods, Oral Microbiology and Immunology, Analytica Chimica Acta, Mycological Research and Journal of Pharmaceutical and Biomedical Analysis, and member of editorial board of Electronic Components and Systems, American Journal of Analytical Chemistry, ISRN Chromatography and Open Journal of Clinical Diagnostics I was adhered to a new ethical and moral standards in scientific publications. The presented paper is an example of use the analytical methods in visualizing of plagiarism and falsification in the published scientific literature. It is obvious that some of scientific publications need careful quality control. Some papers should have been rejected but were not. These papers clearly pollute the field of scientific information. It is not always easy to demonstrate inappropriate presentation even when many supporting facts are available. The facts should be obvious; there should be no hesitation about the quality or value of a paper presented for consideration to be published. Plagiarism is most common and harmful phenomenon in scientific publications. The plagiarism is based on an original discovery or reproduction of the results from the other authors. The analytical methods used in the quality control of the data can disclose plagiarism. An example is the publication under scrutiny “Applications of GC-EI-MS for the Identification of Positional Isomer in Primaquine, an Antimalarial Drug” by Dongre et al. (2005) Journal of Pharmaceutical and Biomedical Analysis 39, No. 1-2, 111-116.
1. Introduction
The endeavor to achieve important and valuable results is characteristic of all of humankind’s professions and enterprises. Political, military, economic, artistic, industrial, and scientific achievements have always been highly honored. In pursuit of this high honor, some men and women have undertaken forgeries and falsifications or plagiarism.
In 2003, on the occasion of the celebration of the centenary of Tswett’s discovery of chromatography, a presentation [1] concerning the quinocide as main contaminant in the antimalarial drug primaquine was given. Later in 2004, publication of the article [2] followed. The contaminant quinocide was characterized using HPLC-MS in several chromatographic systems including chiral chromatography; the authors compared contaminant retention time and the specific mass fragmentation of contaminant quinocide with quality standard quinocide, and described the specific mass fragmentation differences between quinocide and the antimalarial drug primaquine. All data were supported by documentation in the form of chromatograms and mass fragmentation spectra. Because the quality standard of quinocide is not available commercially, but is available only in laboratories with skilled synthetic chemists and the absence of such expertise can prevent correct analytical results being obtained, the need to develop a broad spectrum of instrumental analytical tools to characterize the presence of the toxic contaminant quinocide in the antimalarial drug primaquine without the use of a quinocide sample as a standard was obvious. The GC-MS analysis of this drug [3] was developed in an effort to find comparative differences in the mass fragmentation of substances.
Surprisingly, while the text of manuscript [3] was under consideration for publication in the Asian Journal of Chemistry, the publication by Dongre et al. [4] appeared in the Journal of Pharmaceutical and Biomedical Analysis and, in many respects, it was a copy of [3], including typing mistakes that were present in the original manuscript [3]. Several questions arise as a result of the nearly simultaneous publication of two nearly identical papers. Were the studies performed independently or was one of them copied from the other?
It should be taken into account that quinocide is not commercially available and it has been synthesized in only two places. One of them is the Martsinovsky Institute of Medical Parasitology and Tropical Medicine in Russia (the original place of synthesis, which was then in the former USSR) and the other is the Walter Reed Army Institute of Research in the USA. Scientists from the Martsinovsky Institute of Medical Parasitology and Tropical Medicine were included in publications [1-3] and contributed the quality standard of quinocide. The main suspicion was the claim that Dongre et al. had neither synthesized nor used synthetic quinocide in their study as a standard for comparison with contaminants in the antimalarial drug primaquine. It is questionable whether Dongre et al. ever had in their hands a sample of synthetic quinocide or simply had contact with the then unpublished manuscript [3].
If the idea that Dongre et al. had never been in possession of the synthetic quinocide could be supported, all other accusations presented in [5-7], including the presence of typing mistakes common to both texts, unsustainable reference to the work of Elderfield et al. [8] in publication [4], the absence of a co-chromatogram of the contaminant with authentic standard quinocide in publication [4], and the absence of documented mass spectra of authentic standard quinocide and the contaminant in primaquine said to be quinocide in publication [4], may have been of minor importance. Suspicion regarding copying the [3] by Dongre et al. was presented to the Editor-in-Chief of the Journal of Pharmaceutical and Biomedical Analyses and Mr. Dongre was forced to present documentation to support the claim that he was in possession of a sample of synthetic quinocide. Among the documents (and only a reliable document) released by Mr. Dongre was the 13C NMR spectrum of a substance said to be synthetic quinocide and said to be identical to a contaminant in the antimalarial drug primaquine (Figure 1).
The experimental 13C NMR spectrum of quinocide (Figure 2) and a table of chemical shifts became available in the published literature only after a publication from the R&D laboratory of Jupiter Ltd, Norway, in 2009 [5].
The absence of this 13C NMR spectrum in the open literature until 2009 was a form of insurance for Mr. Dongre (at the time of his answer on Tuesday, 24 June 2008 to the Editor-in-Chief of the Journal of Pharmaceutical and Biomedical Analyses), which made it safe to release the 13C NMR spectrum said to be synthetic quinocide without jeopardizing his reputation because the spectrum was not available at this time in public domain. Editor-inChief of the Journal of Pharmaceutical and Biomedical Analyses, kindly transferred to the author of [3] the 13C NMR spectrum received from Dongre et al. (Figure 1) in support of the claim that Dongre et al. were actually in possession of synthetic quinocide.
A comparison of the experimental 13C NMR spectra of primaquine and quinocide [5] and differences in the spectrum received from Dongre et al. were initially discussed in [6,7]. The conclusion was that Mr. Dongre had not been in possession of the synthetic quinocide sample but had manipulated the sample of primaquine. By using analytical methods in a quality-controlled study, it was possible to show that the 13C NMR spectrum presented
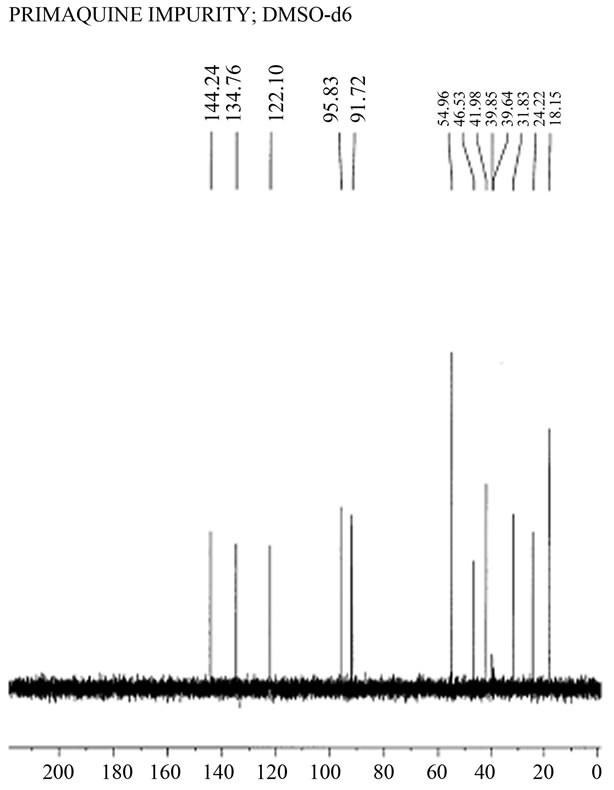
Figure 1. 13C NMR spectrum of a compound claimed to be a synthetic “primaquine impurity” and said by Mr. Dongre to be synthetic quinocide. The spectrum was received from Mr. Dongre following a request from the Editor-in-Chief of Journal of Pharmaceutical and Biomedical Analysis. (Courtesy Jupiter AS, Ski, Norway and Nova Science Publishers, Inc. USA).
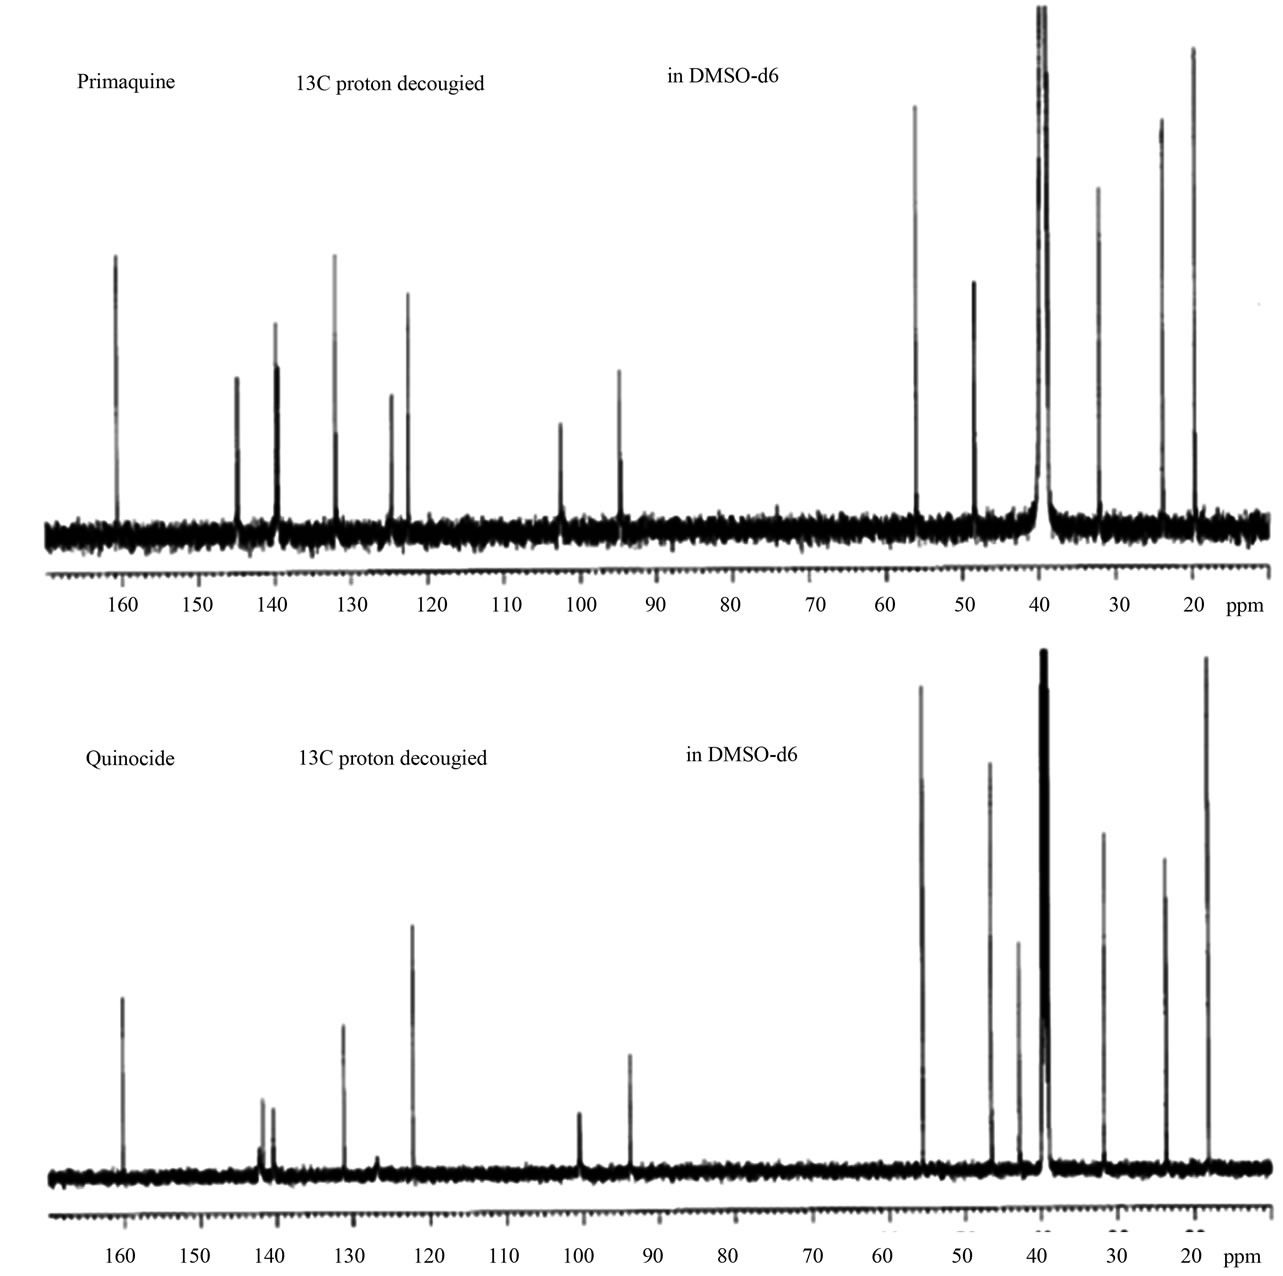
Figure 2. Experimental 13C NMR spectra of primaquine and quinocide published in [5-7]. The upper trace is the 13C NMR spectrum of primaquine. The lower trace is the 13C NMR spectrum of quinocide. (Courtesy Jupiter AS, Ski, Norway and Nova Science Publishers, Inc. USA).
by Mr. Dongre was unrelated to the spectra of primaquine or quinocide.
These arguments were based entirely on facts presented in experimental 13C NMR spectra published by Jupiter Ltd, Norway, [5-7].
The 13C NMR theoretical calculated chemical shifts of primaquine and quinocide are in agreement with those published in [5-7] but deviate significantly from the chemical shifts in the spectrum of the substance presented in Figure 1 by Dongre et al.
2. Discussion
The experimental 13C NMR spectra of quinocide and primaquine recorded by the R&D laboratory of Jupiter Ltd, Norway, are shown in Figure 2. The spectra and chemical shift tables are published in [5]. The theoreticcally calculated chemical shifts of 13C NMR spectra for primaquine and quinocide are shown in Figures 3(a) and (b). Differences in chemical shifts between experimental 13C NMR spectra of quinocide and primaquine are discussed in [5-7]. The main differences in chemical shifts
 (a)
(a)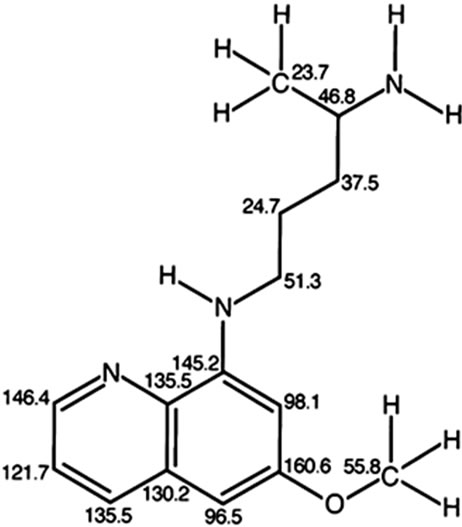 (b)
(b)
Figure 3. (a) Theoretical calculated 13C NMR chemical shifts in the primaquine molecule shown in the vicinity of every carbon atom. The chemical shifts are theoretically calculated for 13C NMR by using ChemBioDraw Ultra 12.0 Suite. http://scistore.cambridgesoft.com. (b) Theoretical calculated 13C NMR chemical shifts in the quinocide molecule shown in the vicinity of every carbon atom. The chemical shifts are theoretically calculated for 13C NMR by using ChemBioDraw Ultra 12.0 Suite. http://scistore.cam bridgesoft.com.
can be summarized as follows: the chemical shifts around 144 and 95 ppm are characteristic of the spectrum of primaquine, whereas chemical shifts around 142, 140, and 100 ppm are characteristic of the spectrum of quinocide. This is demonstrated in the spectra shown in Figure 2.
The absence of signals around 142, 140, and 100 ppm in the 13C NMR spectrum shown in Figure 1 represents evidence that the sample did not contain a significant amount of quinocide. However, the crucial evidence is presented in Figure 2, Figure 3(a) and (b). Both primaquine and quinocide must exhibit a characteristic chemical shift near 160 ppm. The theoretical calculations reveal that the chemical shift near 160 ppm is a signal for aromatic carbon with a methoxy functional group attached. The methoxy group is present in both primaquine and quinocide molecules, and this group is necessary for the antimalarial activity of the drugs. Substances missing the methoxy group are neither primaquine nor quinocide. The structures of primaquine and quinocide are shown in Figures 3(a) and (b), together with calculated characteristic chemical shifts in the vicinity of every carbon atom.
In Figure 2, the chemical shift near 160 ppm is clearly shown in the experimental spectra of primaquine and quinocide. In the spectrum provided by Mr. Dongre (Figure 1) this chemical shift near 160 ppm is totally absent. The substance in Figure 1 that exhibited this spectrum is neither primaquine nor quinocide. This is the best evidence (in addition to evidence presented earlier in [5-7]) that Mr. Dongre had knowledge of manuscript [3] before its publication and copied results from [3], along with our typing mistakes, as described in [6,7]. Dongre et al. never had synthetic quinocide in their possession at the time the text of [4] was composed. Publication [4] was rewritten from the manuscript [3] without performing the necessary analytical study, as is obvious from the evidence presented in the 13C NMR spectra facts in Figures 1, 2, and calculations on Figures 3(a) and (b), and the criticism expressed in [5-7]. The 160 ppm chemical shift in 13C NMR of primaquine is also demonstrated in [9,10] in good agreement with [5] and contradicts [4].
3. Conclusion
We have shown results in Figures 3(a) and (b) and results obtained experimentally in Figure 2 for the 13C NMR spectra and chemical shifts published in [5] of primaquine and quinocide. The primaquine and quinocide molecules each display in their 13C NMR spectra a chemical shift at 160 ppm. These data are also supported theoretically and by independent literature reports [9,10] in which 13C NMR chemical shifts for primaquine are shown around at 160 ppm but molecules without a methoxy functional group attached to the aromatic carbon in the ring have no such chemical shifts. In the spectrum of Dongre et al. (Figure 1), this chemical shift at 160 ppm is missing. This is the best evidence that Dongre et al. did not possess a sample of synthetic quinocide and copied work from a manuscript written by other scientists.
4. Acknowledgements
The present study was supported in part by Jupiter Ltd., Norway. The author is grateful to Jupiter Ltd, Norway and Nova Science Publishers, Inc. USA for permission to reproduce Figures 1 and 2 from archive of Jupiter Ltd., Norway and from publications [5-7].
REFERENCES
- I. Brondz, D. Mantzeilas, U. Klein, M. N. Lebedeva, F. S. Mikhailitsyn, G. D. Souleimanov and D. Ekeberg, “The Main Contaminant of the Antimalarial Drug Primaquine Is Its Positional Isomer,” 3rd International Symposium on Separation in BioSciences SBS 2003 A 100 Years of Chromatography, Abstract P-57, 13-18 May 2003, Moscow, Russia, p. 165.
- I. Brondz, D. Mantzilas, U. Klein, D. Ekeberg, E. Hvattum, M. N. Lebedeva, F. S. Mikhailitsyn, G. D. Souleimanov and J. Røe, “Nature of the Main Contaminant in the Antimalarial Drug Primaquine Diphosphate: A Qualitative Isomer Analysis,” Journal of Chromatography B, Vol. 800, No. 1-2, 2004, pp. 211-223. doi:10.1016/j.jchromb.2003.09.042
- I. Brondz, U. Klein, D. Ekeberg, D. Mantzilas, E. Hvattum, H. Schultz and F. S. Mikhailitsyn, “Nature of the Main Contaminant in the Drug Primaquine Diphosphate: GC-MS Analysis,” Asian Journal of Chemistry, Vol. 17, No. 3, 2005, pp. 1678-1688.
- V. G. Dongre, P. P. Karmuse, M. M. Nimbalkar, D. Singh and A. Kumar, “Applications of GC-EI-MS for the Identification and Investigation of Positional Isomer in Primaquine, an Antimalarial Drug,” Journal of Pharmaceutical and Biomedical Analysis, Vol. 39, No. 1-2, 2005, pp. 111-116. doi:10.1016/j.jpba.2005.03.019
- I. Brondz, “SFC-MS Analysis of Contaminants in Primaquine Diphosphate Tablets and Spectral UV and NMR Characterizing of Primaquine and Quinocide,” In: E. Csizmadia and I. Kalnoky, Eds., Antimalarial Drugs: Costs, Safety and Efficacy, Chapter 5, Nova Science Publishers, Inc., New York, 2009, pp. 105-124.
- I. Brondz, “Historical Overview of Chromatography and Related Techniques in Analysis of Antimalarial Drug Primaquine,” In: T. J. Quintin, Ed., Chromatography: Types, Techniques and Methods, Chapter 6, Nova Science Publishers, Inc., New York, 2010, pp. 281-322.
- I. Brondz, “Historical Overview of Chromatography and Related Techniques,” In: I. Brondz, Ed., Analysis of Antimalarial Drug Primaquine, Nova Science Publishers, Inc., New York, 2011.
- R. C. Elderfield, W. J. Gensler, J. D. Head, H. A. Hageman, C. B. Kremer, J. B. Wright, A. D. Holley, B. Williamson, J. Galbreath, L. Wielderhold III, R. Frohardt, S. M. Kupchan, T. A. Williamson and O. Birstein, “Alkylaminoalkyl Derivatives of 8-Aminoquinoline1,” Journal of the American Chemical Society, Vol. 68, No. 8, 1946, pp. 1524-1528. doi:10.1021/ja01212a040
- S. P. Singh, S. S. Parmar and V. I. Stenberg, “Carbon-13 Nuclear Magnetic Resonance Spectra of Potent Antimalarials: Primaquine and Chloroquine,” Journal of Heterocyclic Chemistry, Vol. 15, No. 1, 1978, pp. 9-11. doi:10.1002/jhet.5570150102
- A. M. Clark, C. D. Hufford and J. D. McChesney, “Primaquine: Metabolism by Microorganisms and 13C Nuclear Magnetic Resonance Assignments,” Antimicrobial Agents and Chemotherapy, Vol. 19, No. 2, 1981, pp. 337- 341.